
Upwards movement for the week leaves three Elliott wave counts valid.
Summary: There is an upwards trend in place that is very extreme. Conditions are overbought. This can continue while price moves a considerable distance further, or a trend change may occur at any time now. Caution is warranted. Risk management is essential.
The bullish Elliott wave count expects a large interruption to the trend may now have begun. It may last about four to ten weeks and may end about 1,431.
The bearish Elliott wave count expects the upwards trend may now have ended. The first confidence point is at 1,401.30. Thereafter, a new low below 1,346.45 would see the bullish wave count discarded and a bearish wave count the only remaining count.
A new high above 1,533.34 would leave the new bearish alternate and the bullish wave counts valid.
Grand SuperCycle analysis is here.
Monthly charts were last published here with video here.
BEARISH ELLIOTT WAVE COUNT
WEEKLY CHART
Click chart to enlarge.
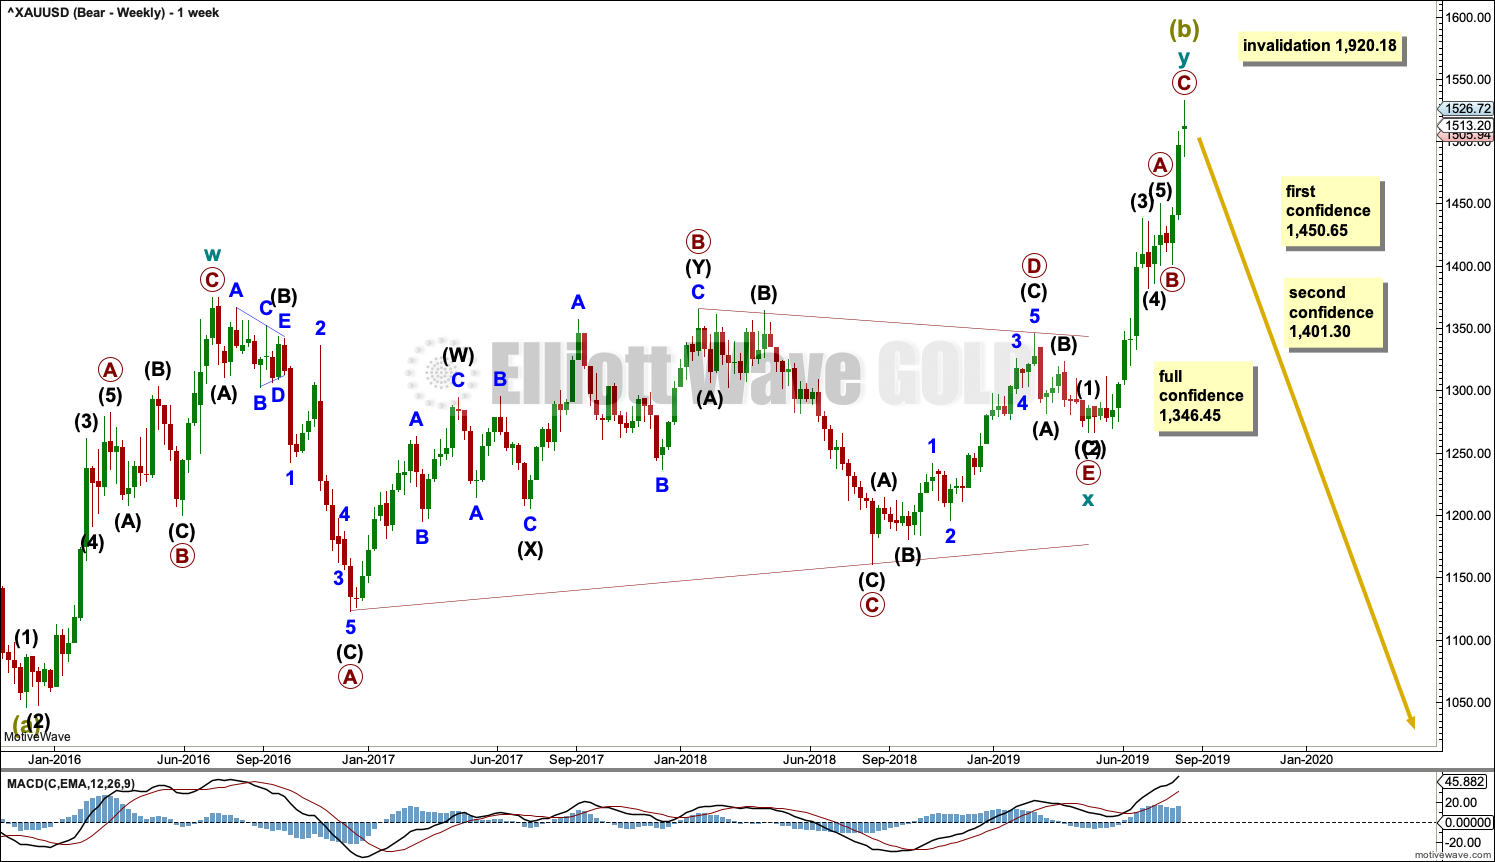
It is now possible that Super Cycle wave (b) is a complete double zigzag.
The first zigzag in the double is labelled cycle wave w. The double is joined by a three in the opposite direction, a triangle labelled cycle wave x. The second zigzag in the double is labelled cycle wave y.
Cycle wave y now fits as a complete zigzag.
The purpose of the second zigzag in a double is to deepen the correction. Cycle wave y has achieved this purpose.
A new low below 1,450.65 would invalidate the new bearish alternate below and add a little confidence to this wave count.
1,401.30 is the start of primary wave C. A new low below this point could not be a second wave correction within primary wave C, so at that stage primary wave C would be confirmed as over.
A new low below 1,346.45 would invalidate the bullish wave count below and add confidence to a bearish wave count.
Two daily charts below look at the zigzag of cycle wave y in two different ways.
DAILY CHART
Click chart to enlarge.
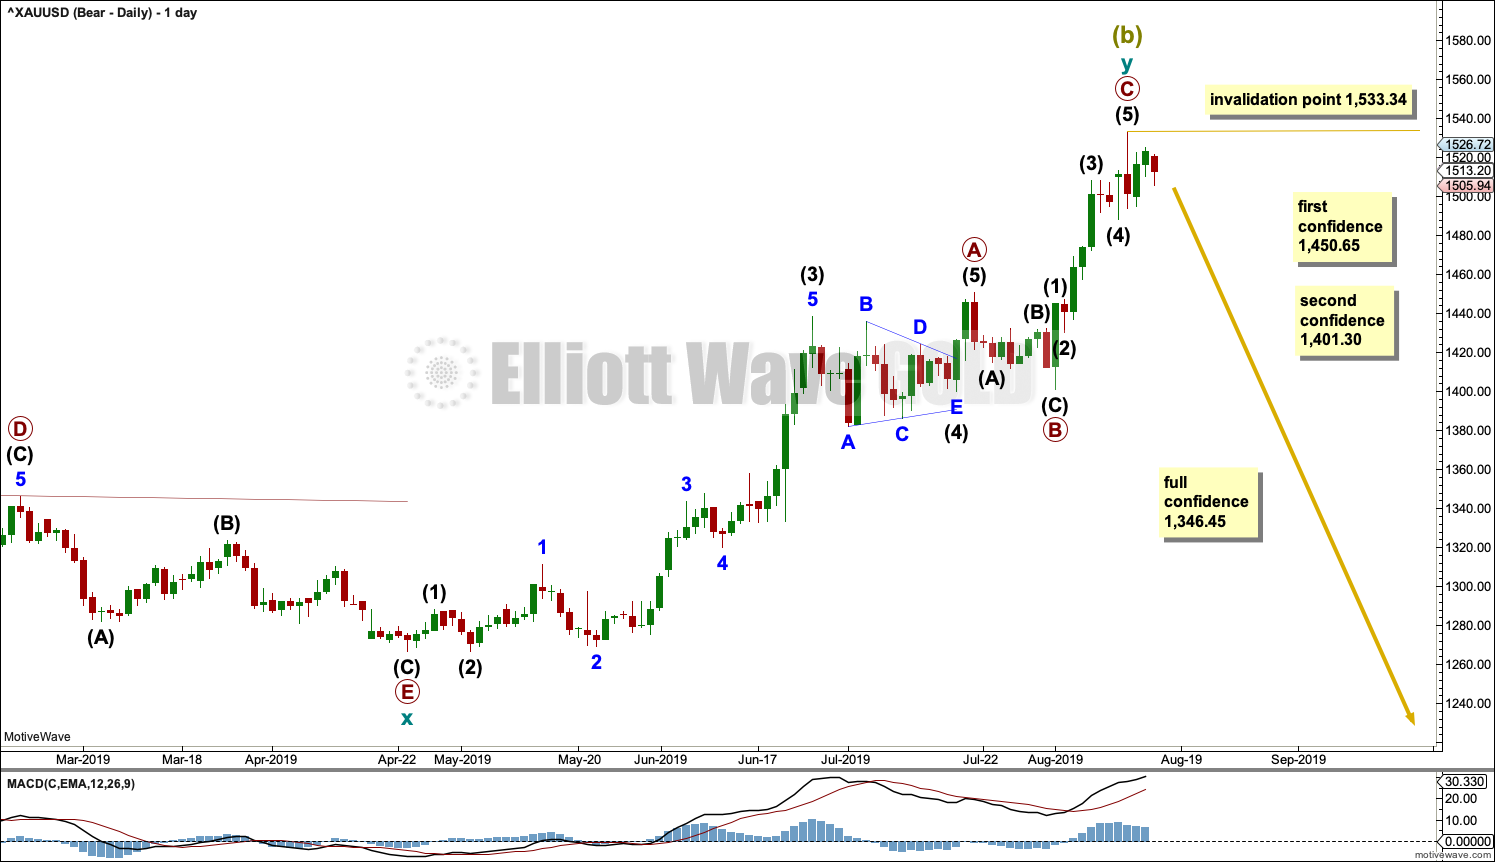
Primary wave C may now be a complete five wave structure.
If there has been a trend change, then downwards movement should unfold as a five wave structure from the high. Downwards movement should exhibit strength in either rising ATR or volume.
No second wave correction within a new downwards trend may move beyond the start of its first wave above 1,533.34.
HOURLY CHART
Click chart to enlarge.
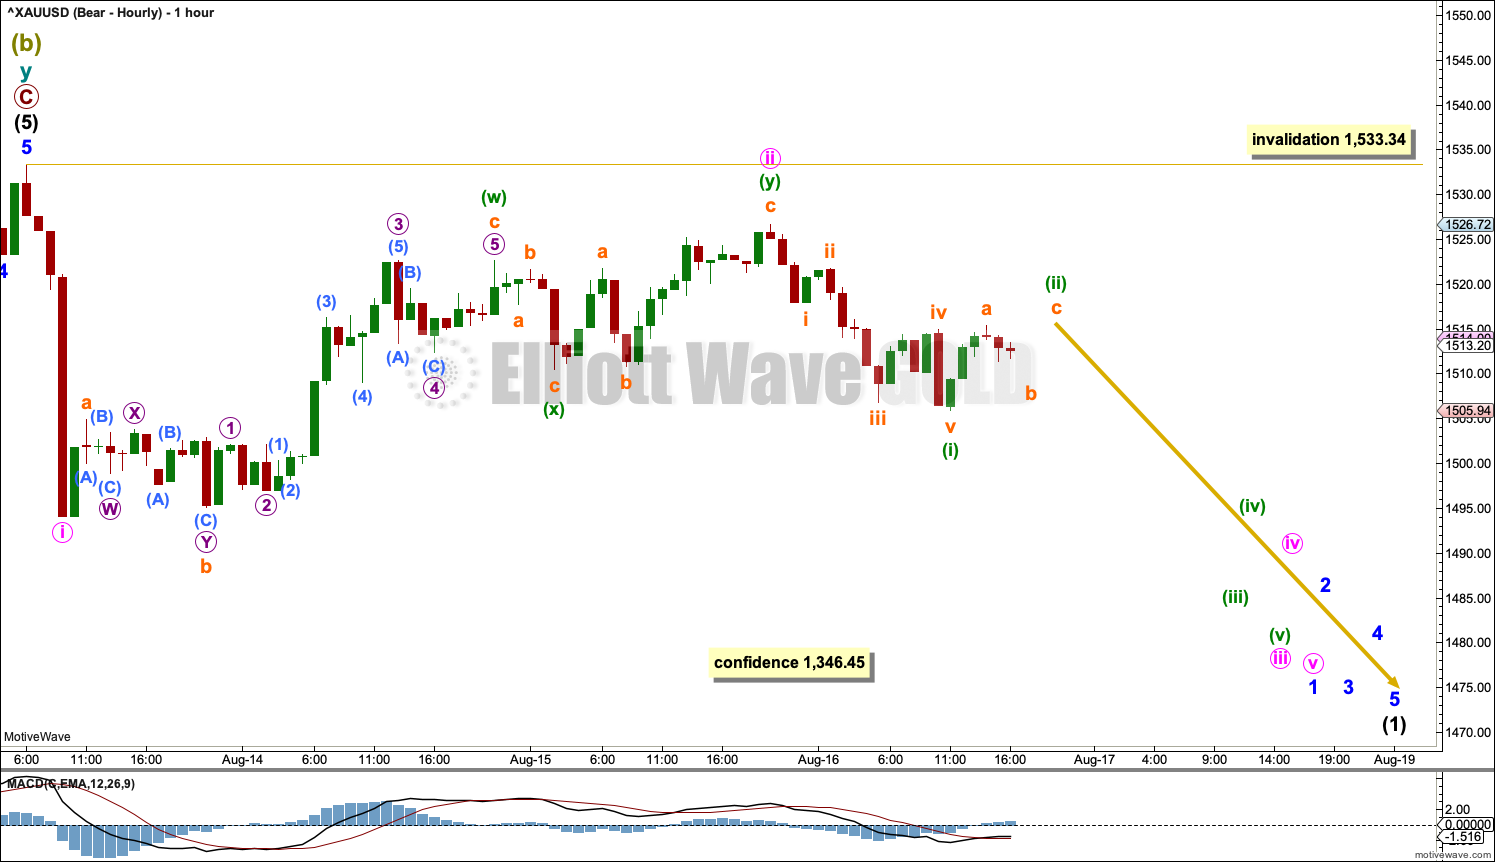
Intermediate wave (5) may now be a complete five wave structure. Downwards movement from the high is swift and strong, typical of the start of a first wave.
Minute wave ii may be a complete double zigzag. If minuette wave (y) continues sideways as a flat correction, then minute wave ii may complete as a double combination. Minute wave ii may not move beyond the start of minute wave i above 1,533.34.
If price does make a new high by any amount at any time frame above 1,533.34, then the new bearish alternate wave count below may be used.
ALTERNATE DAILY CHART
Click chart to enlarge.
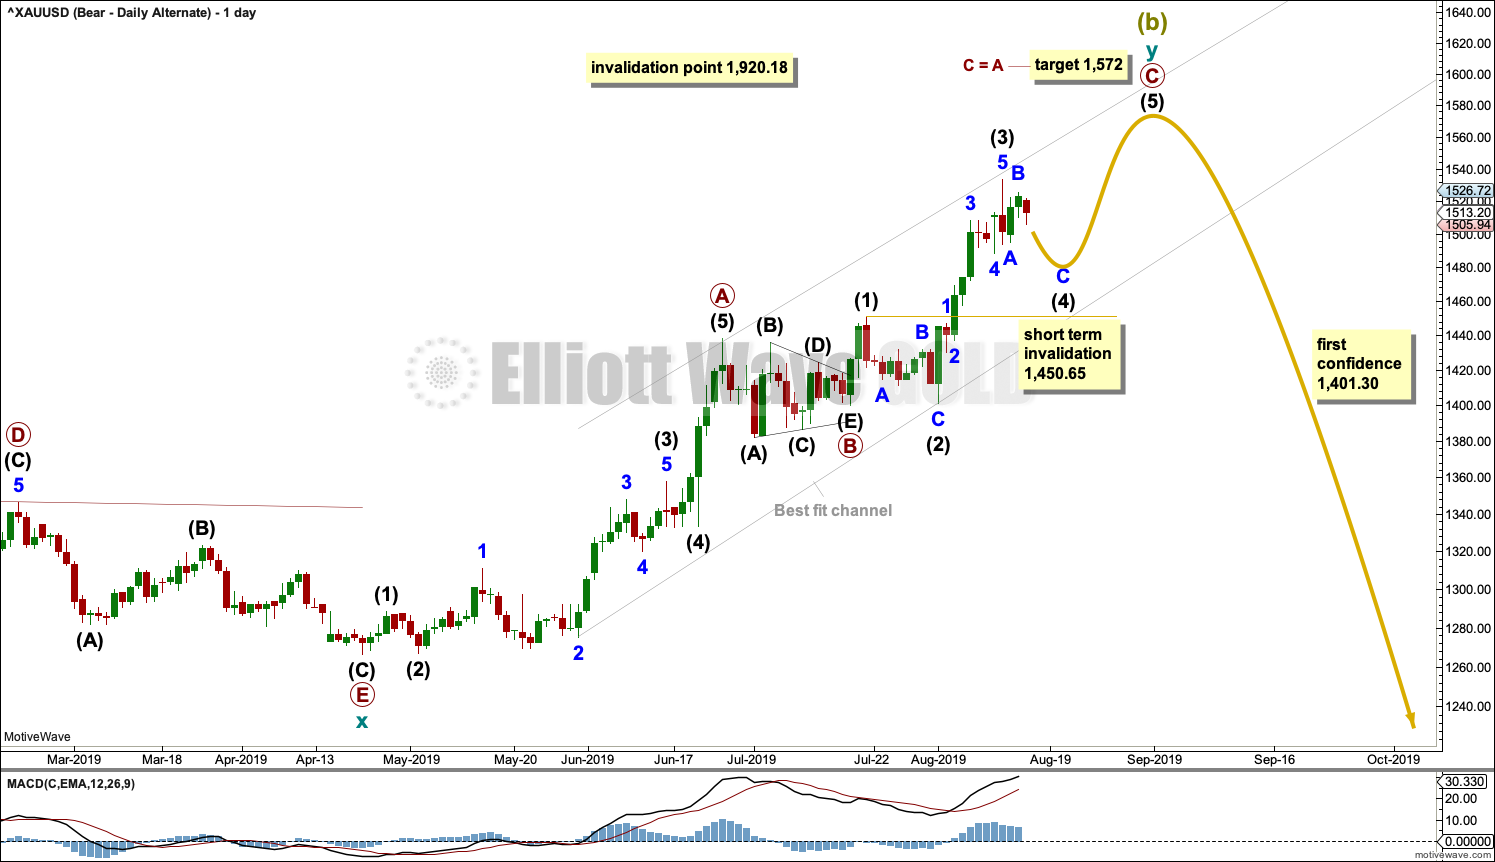
Both bearish wave counts at the daily and weekly chart level today see cycle wave y beginning at the same point at 1,266.61 on the 24rd of April 2019. Thereafter, this alternate wave count looks at the zigzag of cycle wave y differently.
Within cycle wave y, the triangle that ended on the 17th of July may have been primary wave B. Primary wave C may have begun there. Primary wave C must subdivide as a five wave structure; it may be completing as an impulse.
Intermediate waves (1), (2) and (3) within the impulse of primary wave C may be complete. Intermediate wave (3) for this wave count is just 0.33 longer than 2.618 the length of intermediate wave (1).
Intermediate wave (4) may be unfolding sideways as a small consolidation to continue for a few more days. Intermediate wave (2) completed as a deep 0.98 zigzag lasting 9 sessions. Intermediate wave (4) may exhibit alternation as a flat, triangle or combination. Within those structural possibilities, any one of an expanded flat, running triangle or combination may include a new high above 1,533.34. A new high above 1,533.34 would invalidate the first bearish wave count and leave this alternate valid.
Intermediate wave (4) may not move into intermediate wave (1) price territory below 1,450.65.
BULLISH ELLIOTT WAVE COUNT
WEEKLY CHART
Click chart to enlarge.
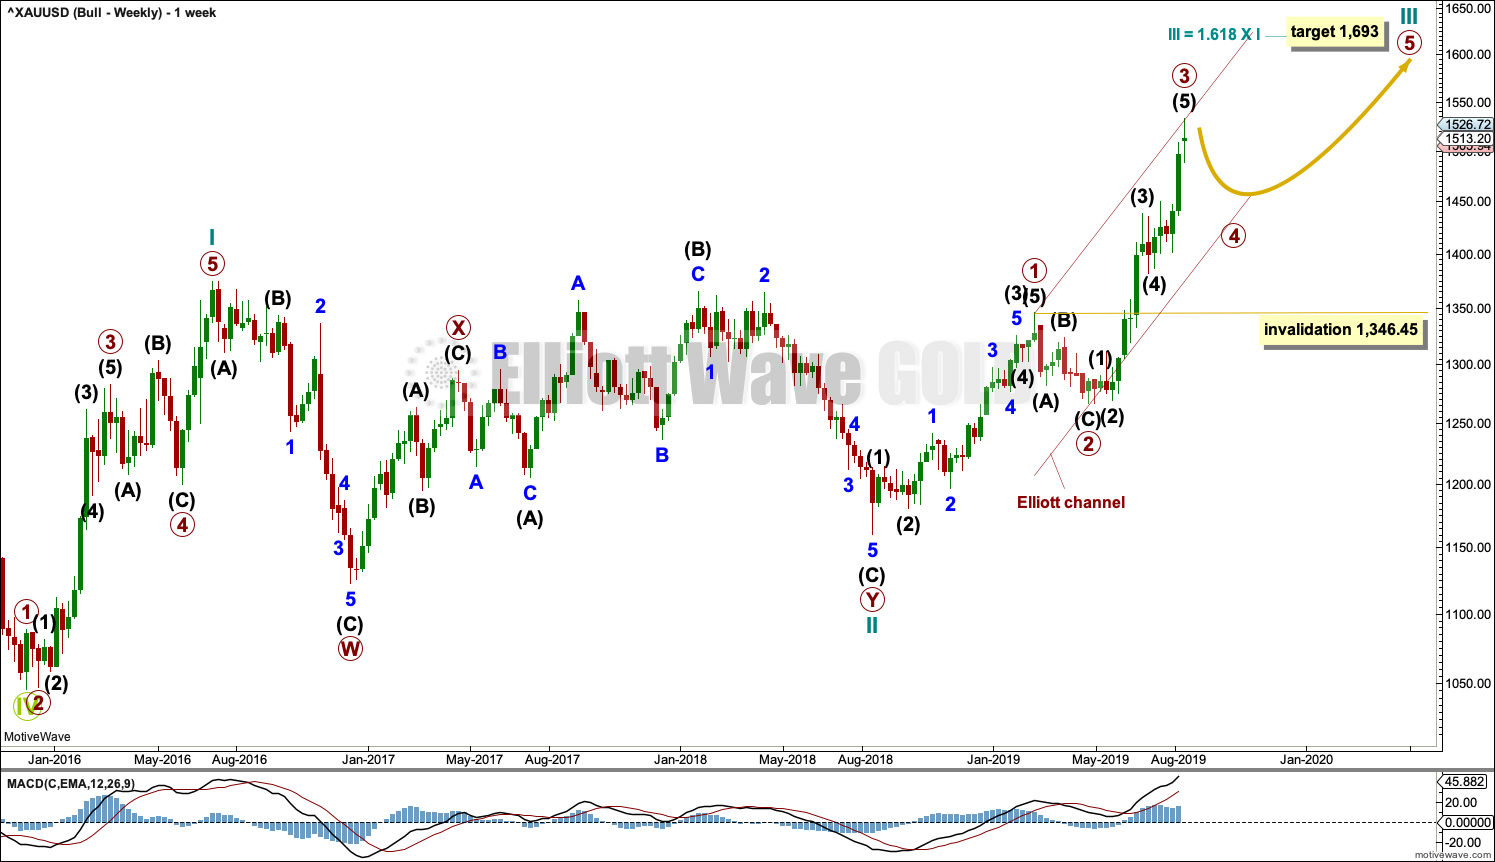
This wave count sees the the bear market complete at the last major low for Gold in November 2015.
If Gold is in a new bull market, then it should begin with a five wave structure upwards on the weekly chart. However, the biggest problem with this wave count is the structure labelled cycle wave I because this wave count must see it as a five wave structure, but it looks more like a three wave structure.
Commodities often exhibit swift strong fifth waves that force the fourth wave corrections coming just prior and just after to be more brief and shallow than their counterpart second waves. It is unusual for a commodity to exhibit a quick second wave and a more time consuming fourth wave, and this is how cycle wave I is labelled. This wave count still suffers from this very substantial problem, and for this reason the bearish wave count is still considered because it has a better fit in terms of Elliott wave structure.
Cycle wave II subdivides well as a double combination: zigzag – X – expanded flat.
Cycle wave III may have begun. Within cycle wave III, primary waves 1 and 2 may now be complete. Primary wave 3 has now moved above the end of primary wave 1 meeting a core Elliott wave rule. It has now moved far enough to allow room for primary wave 4 to unfold and remain above primary wave 1 price territory. Primary wave 4 may not move into primary wave 1 price territory below 1,346.45.
Cycle wave III so far for this wave count would have been underway now for 52 weeks. It is beginning to exhibit some support from volume and increasing ATR. This wave count now has some support from classic technical analysis.
The channel drawn about cycle wave III is an Elliott channel. Primary wave 4 may find support about the lower edge.
DAILY CHART
Click chart to enlarge.
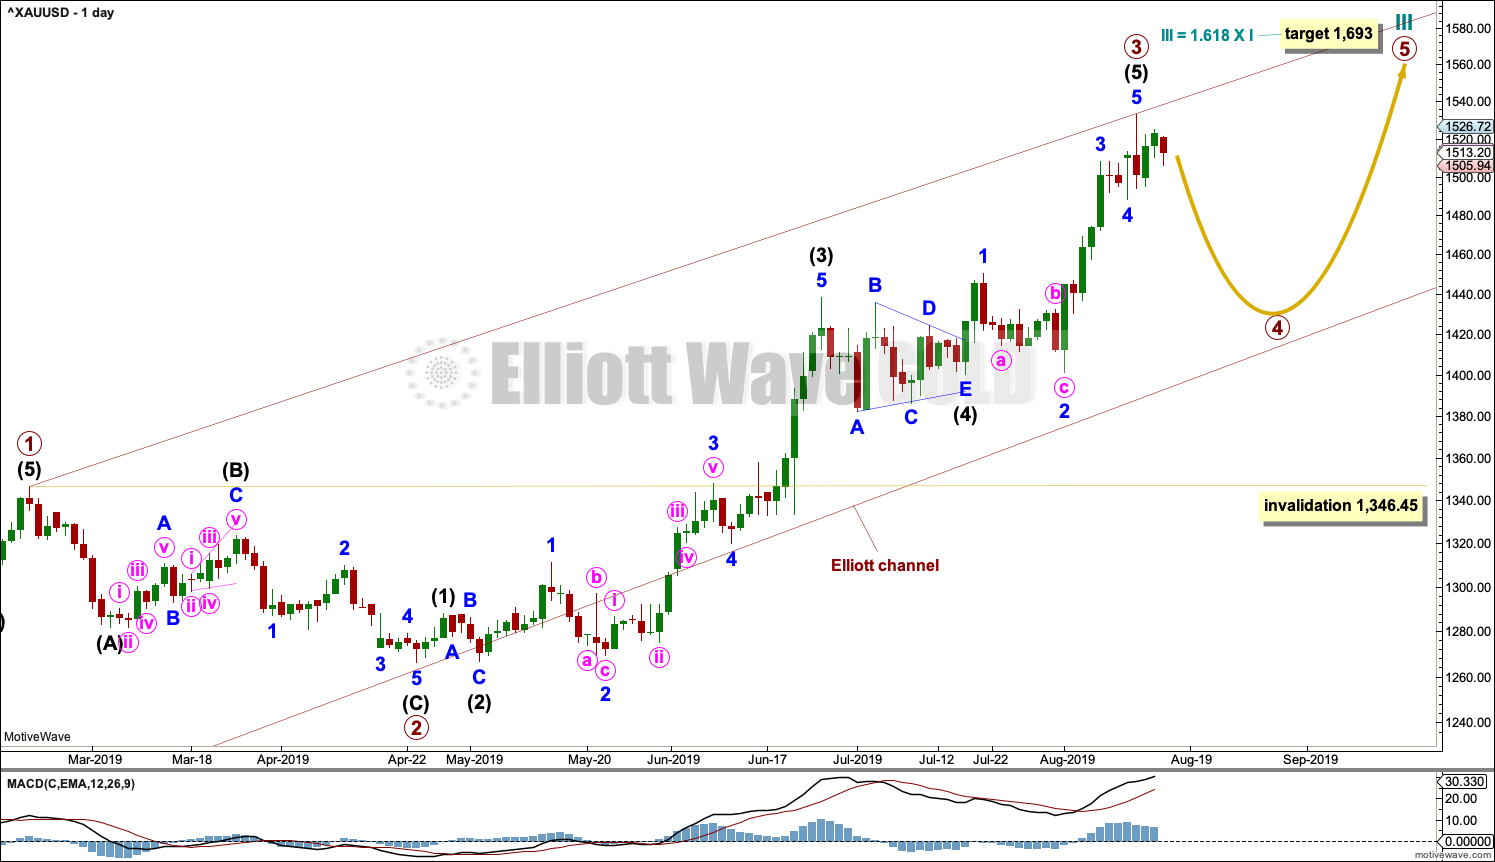
Primary wave 3 may now be a complete impulse. The structure of intermediate wave (5) is now complete.
Primary wave 4 may not move into primary wave 1 price territory below 1,346.45.
Primary wave 4 may last about four to ten weeks. It may unfold as any one of more than 23 possible Elliott wave corrective structures. Primary wave 4 may end within the price territory of the fourth wave of one lesser degree; intermediate wave (4) has its range from 1,438.43 to 1,382.10.
Within the price territory of intermediate wave (4), from 1,438.43 to 1,382.10, lies the 0.382 Fibonacci Ratio of primary wave 3 at 1,431.45. This is the preferred target for primary wave 4.
HOURLY CHART
Click chart to enlarge.
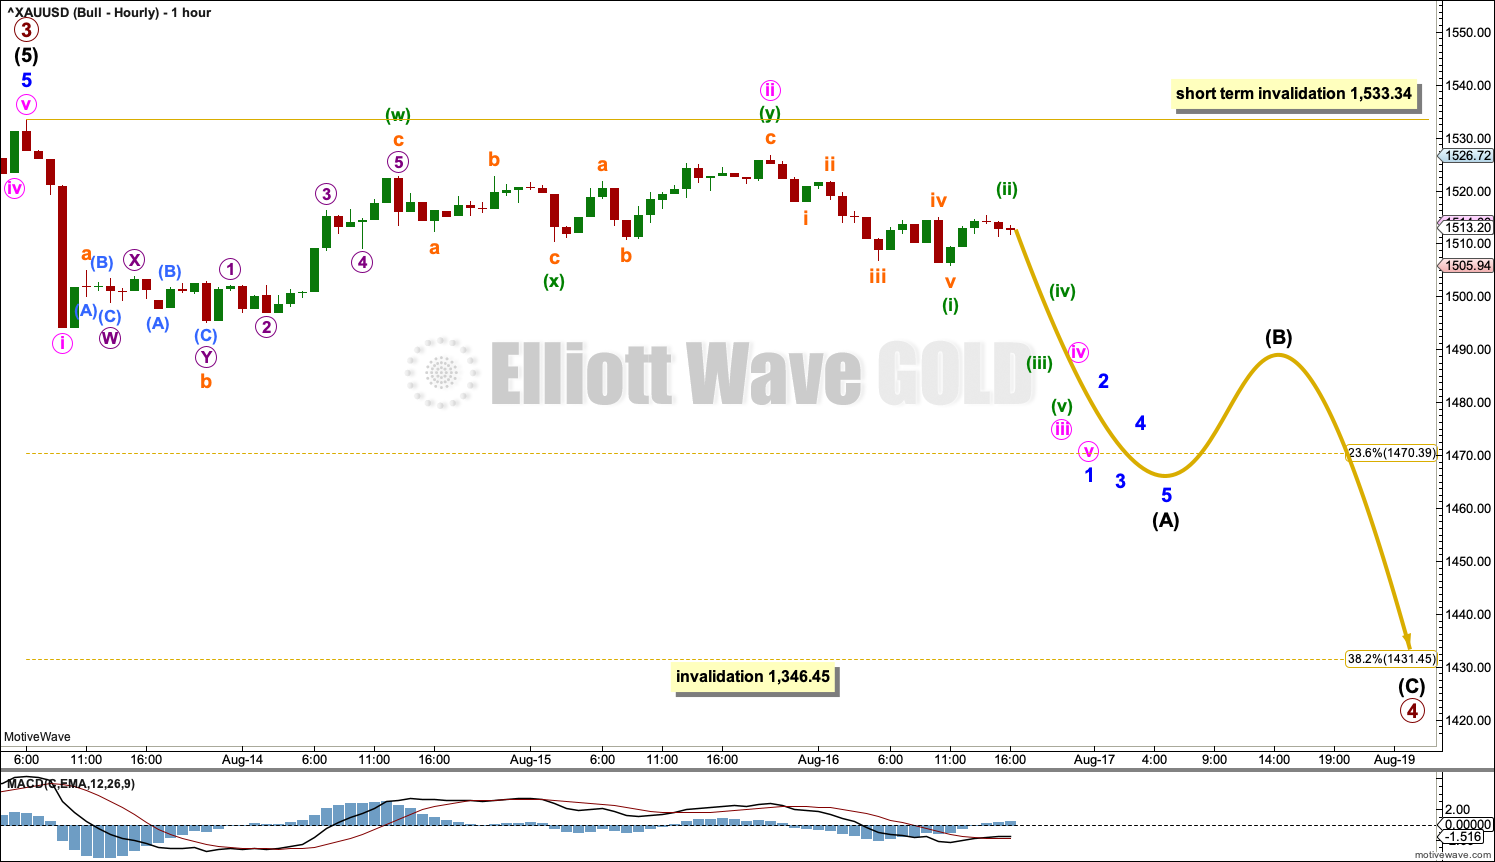
A new trend at primary degree should begin with a five down on the hourly chart. Within this first five down, minute wave ii may not move beyond the start of minute wave i above 1,533.34.
If primary wave 4 unfolds as any one of an expanded flat, running triangle or combination, then it may include a new high above 1,533.34 within wave B or X of the corrective structure. In coming weeks the invalidation point at 1,533.34 may no longer apply (this is a short-term invalidation point only).
If price makes a new high by any amount at any time frame above 1,533.34, then the alternate hourly chart below may be used.
ALTERNATE HOURLY CHART
Click chart to enlarge.
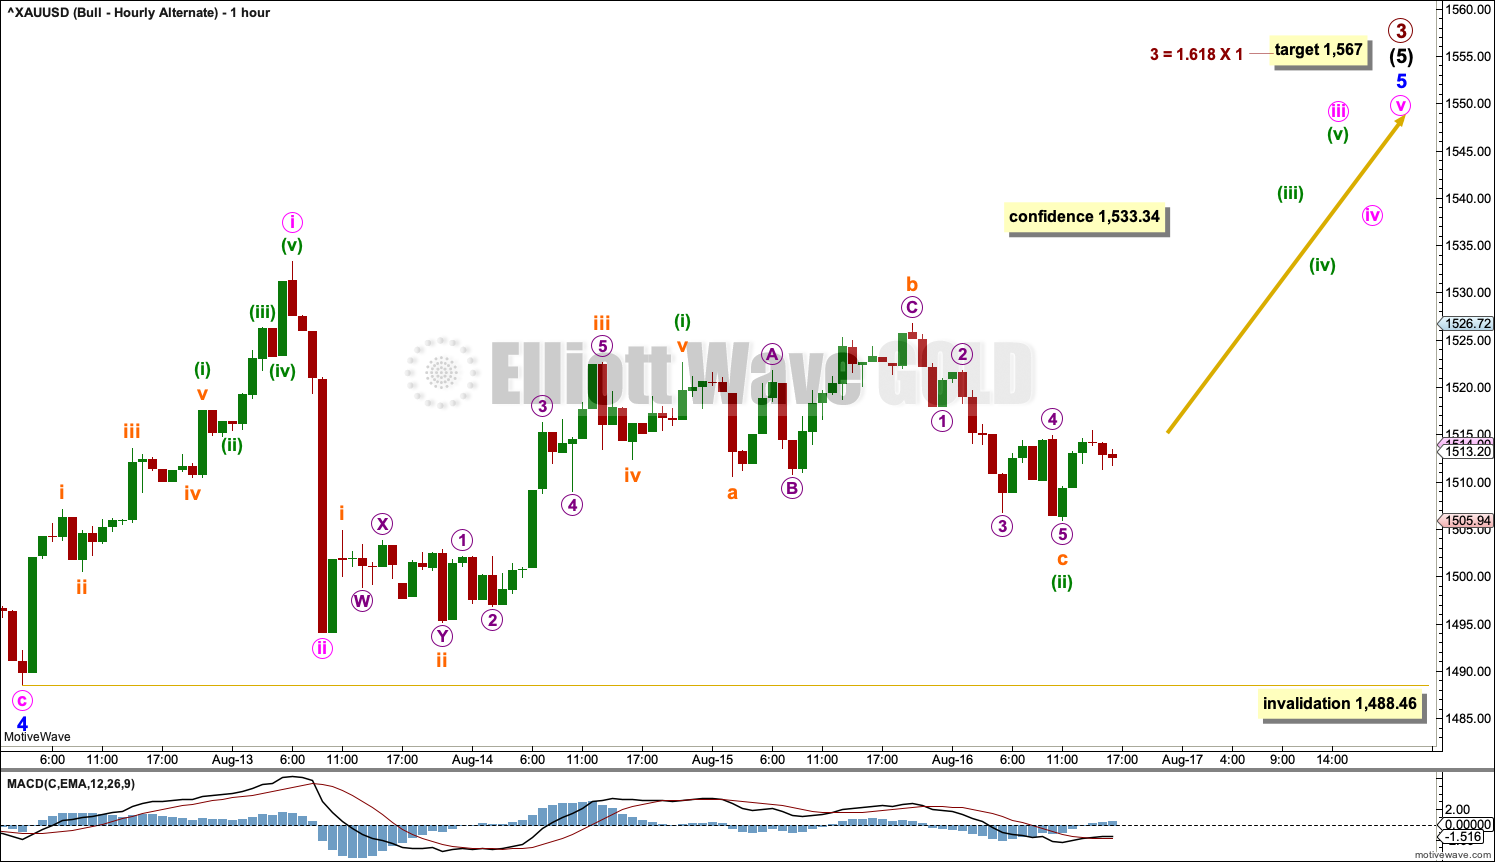
The degree of labelling within intermediate wave (5) is moved down one degree. Intermediate wave (5) may be an incomplete impulse. Within the impulse, minute waves i and ii may be complete.
If minute wave ii continues lower as a double zigzag, then it may not move beyond the start of minute wave i below 1,488.46.
Invalidation of this alternate wave count with a new low below 1,488.46 by any amount at any time frame would add confidence to the two main hourly wave counts in the short term.
TECHNICAL ANALYSIS
MONTHLY CHART
Click chart to enlarge. Chart courtesy of StockCharts.com.
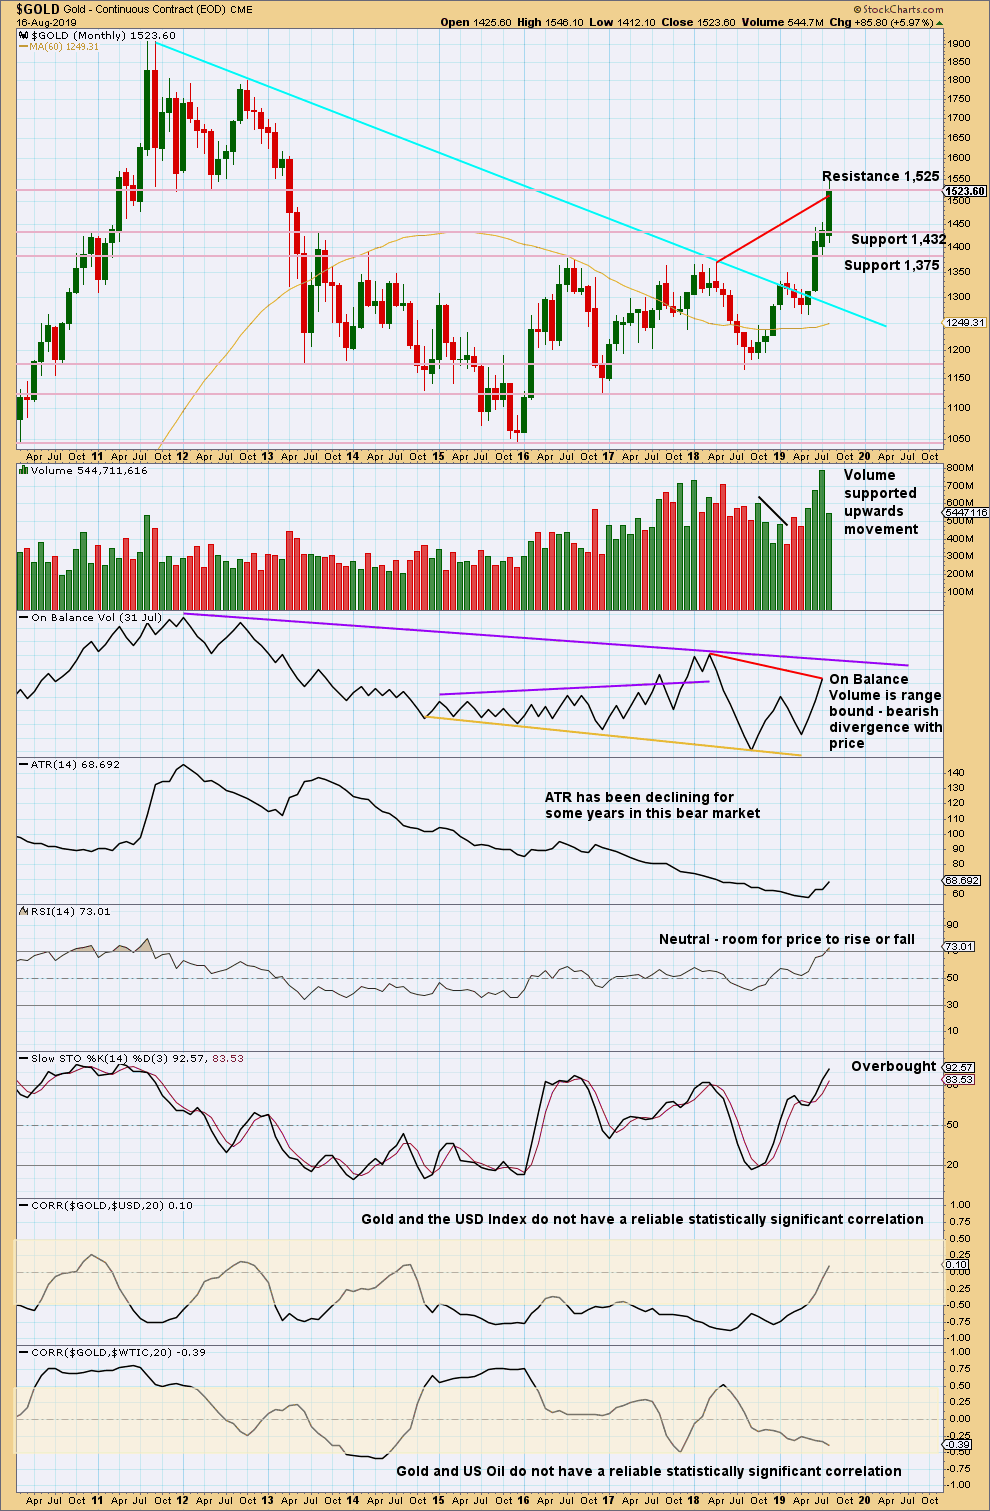
Gold has effected an upwards breakout above multi-year resistance and above the cyan bear market trend line. Price is now at strong resistance about 1,525.
The new high in price above prior highs for March / April 2018 have not been matched by new highs for On Balance Volume. This divergence is bearish and supports a bearish Elliott wave count. This divergence may be given a little weight because it is strong and evident on the monthly chart.
WEEKLY CHART
Click chart to enlarge. Chart courtesy of StockCharts.com.
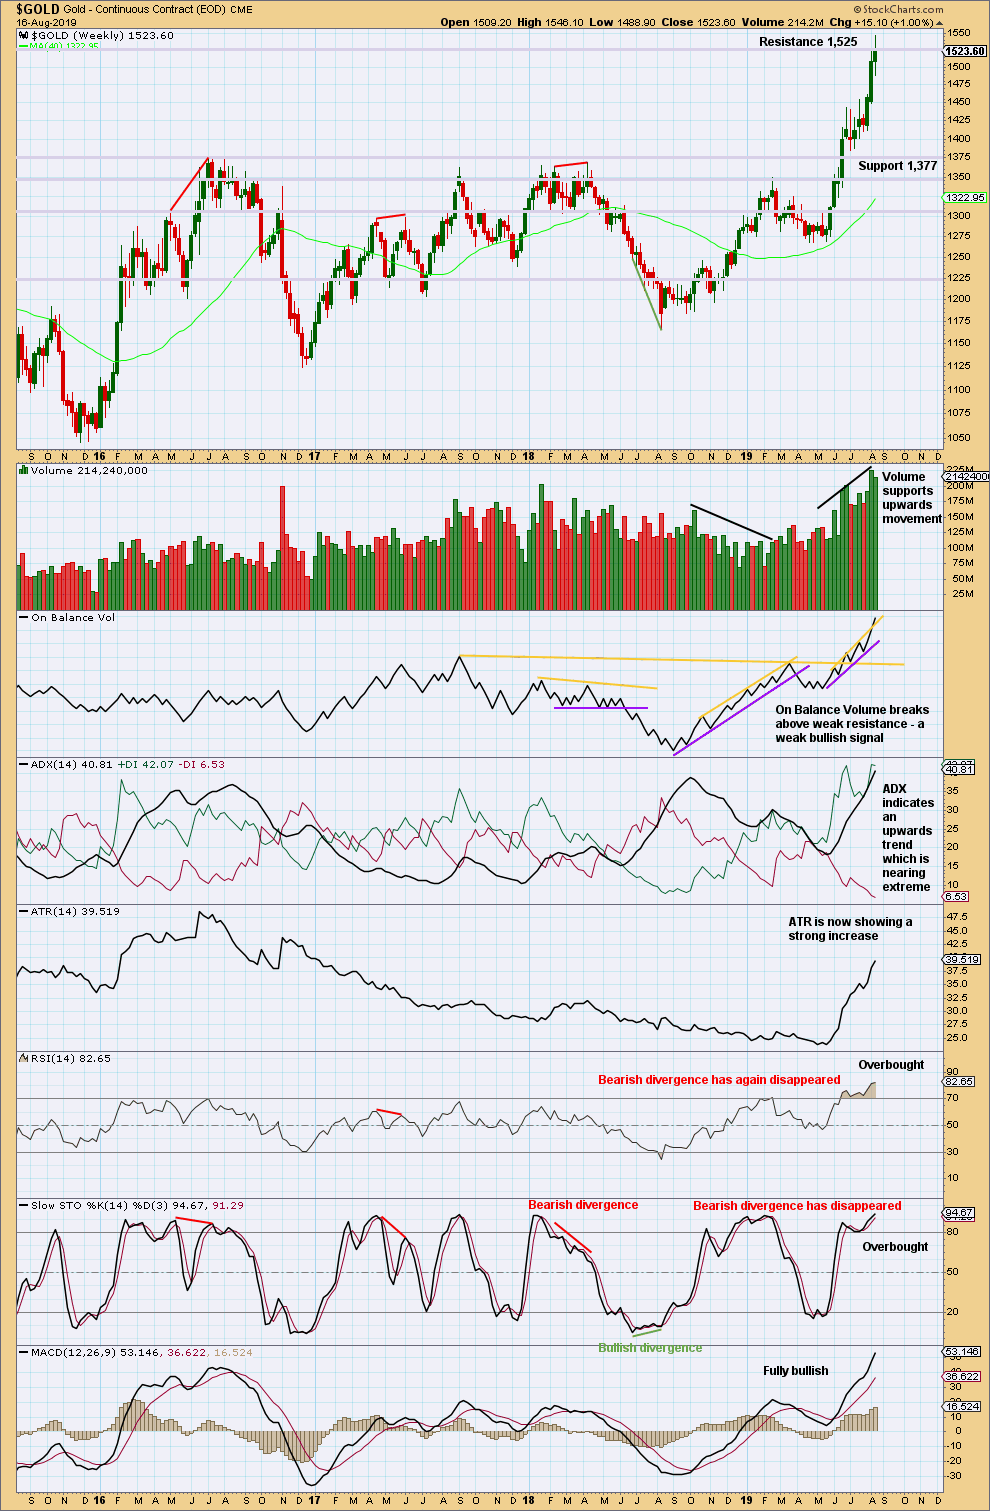
When trends for Gold reach extreme, they can continue still for a few weeks and price can continue for a considerable distance.
When both ADX and RSI reach extreme together, then that is sometimes where a trend ends.
RSI at overbought on the weekly chart is a warning to be cautious; the trend is overbought, but at this stage there is no evidence of a trend change.
The signal this week from On Balance Volume is weak because the resistance line breached has a strong slope and is not long held.
DAILY CHART
Click chart to enlarge. Chart courtesy of StockCharts.com.
Analysis of the last major bullish rise for Gold from November 2008 to September 2011:
There were several multi week consolidations or pullbacks along the way up. Below are listed the condition of technical indicators at the daily chart level at the start of each pullback which lasted more than four weeks:
On the 20th of February 2009: both an Evening Doji Star and a strong Bearish Engulfing candlestick appeared at the high, volume at the high was reasonable but not the strongest of prior days, ADX indicated an extreme upwards trend, RSI only just reached overbought and exhibited no bearish divergence with price, and On Balance Volume gave no signals.
On the 3rd of December 2009: both an Evening Doji Star and a very strong Bearish Engulfing candlestick appeared at the high with volume on the third downwards candlestick extremely strong, volume at the high was reasonable but weaker than 5 sessions prior, ADX was very extreme well over 50 both directional lines and had been extreme for a month, RSI was extremely overbought over 80 and exhibited no bearish divergence with price, and On Balance Volume gave no signals.
On the 21st of June 2010: a very strong Bearish Engulfing candlestick pattern appeared at the high with strong volume for the second bearish candlestick, volume at the high was not particularly strong in comparison to prior weeks, ADX only just indicated an upwards trend which was not extreme, RSI was not overbought, and On Balance Volume was at resistance.
On the 7th of December 2010: a strong Bearish Engulfing candlestick pattern at the high had support from volume for the bearish candlestick, volume had been declining up towards the high, ADX had been mostly declining for weeks and only just indicated an upwards trend at the high, RSI was not overbought and exhibited strong mid-term bearish divergence with price, and On Balance Volume gave no signals.
Within the very large consolidation from the low in November 2015, the major highs exhibited the following technical conditions:
On the 11th of March 2016: a strong bearish candlestick with a long upper wick at the high, the upwards day before the high had strong volume (not a blow off top) but at the high a red candlestick had weaker volume, ADX had reached very extreme and was declining, RSI was not overbought and exhibited weak bearish divergence with price, and On Balance Volume gave a weak bearish signal three days before the high.
On the 2nd of May 2016: a weak Evening Doji Star appeared at the high, up until the final day volume had been rising with price but remained weaker than seven sessions prior, on the final high volume was weak, neither ADX nor RSI were extreme, RSI exhibited no divergence with price, and On Balance Volume gave no signals.
On the 6th of July 2016: a strong Bearish Engulfing candlestick pattern occurred three days after the high, volume had been rising up until the last day of the high, a blow off top had appeared 7 sessions prior, ADX had reached extreme but only for a very few days, RSI was barely overbought and exhibited no divergence with price, and On Balance Volume gave a weak bearish signal.
On the 17th of April 2017: no candlestick reversal pattern appeared at the high, volume declined up to the high, ADX was not extreme and indicated an upwards trend, RSI was overbought and exhibited no bearish divergence with price, and On Balance Volume gave bullish signals after the high.
On the 8th of September 2017: there was no candlestick reversal pattern at the high, a blow off top appeared 3 sessions before the high, ADX only just reached extreme at the high, RSI was overbought and exhibited weak single bearish divergence with price, and On Balance Volume gave no signals.
On the 25th of January 2018: there was no candlestick reversal pattern at the high, a blow off top appeared at the high, ADX was extreme and had been so for weeks, RSI was overbought but exhibited no bearish divergence with price, and On Balance Volume gave no signals.
On the 11th of April 2018: there was a long upper wick at the high followed by a strong bearish candlestick the next day, there was a blow off top at the high, ADX only barely indicated an upwards trend, RSI was neutral and exhibited strong mid-term bearish divergence with price, and On Balance Volume exhibited mid-term bearish divergence with price.
On the 20th of February 2019: there was an Evening Star candlestick reversal pattern at the high, up until the day of the high volume had supported rising price, ADX only just exhibited an upwards trend which had previously reached extreme, RSI was overbought and exhibited no divergence with price, and On Balance Volume gave no signals.
The above analysis of 12 minor to major highs is summarised:
-7 of 12 cases exhibited a bearish candlestick pattern.
-Volume in 3 of 12 cases was reasonable but exhibited some decline from prior days or weeks.
-Volume in 3 of 12 cases had been rising with price up to the high or up to one session before.
-Volume in 2 of 12 cases had been declining up to the high.
-Blow off tops appeared in only 2 of 12 cases.
-Blow off tops appeared up to 7 sessions prior in 2 of 12 cases.
-ADX was extreme in 6 of 12 cases from a few days to a few weeks.
-RSI was overbought in 7 of 12 cases.
-RSI exhibited weak to strong bearish divergence in 4 of 12 cases.
-On Balance Volume gave bearish signals either at the high or up to 3 sessions after the high in 3 of 12 cases.
-On Balance Volume gave bullish signals in days immediately after the high in 1 of 12 cases.
Conclusions:
Evidence of a bearish candlestick pattern is a strong indicator of a minor or major high in place. The short to mid-term volume profile can be variable. Blow off tops are uncommon at minor to major highs, and are equally as likely to be either right at the high or up to a few sessions prior. RSI at overbought increases the probability of a minor to major high occurring, but it can persist for weeks before price turns. ADX likewise can persist at extreme for weeks before price turns and may not even reach extreme at minor or major highs. On Balance Volume is unlikely to exhibit a signal at a high but when it does it may increase the probability of a minor or major high having just occurred.
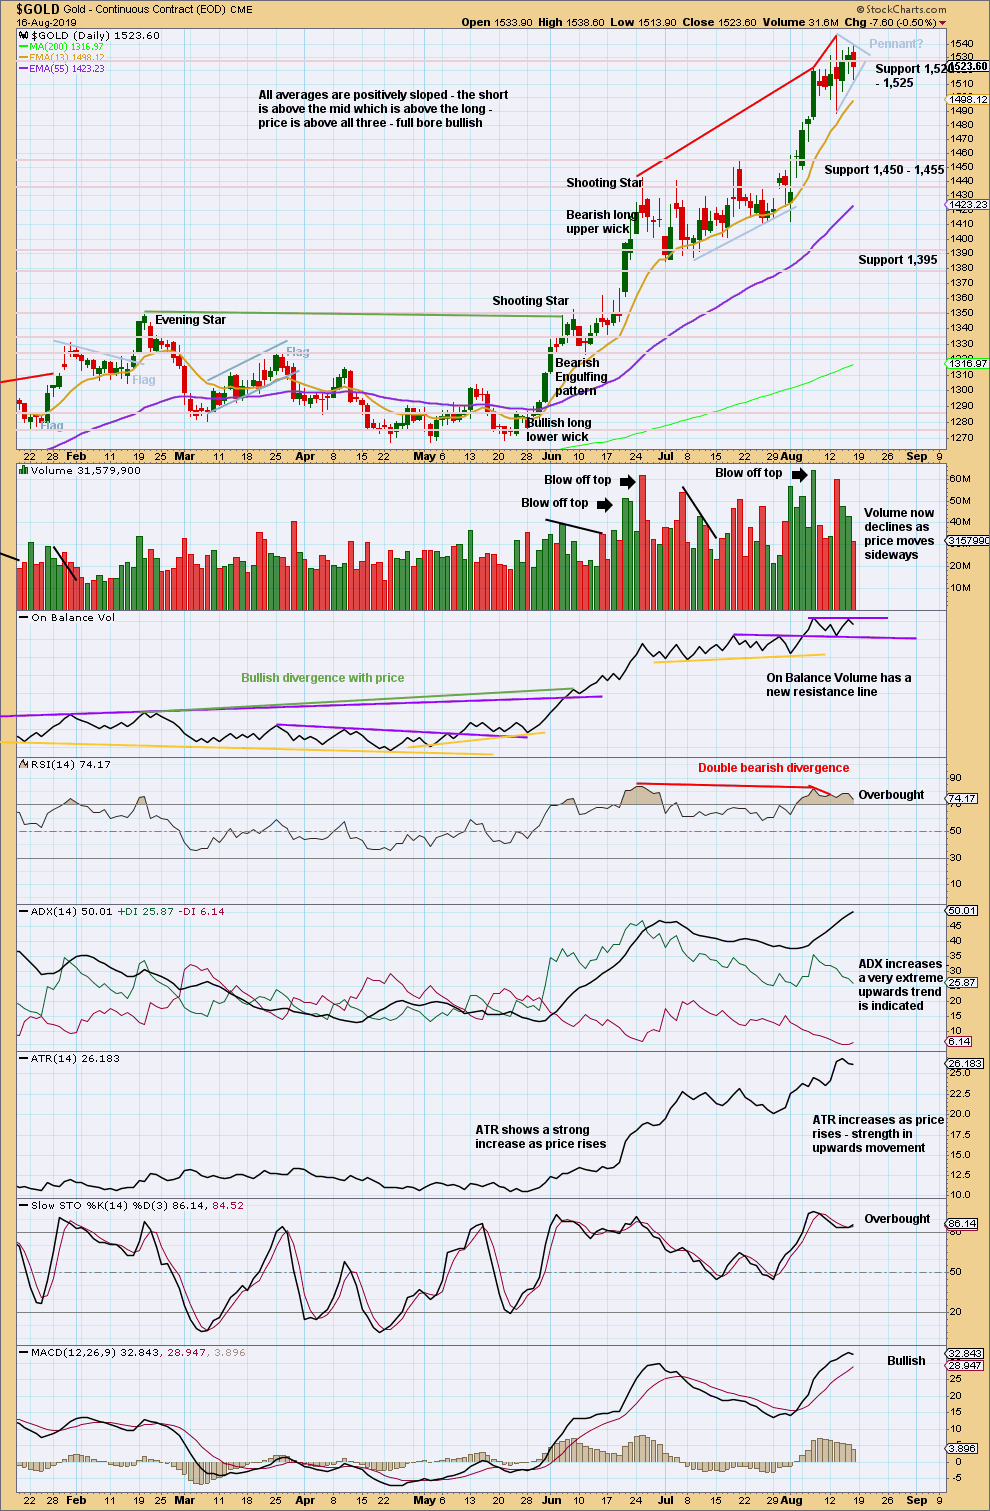
Currently, there is no bearish candlestick reversal pattern at the last high, there was a blow off top 4 sessions prior to the last high, ADX has reached very extreme, RSI also has reached overbought and exhibits bearish divergence with price, and On Balance Volume has given no signal. The probability that a major or minor high occurs here is heightened, but not certain. Extreme caution for long positions is warranted.
While price remains above the last swing low at 1,412.10, there is a series of higher highs and higher lows and an upwards trend in place. A new low below 1,412.10 would be a lower low and would confirm a trend change.
For the short term, a small pennant pattern may be forming. These are reasonably reliable continuation patterns. The target would be at 1,669.
On one day this week price has closed above prior strong resistance at 1,520 to 1,525, but it has not done so with support from volume. This potential upwards breakout is suspicious. For confidence an upwards breakout, support from volume is required.
GDX WEEKLY CHART
Click chart to enlarge. Chart courtesy of StockCharts.com.
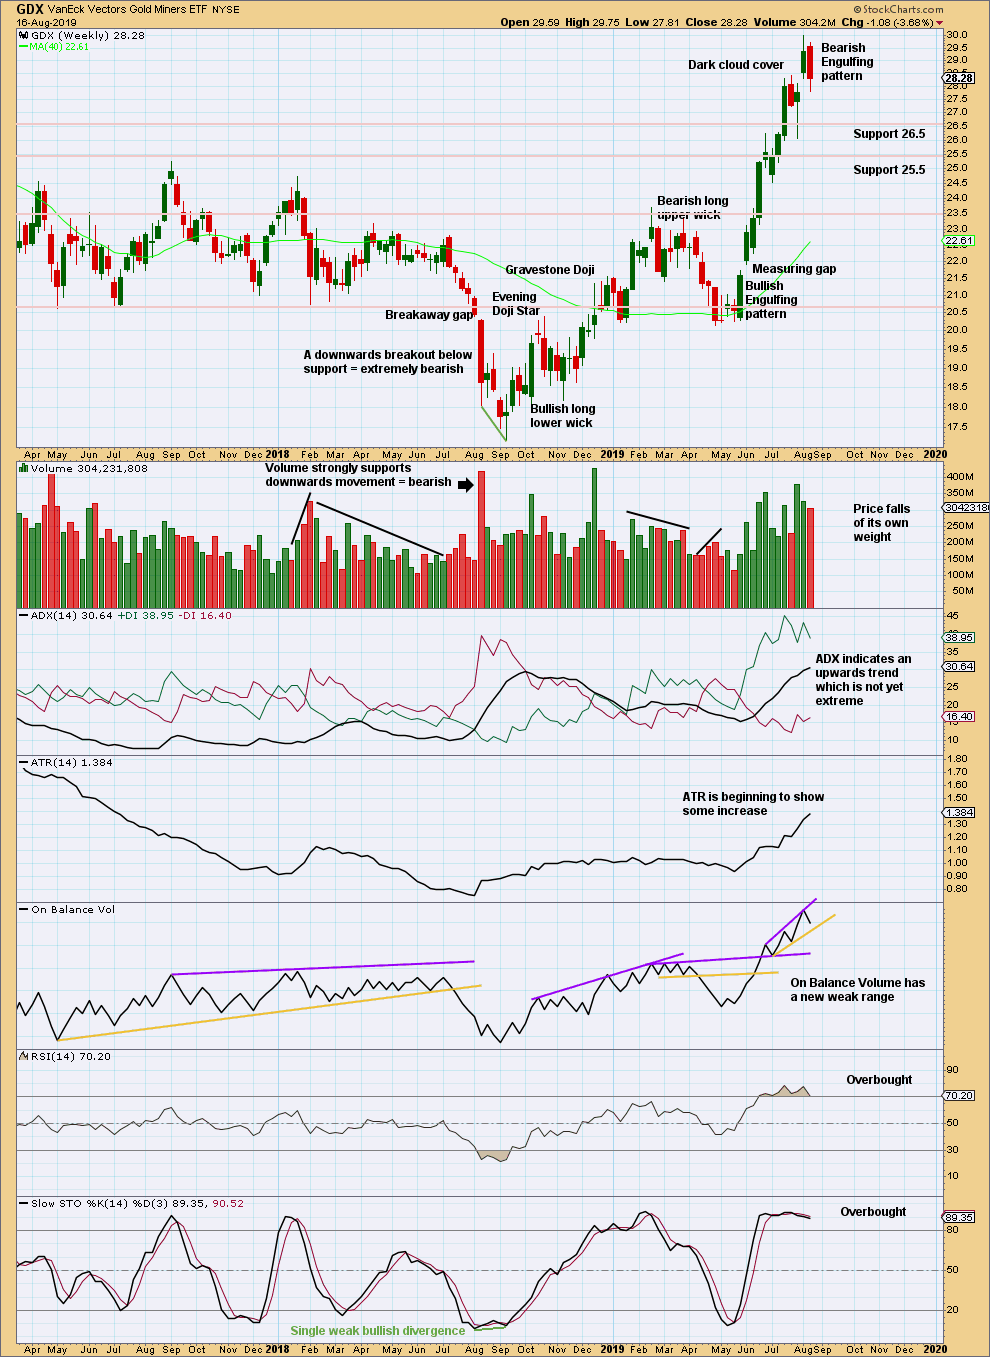
A strong Bearish Engulfing candlestick pattern is a strong warning that the upwards trend may now be over. A larger consolidation or a trend change may occur here.
GDX DAILY CHART
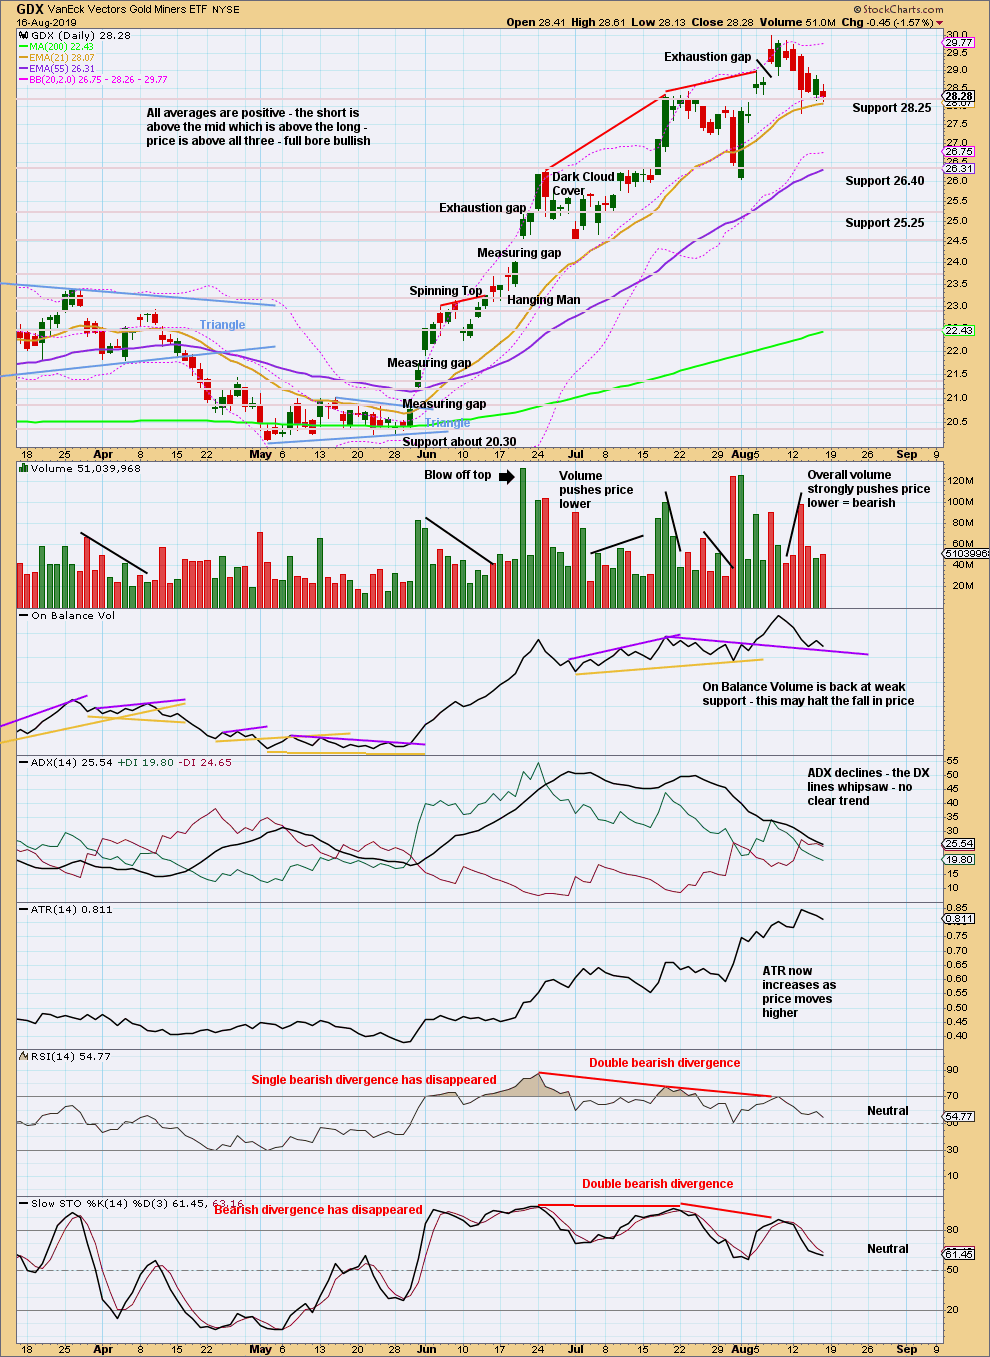
Click chart to enlarge. Chart courtesy of StockCharts.com.
A consolidation may have begun. Look for support about 28.4.
The last swing low was at 26.04. A new low below this point would confirm a trend change.
Published @ 11:58 p.m. EST.
—
Careful risk management protects your trading account(s).
Follow my two Golden Rules:
1. Always trade with stops.
2. Risk only 1-5% of equity on any one trade.
—
New updates to this analysis are in bold.
Hourly chart updated for the bear count: