
For the short term, upwards movement to at least 1,528.20 was expected. The high for Friday at 1,528.68 meets this expectation perfectly.
Summary: A classic analysis target using the pennant pattern is at 1,660. Friday broke above the upper edge of the pennant with support from volume. So far this looks like a classic upwards breakout.
The bearish Elliott wave count expects the consolidation is now over and a final fifth wave up has begun. The first target is new at 1,543. If price keeps rising through this first target, the next target is at 1,572.
The bullish Elliott wave count expects this consolidation may continue for another couple of weeks or so. It may be relatively shallow and may include a new high above 1,533.34. After an upwards breakout, the target would be at 1,693.
Grand SuperCycle analysis is here.
Monthly charts were last published here with video here.
BEARISH ELLIOTT WAVE COUNT
WEEKLY CHART
Click chart to enlarge.
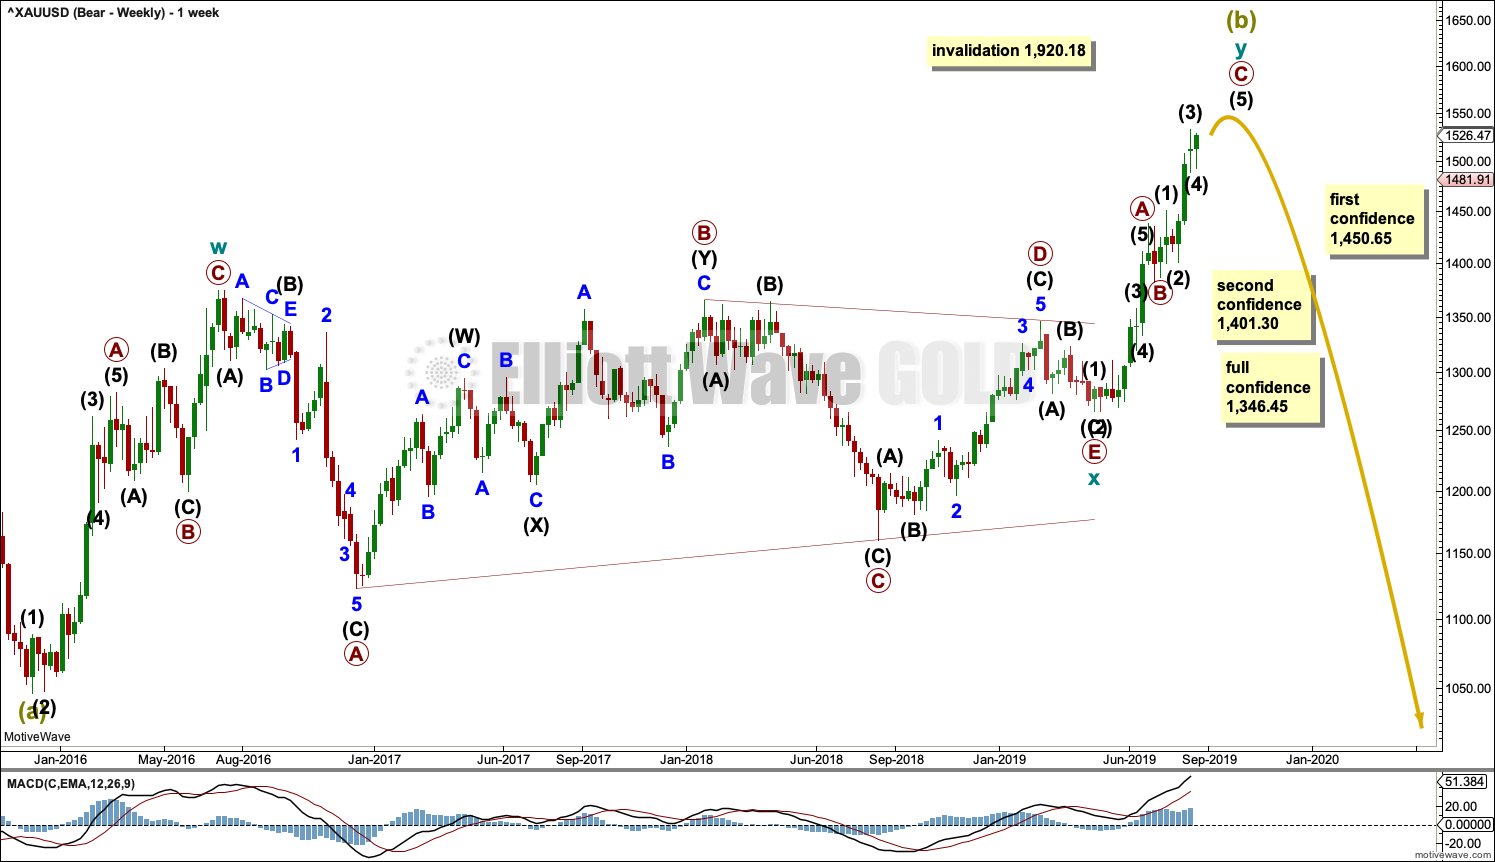
It is possible that Super Cycle wave (b) is completing as a double zigzag.
The first zigzag in the double is labelled cycle wave w. The double is joined by a three in the opposite direction, a triangle labelled cycle wave x. The second zigzag in the double is labelled cycle wave y.
Cycle wave y now fits best as an incomplete zigzag.
The purpose of the second zigzag in a double is to deepen the correction. Cycle wave y has achieved this purpose.
1,450.65 is the high of intermediate wave (1) within primary wave C. A new low below 1,450.65 could not be part of intermediate wave (4), so at that stage the structure of primary wave C would have to be compete. A new low below 1,450.65 would add some confidence in a trend change.
1,401.30 is the start of primary wave C. A new low below this point could not be a second wave correction within primary wave C, so at that stage primary wave C would be confirmed as over.
A new low below 1,346.45 would invalidate the bullish wave count below and add confidence to a bearish wave count.
Two daily charts below look at the zigzag of cycle wave y in two different ways.
DAILY CHART
Click chart to enlarge.
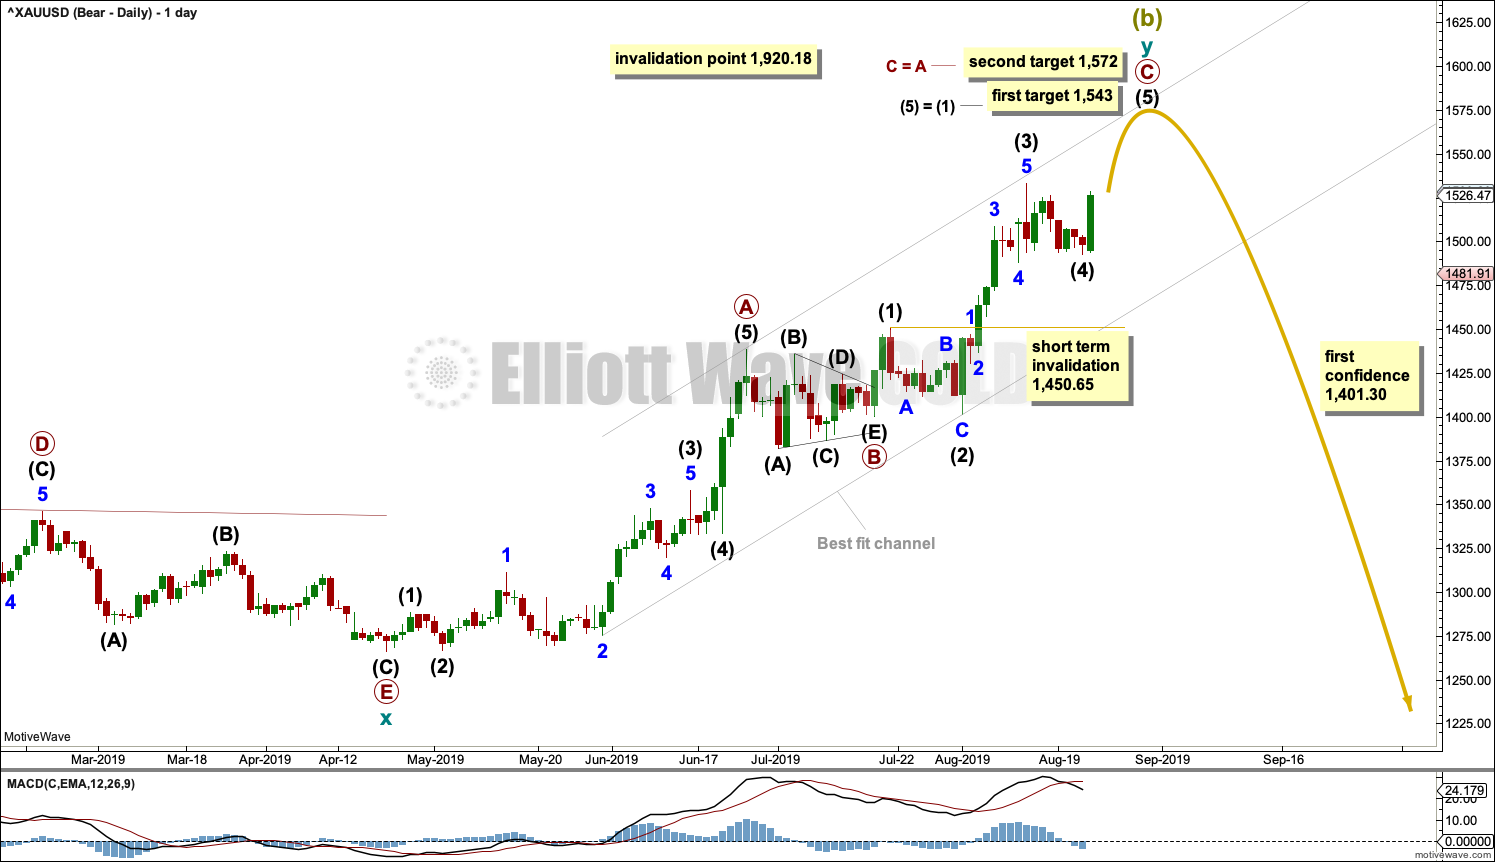
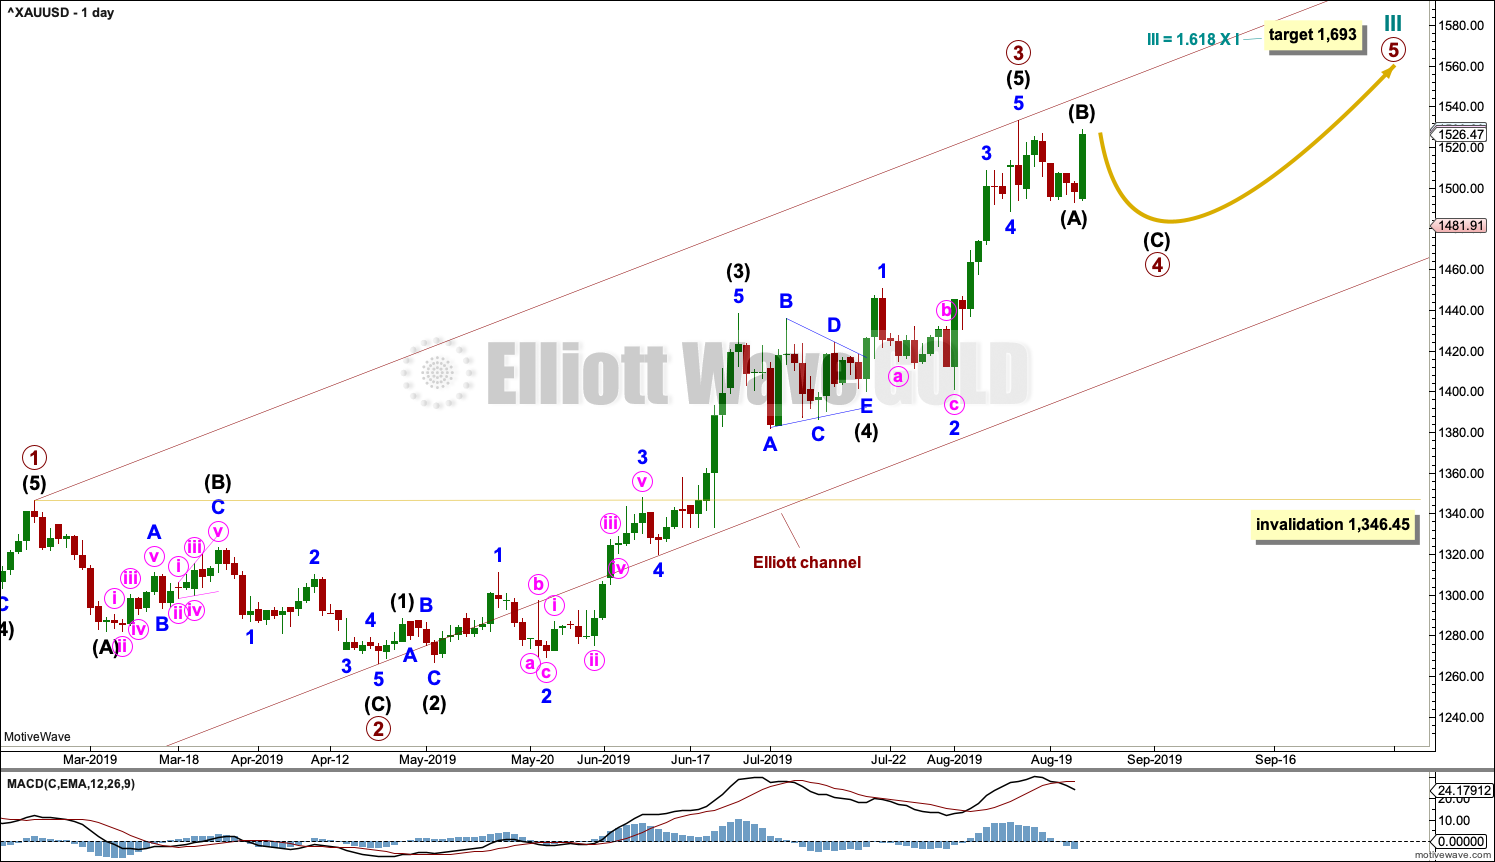
Within cycle wave y, the triangle that ended on the 17th of July may have been primary wave B. Primary wave C may have begun there. Primary wave C must subdivide as a five wave structure; it may be completing as an impulse.
Within primary wave C, intermediate waves (1) through to (4) may now all be complete. Intermediate wave (3) for this wave count is just 0.33 longer than 2.618 the length of intermediate wave (1).
There is now very good proportion between intermediate waves (2) and (4). Intermediate wave (2) is a very deep 0.98 zigzag lasting nine sessions, and intermediate wave (4) is a shallow 0.31 zigzag lasting seven sessions. Alternation in depth and not structure is acceptable. A zigzag is the most common corrective structure.
Two targets are now calculated for Super Cycle wave (b) to end. The first target expects intermediate wave (5) to exhibit the most common Fibonacci ratio to intermediate wave (1). If price gets to the first target and either the structure of intermediate wave (5) is incomplete or if price keeps rising, then the second target may be used. The second target expects primary wave C to exhibit the most common Fibonacci ratio to primary wave A.
HOURLY CHART
Click chart to enlarge.
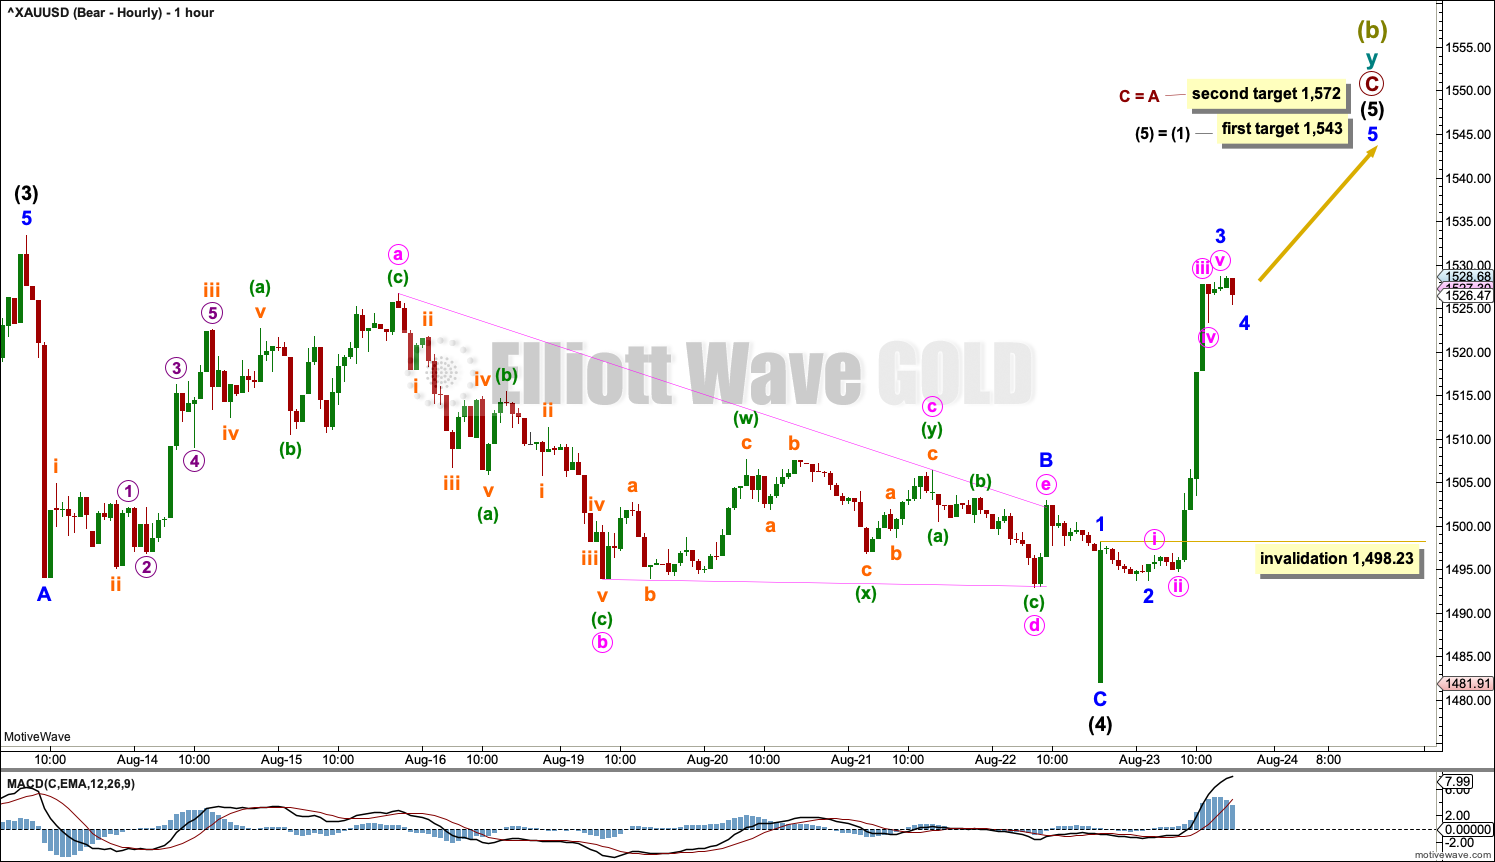
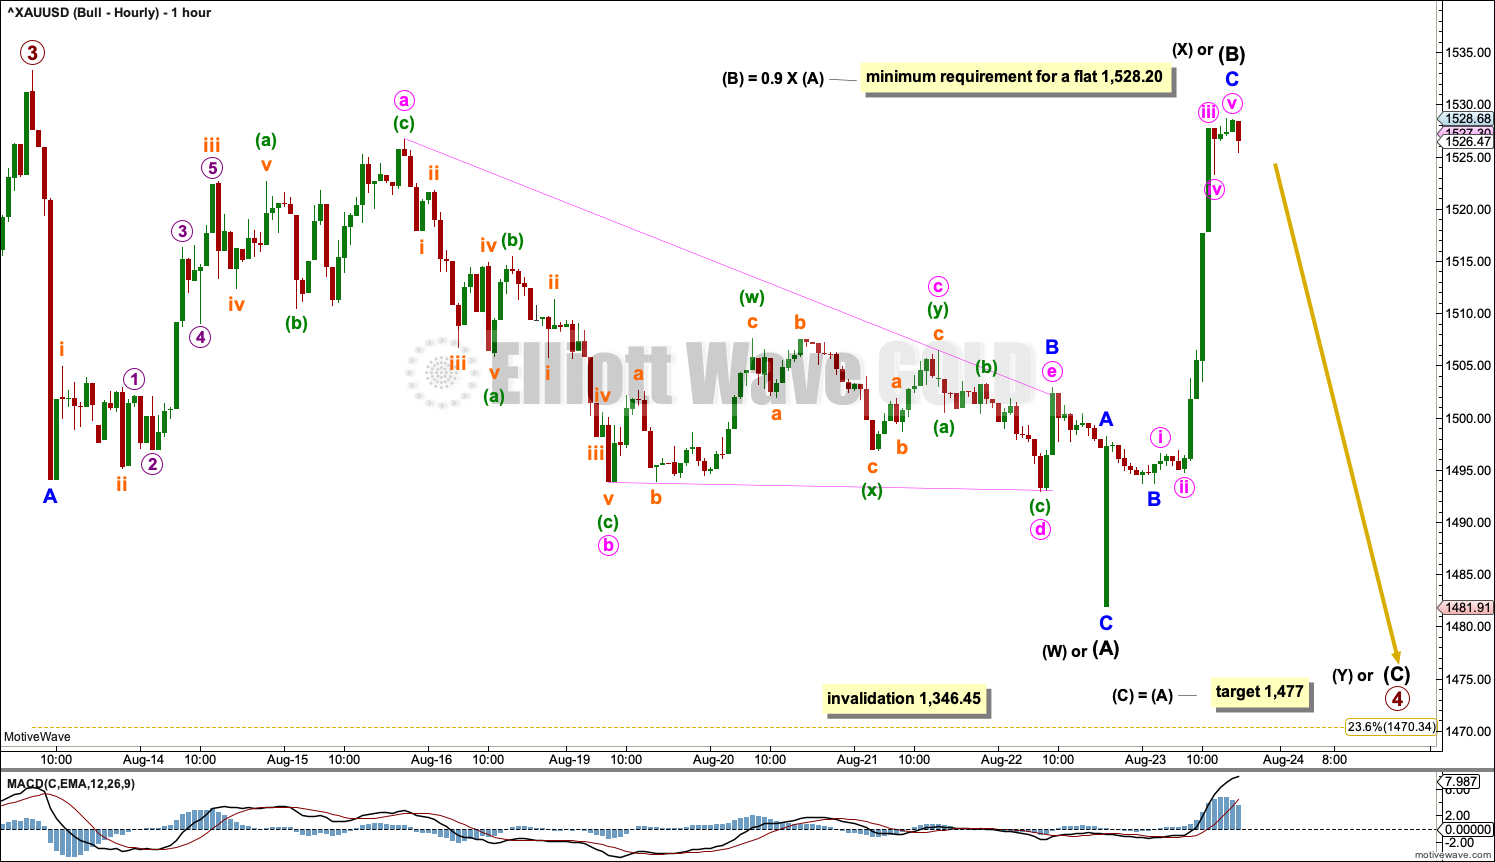
Intermediate wave (4) may now be a complete zigzag. The degree of labelling within it is moved up one degree. This gives good proportion to intermediate wave (2) at the daily chart level and fits with classic analysis.
Intermediate wave (5) must subdivide as a five wave motive structure, either an impulse or an ending diagonal. An impulse is much more common.
Within intermediate wave (5), minor waves 1 through to 3 may be complete. Minor wave 4 may not move into minor wave 1 price territory below 1,498.23.
ALTERNATE DAILY CHART
Today the alternate bearish wave count is discarded based upon a low probability.
BULLISH ELLIOTT WAVE COUNT
WEEKLY CHART
Click chart to enlarge.
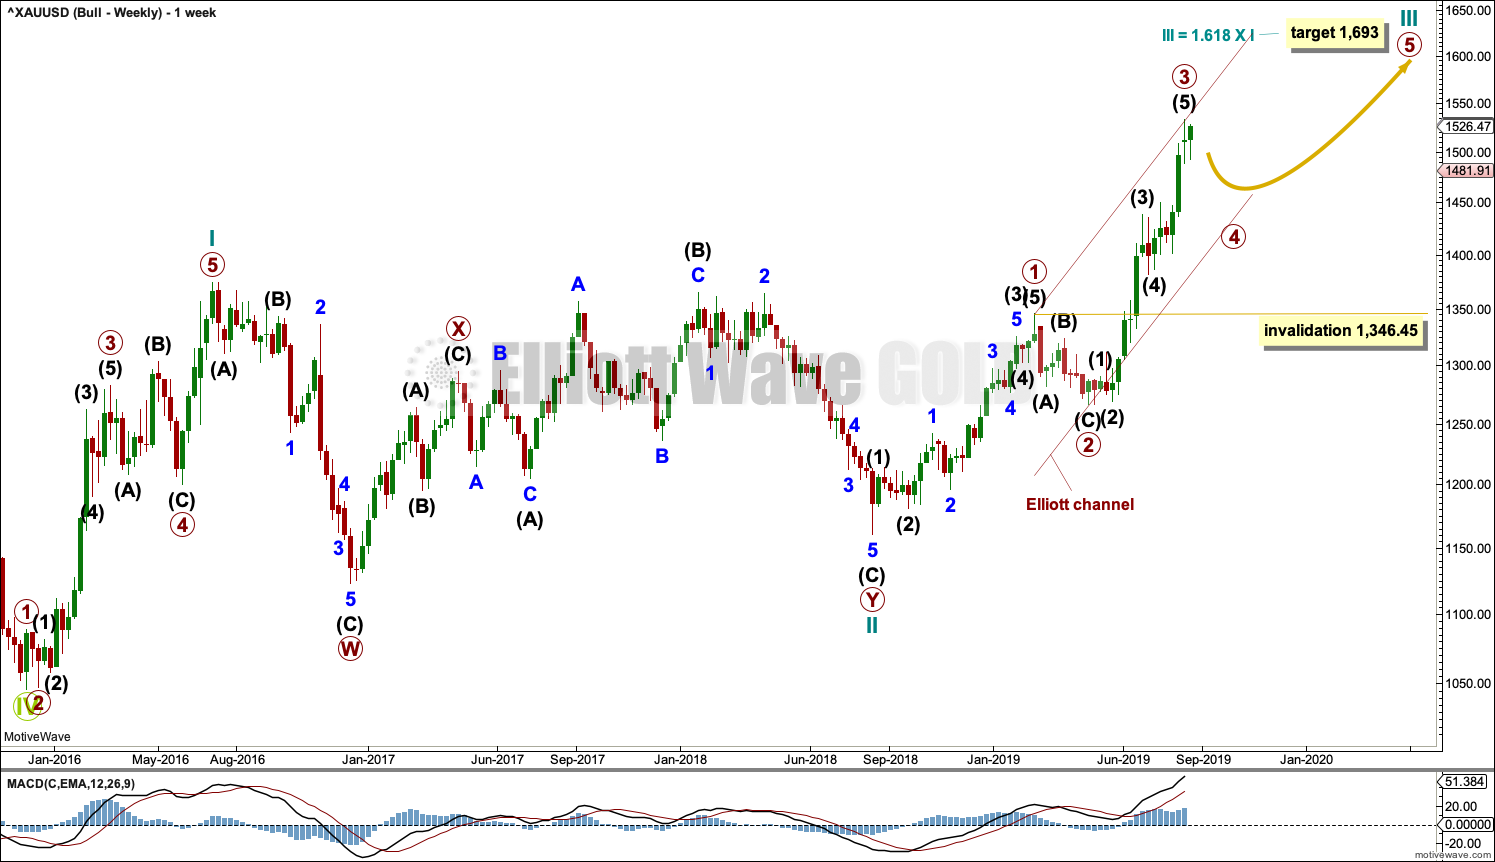
This wave count sees the the bear market complete at the last major low for Gold in November 2015.
If Gold is in a new bull market, then it should begin with a five wave structure upwards on the weekly chart. However, the biggest problem with this wave count is the structure labelled cycle wave I because this wave count must see it as a five wave structure, but it looks more like a three wave structure.
Commodities often exhibit swift strong fifth waves that force the fourth wave corrections coming just prior and just after to be more brief and shallow than their counterpart second waves. It is unusual for a commodity to exhibit a quick second wave and a more time consuming fourth wave, and this is how cycle wave I is labelled. This wave count still suffers from this very substantial problem, and for this reason the bearish wave count is still considered because it has a better fit in terms of Elliott wave structure.
Cycle wave II subdivides well as a double combination: zigzag – X – expanded flat.
Cycle wave III may have begun. Within cycle wave III, primary waves 1 and 2 may now be complete. Primary wave 3 has now moved above the end of primary wave 1 meeting a core Elliott wave rule. It has now moved far enough to allow room for primary wave 4 to unfold and remain above primary wave 1 price territory. Primary wave 4 may not move into primary wave 1 price territory below 1,346.45.
Cycle wave III so far for this wave count would have been underway now for 53 weeks. It is beginning to exhibit some support from volume and increasing ATR. This wave count now has some support from classic technical analysis.
The channel drawn about cycle wave III is an Elliott channel. Primary wave 4 may find support about the lower edge if it is time consuming enough.
DAILY CHART
Click chart to enlarge.
Primary wave 3 may now be a complete impulse. The structure of intermediate wave (5) is now complete.
Primary wave 4 may not move into primary wave 1 price territory below 1,346.45.
Primary wave 4 may last about four to ten weeks. It may unfold as any one of more than 23 possible Elliott wave corrective structures. Primary wave 4 may end within the price territory of the fourth wave of one lesser degree; intermediate wave (4) has its range from 1,438.43 to 1,382.10. It is also possible that it may be more shallow than this.
Within the price territory of intermediate wave (4), from 1,438.43 to 1,382.10, lies the 0.382 Fibonacci Ratio of primary wave 3 at 1,431.45. This is still a possible target for primary wave 4.
Primary wave 4 would most likely continue further in order for it to have some reasonable proportion to primary wave 2.
HOURLY CHART
Click chart to enlarge.
It is possible that primary wave 4 may be more brief and shallow than originally expected.
Primary wave 4 may be unfolding sideways as a flat, combination or triangle.
If primary wave 4 unfolds as a flat correction, then within it intermediate wave (B) must subdivide as a corrective structure and at its terminus must retrace a minimum 0.9 length of intermediate wave A. This minimum has been met. Intermediate wave (B) may now be complete.
If intermediate wave (B) is not complete, then it may continue higher to make a new high above the start of intermediate wave (A) at 1,533.34 as in an expanded flat.
If primary wave 4 unfolds as a triangle, then within it intermediate wave (B) must subdivide as a corrective structure and may now be complete. There is no minimum length required for intermediate wave (B) within a triangle. Intermediate wave (B) may also continue higher to make a new high above the start of intermediate wave (A) at 1,533.34 as in a running triangle.
If primary wave 4 unfolds as a combination, then the first structure may be complete as a zigzag which would be labelled intermediate wave (W). The double may then be joined by a three in the opposite direction to be labelled intermediate wave (X), which would most likely subdivide as a zigzag and may now be complete. Intermediate wave (X) may continue higher to make a new high above the start of intermediate wave (W) at 1,533.34.
TECHNICAL ANALYSIS
WEEKLY CHART
Click chart to enlarge. Chart courtesy of StockCharts.com.
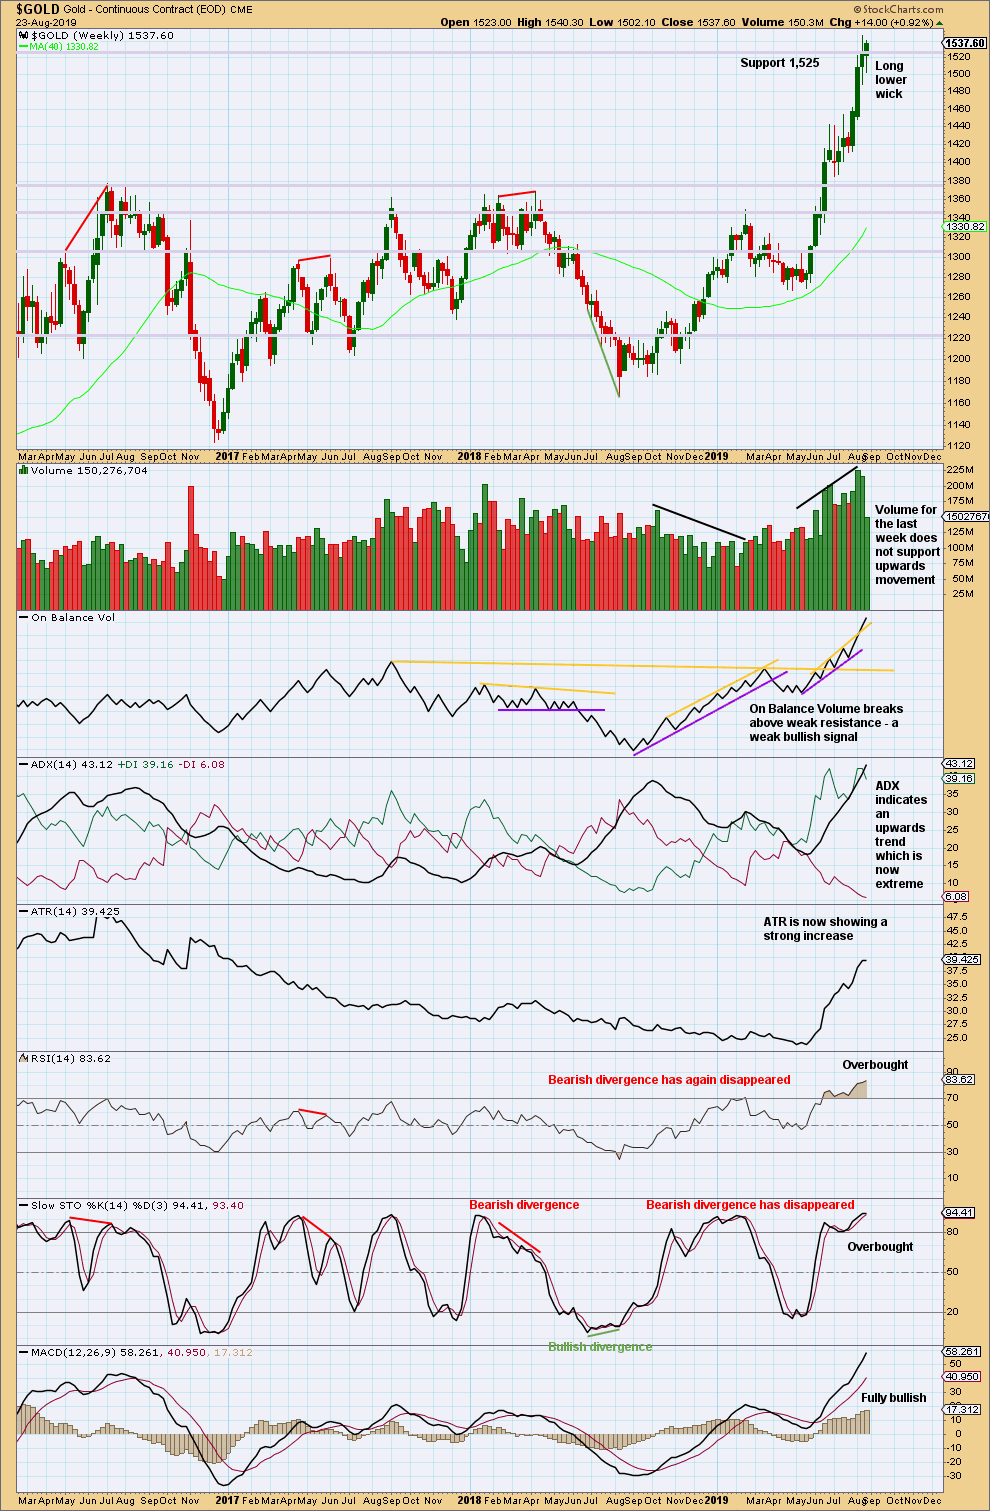
When trends for Gold reach extreme, they can continue still for a few weeks and price can continue for a considerable distance.
When both ADX and RSI reach extreme together, then that is sometimes where a trend ends.
RSI at overbought on the weekly chart is a warning to be cautious; the trend is overbought, but at this stage there is no evidence of a trend change.
The signal last week from On Balance Volume is weak because the resistance line breached has a strong slope and is not long held.
Although volume for the last week does not support upwards movement, this week it may be better to judge short-term volume at the daily chart level because much of the week was taken up by consolidation.
DAILY CHART
Click chart to enlarge. Chart courtesy of StockCharts.com.
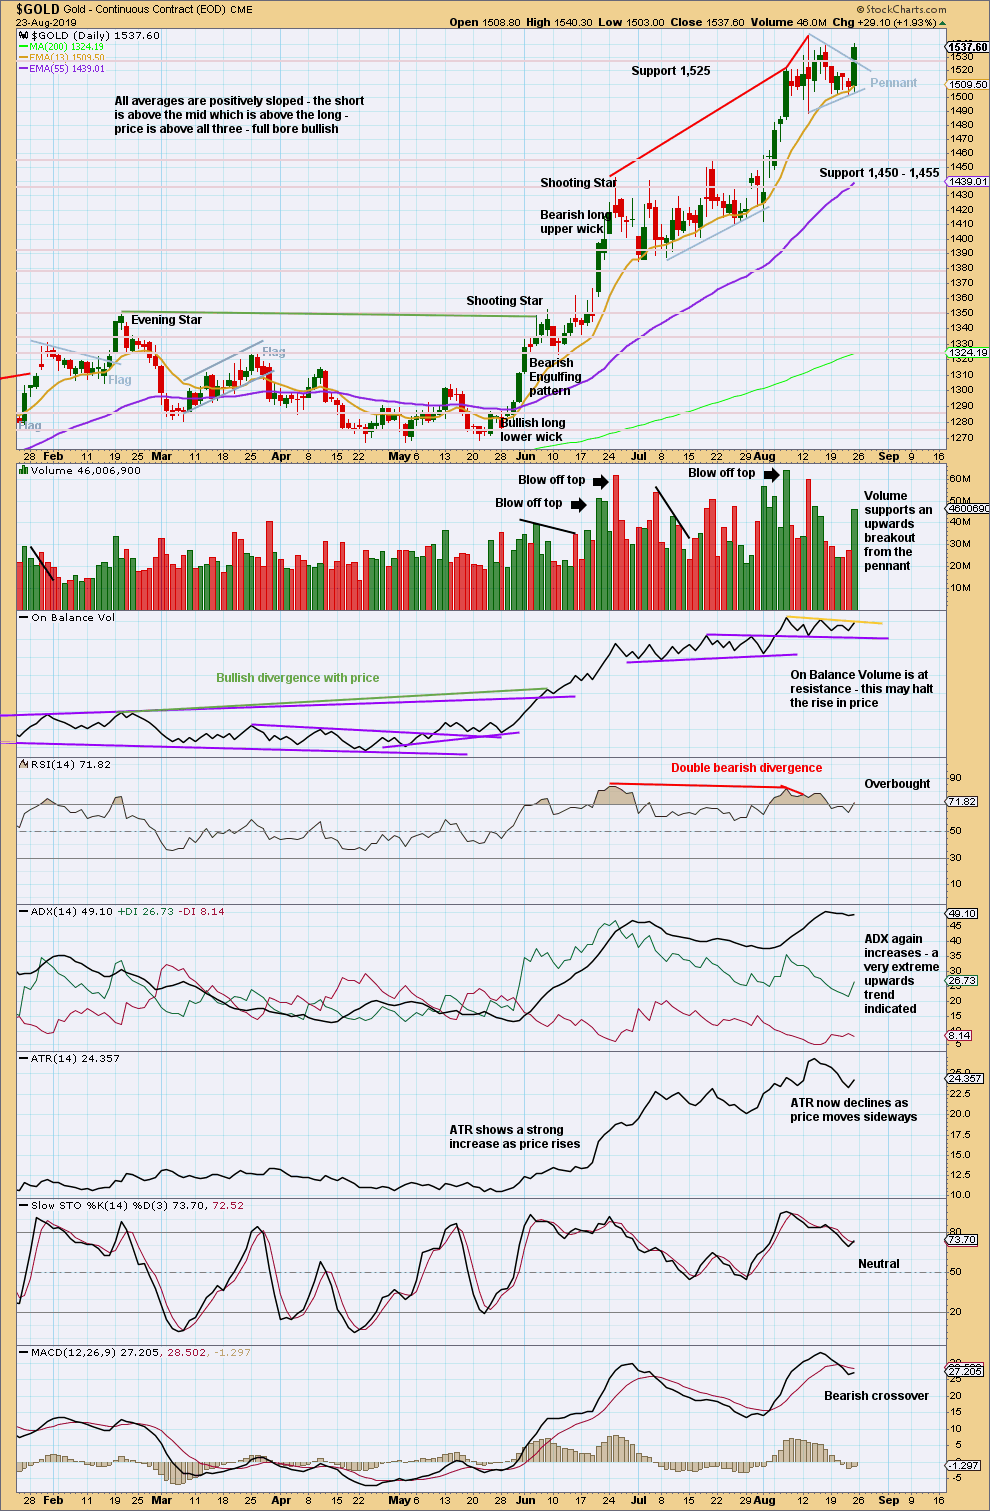
Friday has closed above the upper edge of the pennant pattern on an upwards day that has strong support from volume. This looks like a classic upwards breakout. The target from the flag pole of the pennant is 1,660.
The trend is very extreme, but there is still no evidence of a trend change. Extreme trends may continue for a reasonable distance and time before they end. But because conditions are very extreme it is absolutely essential that good risk management practices are followed. This trend may now end at any time.
GDX WEEKLY CHART
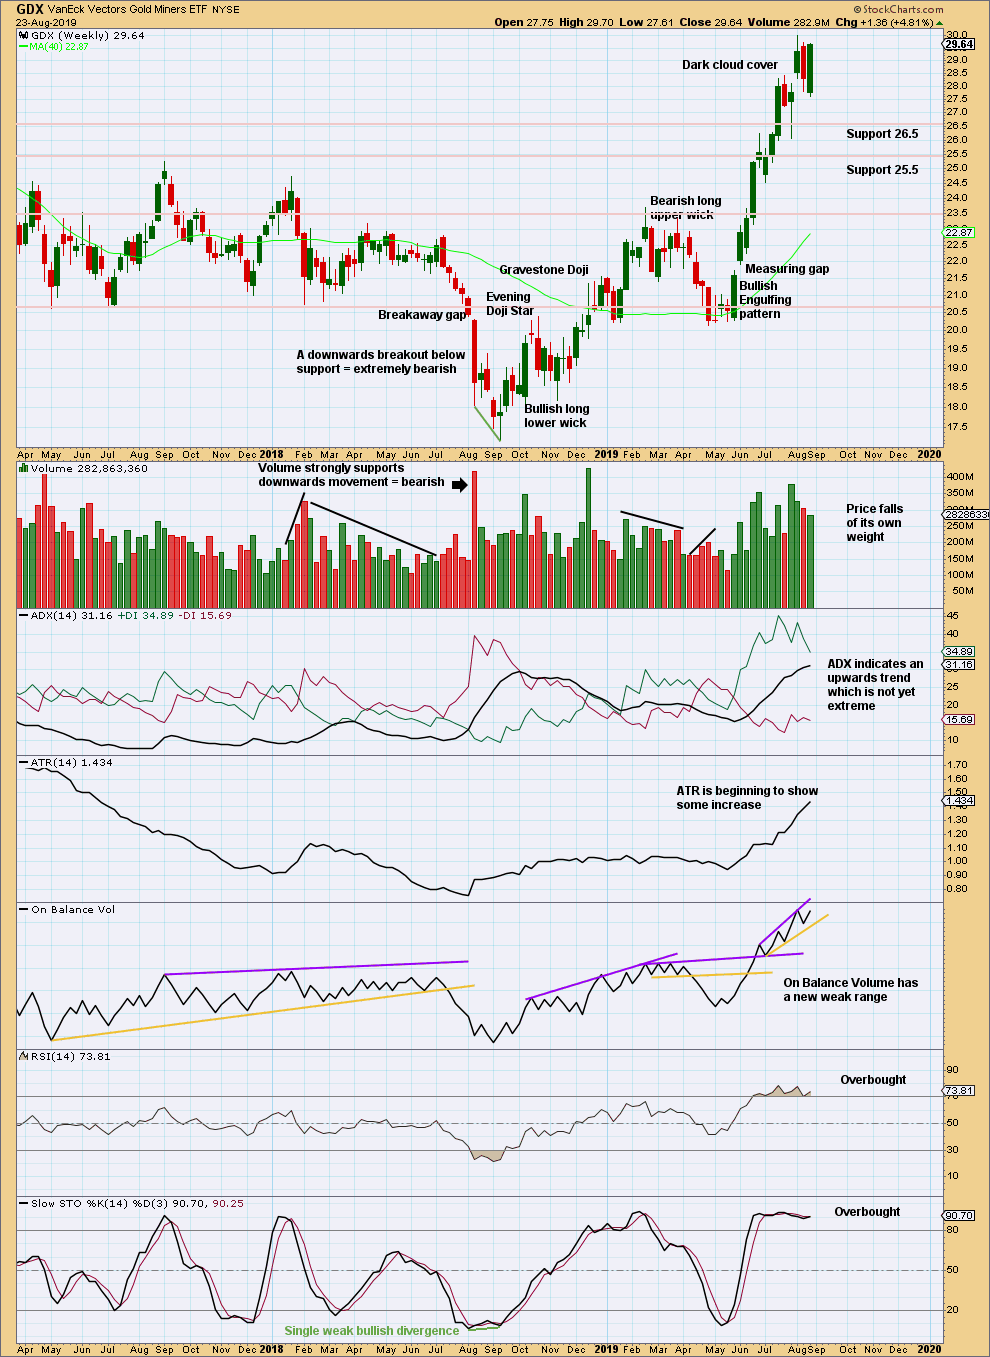
Click chart to enlarge. Chart courtesy of StockCharts.com.
The Bearish Engulfing pattern has been followed by what is technically a downwards week with a slightly lower low and lower high, but this last week has finished very strongly. It looks like the bearish implications of the engulfing pattern may be resolved. There is no evidence on this chart that there has been a trend change. An upwards trend remains intact.
GDX DAILY CHART
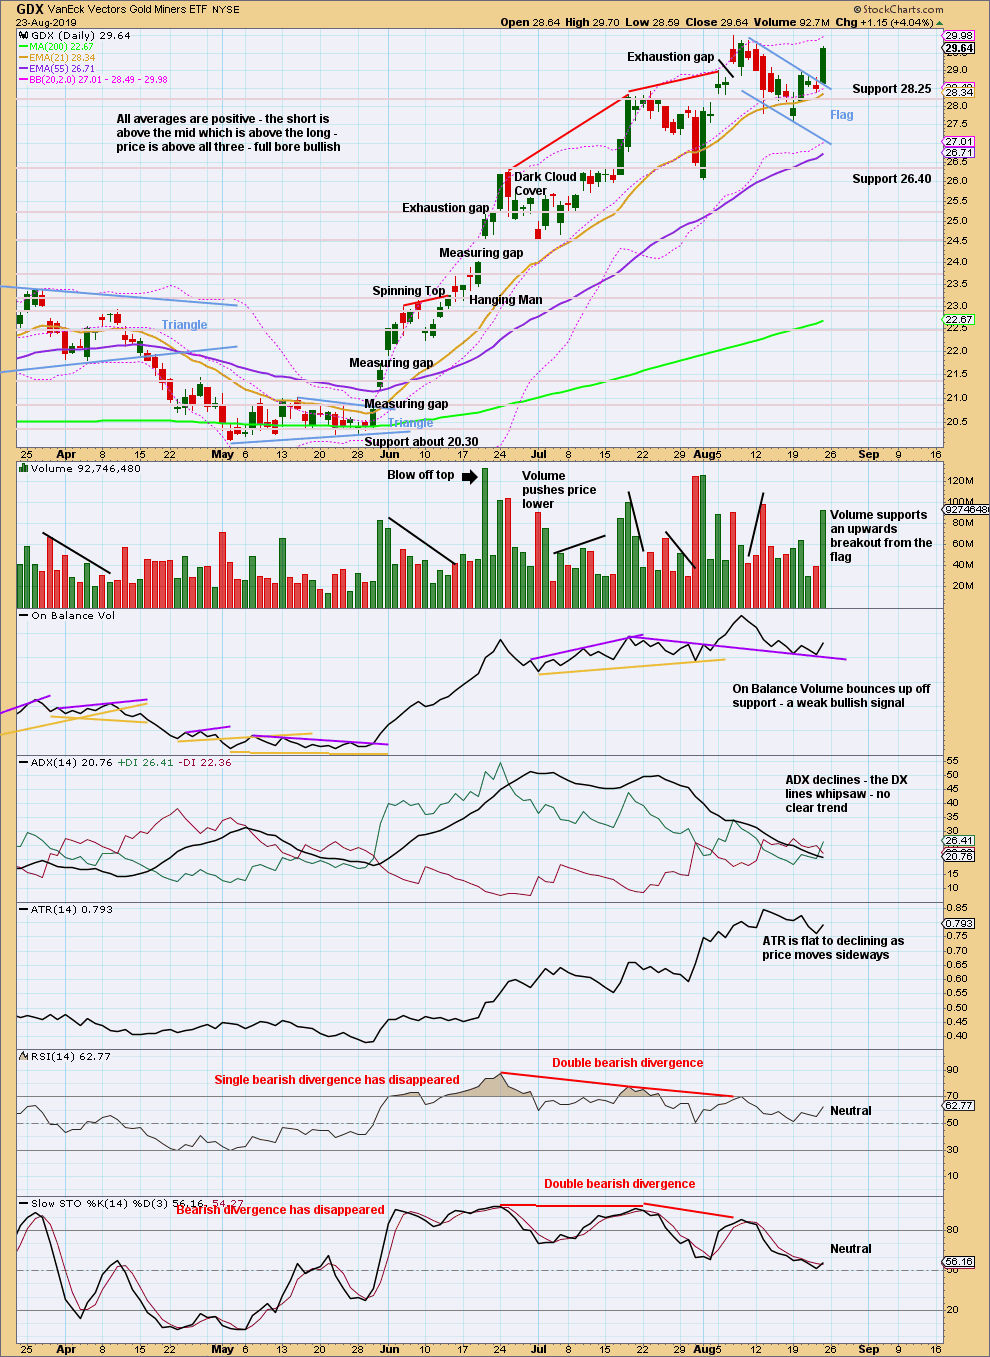
Click chart to enlarge. Chart courtesy of StockCharts.com.
The target using the flag pole is at 32.76.
Published @ 12:38 a.m. EST on August 24, 2019.
—
Careful risk management protects your trading account(s).
Follow my two Golden Rules:
1. Always trade with stops.
2. Risk only 1-5% of equity on any one trade.
—
New updates to this analysis are in bold.
Bearish hourly chart updated:
Bullish hourly chart updated:
The common range for B waves within flats is from 1 to 1.38 times the length of their A waves.
Primary 4 could still be an expanded flat, the most common type of flat. Intermediate (B) is still within the most common range.
B waves of course can be longer than that. That range is just the most common, not a maximum at all.
It would seem the high for gold yesterday was between the two bearish targets.
It was, but Silver broke it’s bearish barrier
There is a new wave count for Silver that looks better, remains valid and is still overall bearish. It is however rather different than the bearish count for Gold. But they don’t always turn together and aren’t always correlated.
And I believe gold could still be in a 4th wave consolidation pattern…I’m sure there are many possibilities until confidence points are cleared.
Personally, I’m looking for a move back under 1500 one more time before either the bearish case really unfolds *or* gold moves back up to test highs again.