
Price continues sideways. Targets remain the same.
Summary: Sideways movement now looks like a small interruption within an ongoing upwards trend that is very extreme and overbought.
If price makes a new high above 1,552.65, then the next target would be at 1,572
A classic analysis target using the pennant pattern is at 1,660. This target may still be optimistic.
The bullish wave count now expects downwards movement for a week or two to 1,469.
It remains possible that a Super Cycle degree trend change occurred at the last high and a new downwards trend to last years may now begin.
Grand SuperCycle analysis is here.
Monthly charts were last published here with video here.
BEARISH ELLIOTT WAVE COUNT
WEEKLY CHART
Click chart to enlarge.
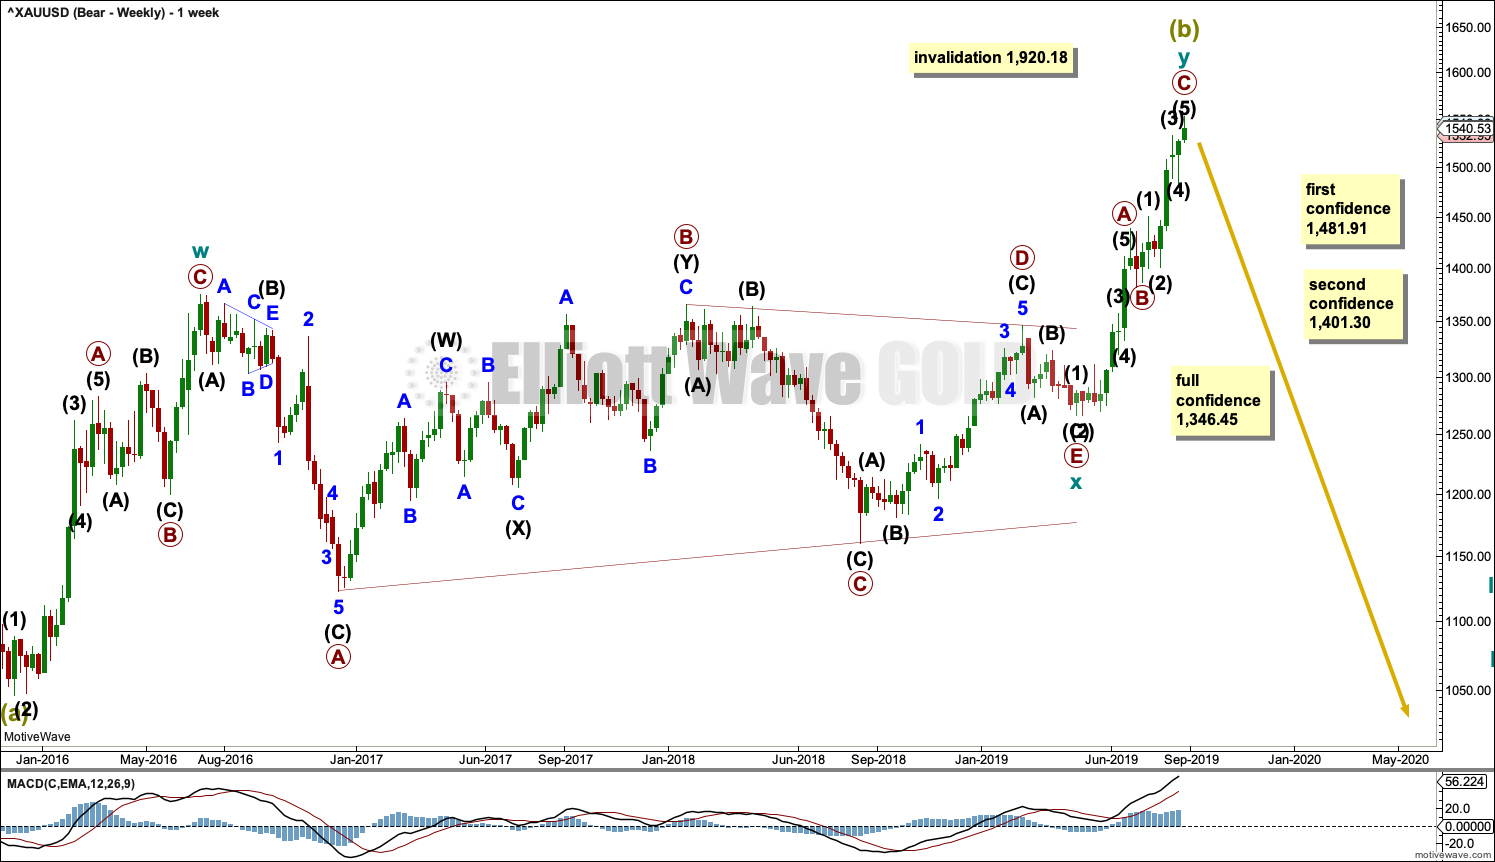
It is possible that Super Cycle wave (b) is completing as a double zigzag.
The first zigzag in the double is labelled cycle wave w. The double is joined by a three in the opposite direction, a triangle labelled cycle wave x. The second zigzag in the double is labelled cycle wave y.
Cycle wave y may now be a complete zigzag, or it may yet continue a little higher.
The purpose of the second zigzag in a double is to deepen the correction. Cycle wave y has achieved this purpose.
1,481.91 is the start of intermediate wave (5) within primary wave C. A new low below 1,481.91 could not be a second wave correction within intermediate wave (5), so at that stage intermediate wave (5) would have to be over.
1,401.30 is the start of primary wave C. A new low below this point could not be a second wave correction within primary wave C, so at that stage primary wave C would be confirmed as over.
A new low below 1,346.45 would invalidate the bullish wave count below and add confidence to a bearish wave count.
DAILY CHART
Click chart to enlarge.
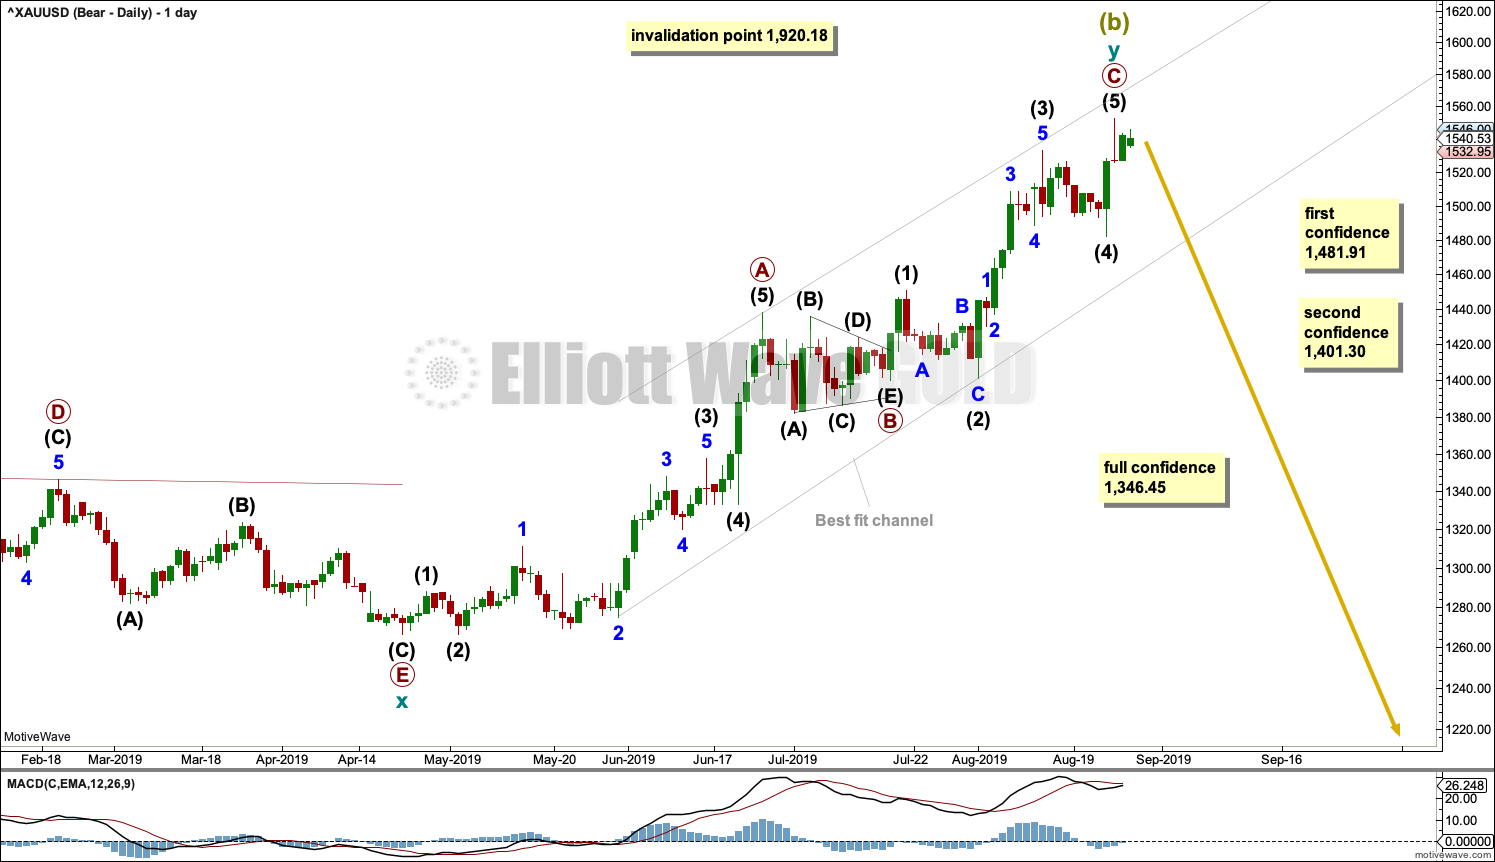
Within cycle wave y, the triangle that ended on the 17th of July may have been primary wave B. Primary wave C may have begun there. Primary wave C must subdivide as a five wave structure; it could be a complete impulse.
Within cycle wave y, there is no Fibonacci Ratio between primary waves A and C.
Within primary wave C, intermediate wave (3) is just 0.33 longer than 2.618 the length of intermediate wave (1). If intermediate wave (5) is over at the last high, then it exhibits no Fibonacci ratio to either of intermediate waves (1) or (3).
A breach of the best fit trend channel by downwards movement would be a very strong indication of a major trend change.
There are two hourly charts below. The first follows labelling from this main wave count. The alternate moves the degree of labelling within intermediate wave (5) down one degree and considers the possibility that it was not over at the last high. At this stage, today they are judged to be of about even probability. A breakout is required for confidence in either.
MAIN HOURLY CHART
Click chart to enlarge.
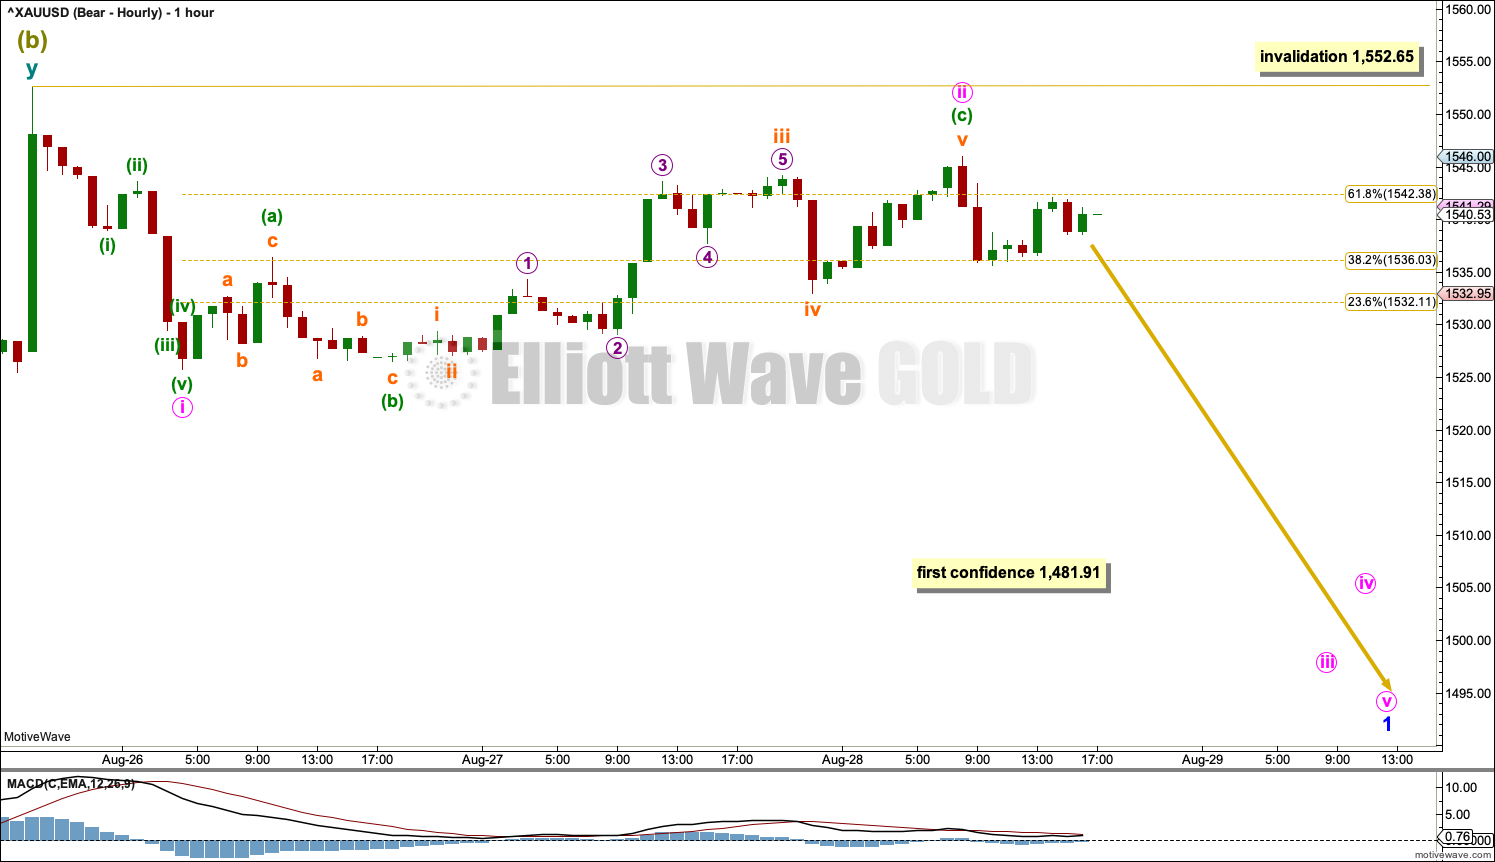
Intermediate wave (5) may now be a complete five wave impulse.
If there has been a trend change at Super Cycle degree, then a five down should develop at all of hourly, daily and weekly time frames. It would be labelled minor wave 1 at the hourly chart time frame.
Within minor wave 1, minute wave ii may not move beyond the start of minute wave i above 1,552.65.
It is possible that minute wave ii may now be a completed regular flat correction, ending very close to the 0.618 Fibonacci Ratio.
ALTERNATE HOURLY CHART
Click chart to enlarge.
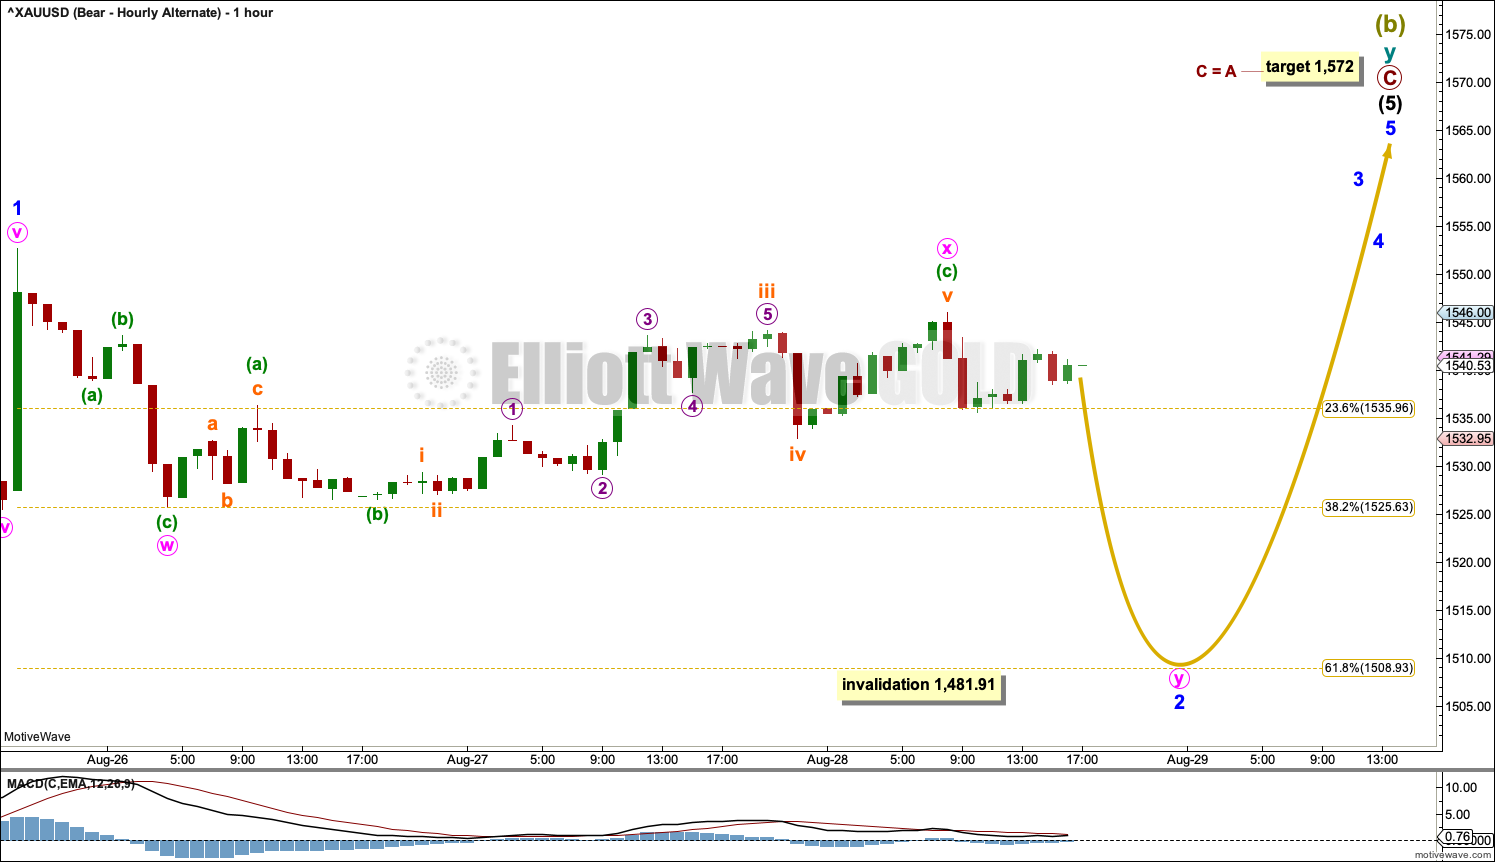
This hourly chart is identical to the main hourly chart with the exception of the degree of labelling within intermediate wave (5). This alternate wave count moves the degree of labelling down one degree. Only minor wave 1 within intermediate wave (5) may be over at the last high.
Minor wave 2 may not move beyond the start of minor wave 1 below 1,481.91. Minor wave 2 may be an incomplete double zigzag or double combination. Minute wave y may now subdivide as a zigzag, flat or triangle. Minute wave ii may move lower to end closer to the 0.618 Fibonacci ratio of minor wave 1.
Minute wave ii may not move beyond the start of minute wave i below 1,481.91.
The target for Super Cycle wave (b) to end remains the same.
BULLISH ELLIOTT WAVE COUNT
WEEKLY CHART
Click chart to enlarge.
This wave count sees the the bear market complete at the last major low for Gold in November 2015.
If Gold is in a new bull market, then it should begin with a five wave structure upwards on the weekly chart. However, the biggest problem with this wave count is the structure labelled cycle wave I because this wave count must see it as a five wave structure, but it looks more like a three wave structure.
Commodities often exhibit swift strong fifth waves that force the fourth wave corrections coming just prior and just after to be more brief and shallow than their counterpart second waves. It is unusual for a commodity to exhibit a quick second wave and a more time consuming fourth wave, and this is how cycle wave I is labelled. This wave count still suffers from this very substantial problem, and for this reason the bearish wave count is still considered because it has a better fit in terms of Elliott wave structure.
Cycle wave II subdivides well as a double combination: zigzag – X – expanded flat.
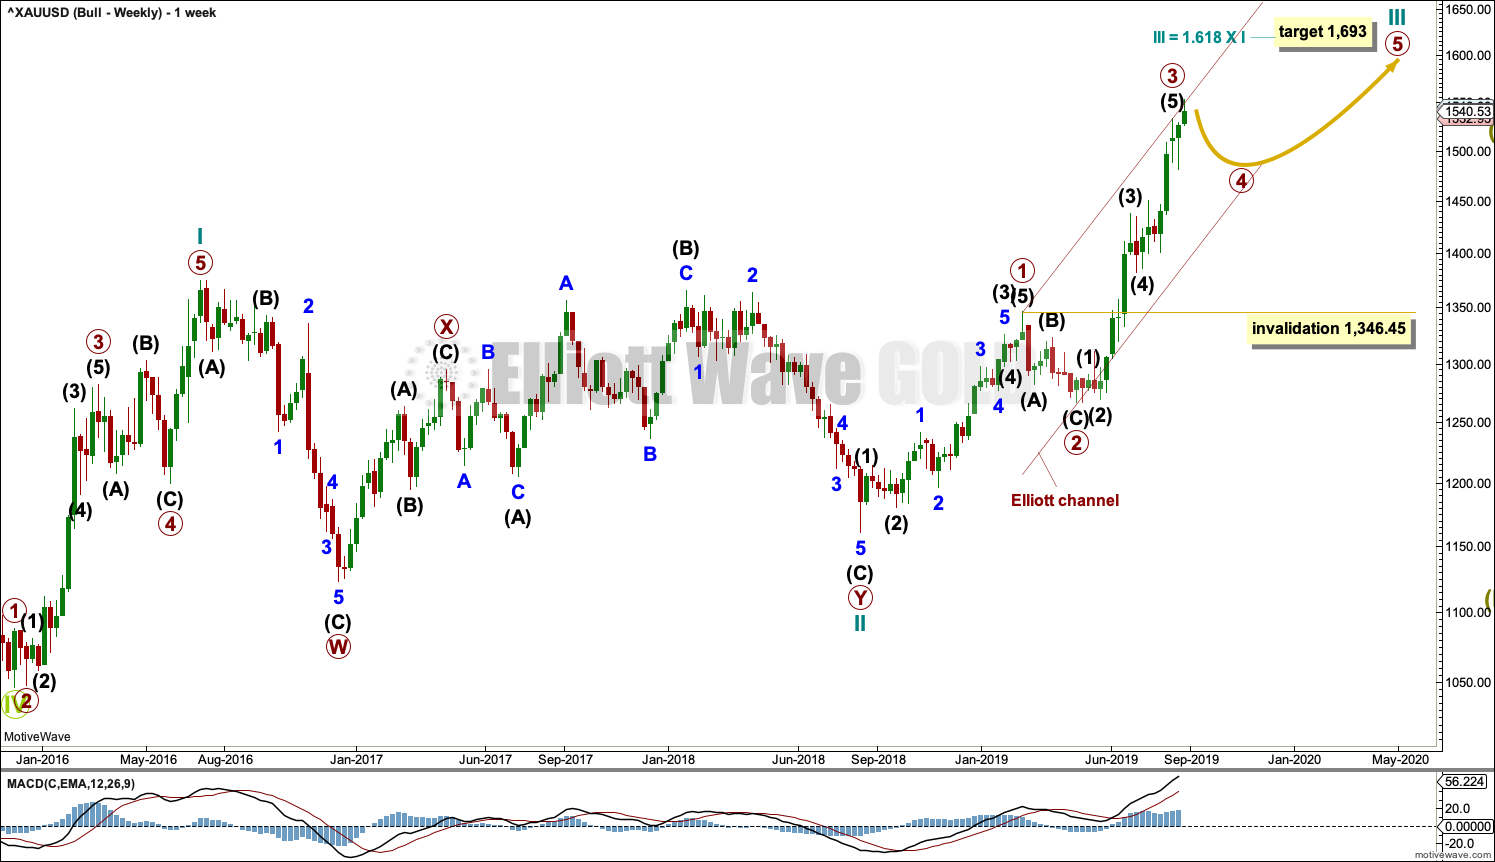
Cycle wave III may have begun. Within cycle wave III, primary waves 1 and 2 may now be complete. Primary wave 3 has now moved above the end of primary wave 1 meeting a core Elliott wave rule. It has now moved far enough to allow room for primary wave 4 to unfold and remain above primary wave 1 price territory. Primary wave 4 may not move into primary wave 1 price territory below 1,346.45.
Cycle wave III so far for this wave count would have been underway now for 54 weeks. It is beginning to exhibit some support from volume and increasing ATR. This wave count now has some support from classic technical analysis.
The channel drawn about cycle wave III is an Elliott channel. Primary wave 4 may find support about the lower edge if it is time consuming enough.
DAILY CHART
Click chart to enlarge.
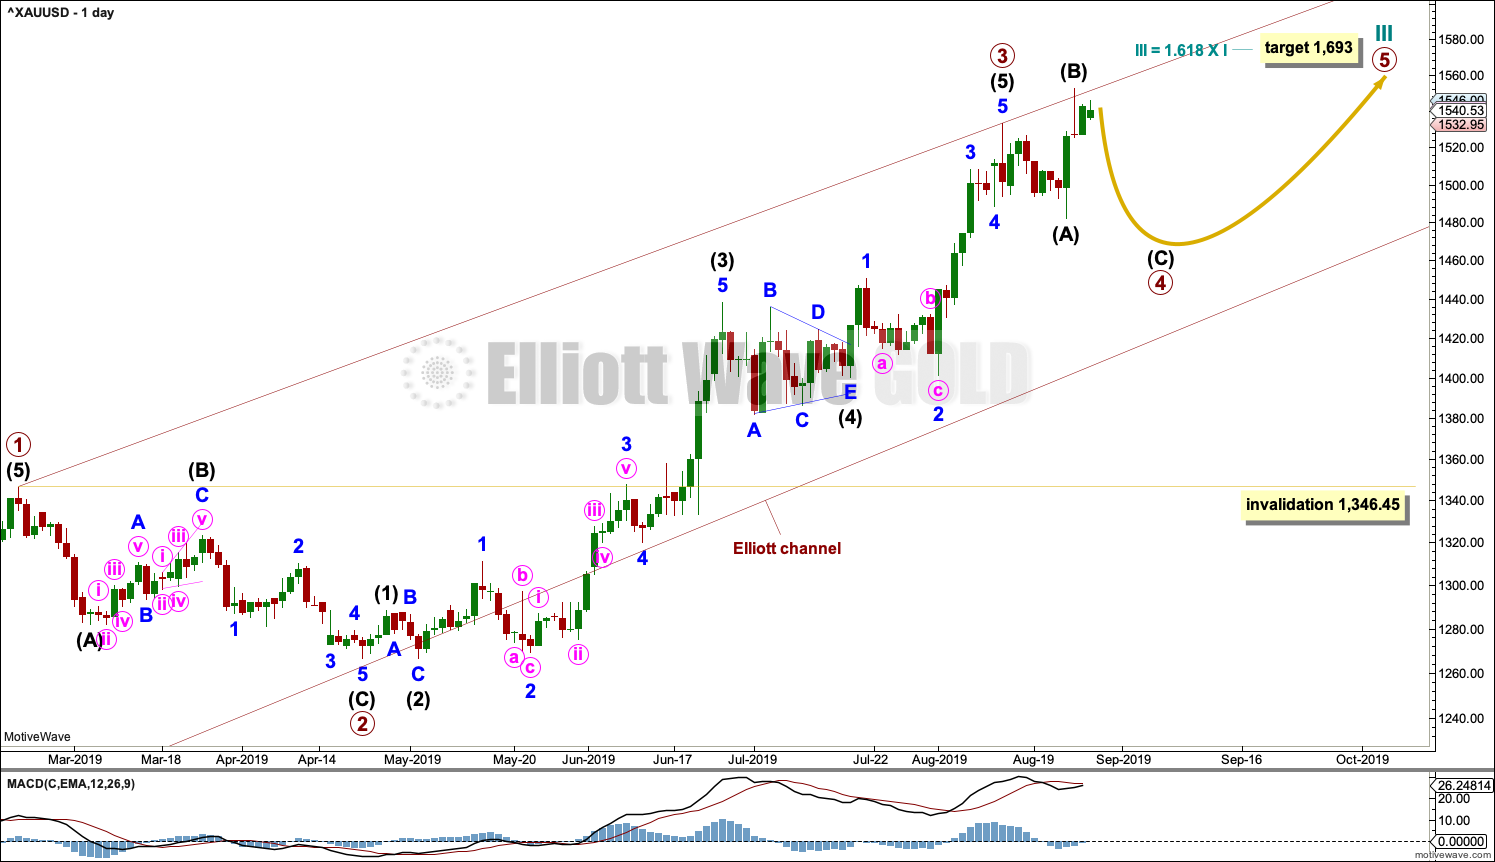
Primary wave 4 may be continuing as an expanded flat, which is a common corrective structure. This would see alternation in structure with the zigzag of primary wave 2.
Primary wave 2 lasted 43 sessions. Primary wave 4 may be expected to be more brief; Gold usually exhibits more brief fourth waves than their counterpart second waves. Primary wave 4 may end in a total Fibonacci 21 or 34 sessions. So far it has lasted 11 sessions.
Primary wave 4 may not move into primary wave 1 price territory below 1,346.45.
HOURLY CHART
Click chart to enlarge.
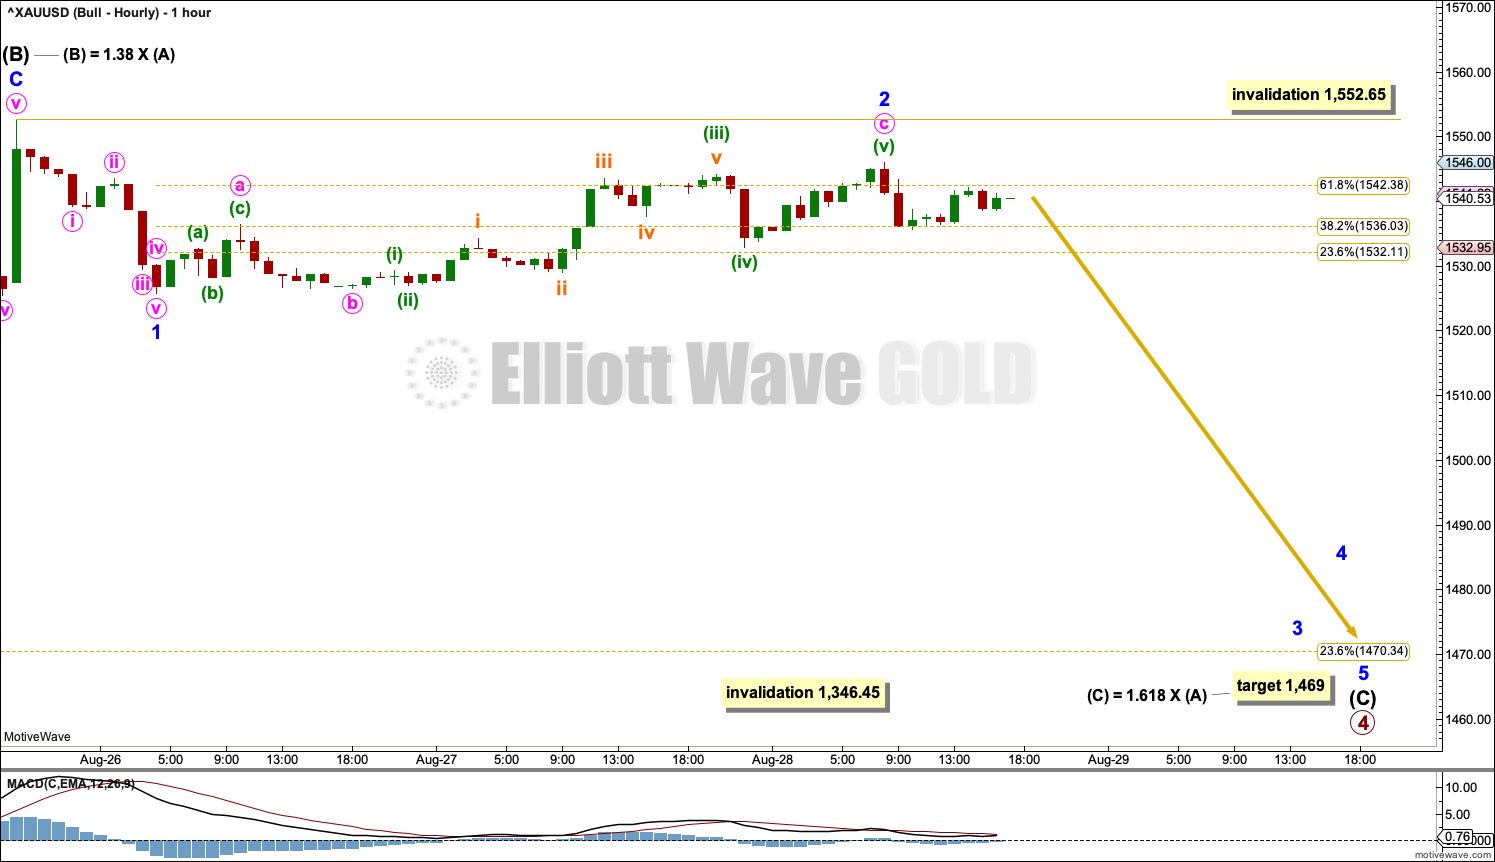
Within expanded flat corrections, wave B is commonly from 1 to 1.38 times the length of wave A. For this example, intermediate wave (B) is within the most common length.
A target is calculated for intermediate wave (C) to end based upon the most common Fibonacci Ratio to intermediate wave (A) within an expanded flat. This target is just $1 lower than the 0.236 Fibonacci Ratio of primary wave 3 at 1,470.
Intermediate wave (C) must subdivide as a five wave structure. Within intermediate wave (C), minor wave 2 may not move beyond the start of minor wave 1 above 1,552.65.
If this wave count is invalidated in the short term with a new high above 1,552.65, then it would be possible that intermediate wave (B) could be continuing higher as a double zigzag. There is no Elliott wave rule stating a limit for B waves within flats, but there is a convention which sees the idea of a flat discarded when the B wave reaches twice the length if its A wave. For this example, that price point would be at 1,584.77.
TECHNICAL ANALYSIS
WEEKLY CHART
Click chart to enlarge. Chart courtesy of StockCharts.com.
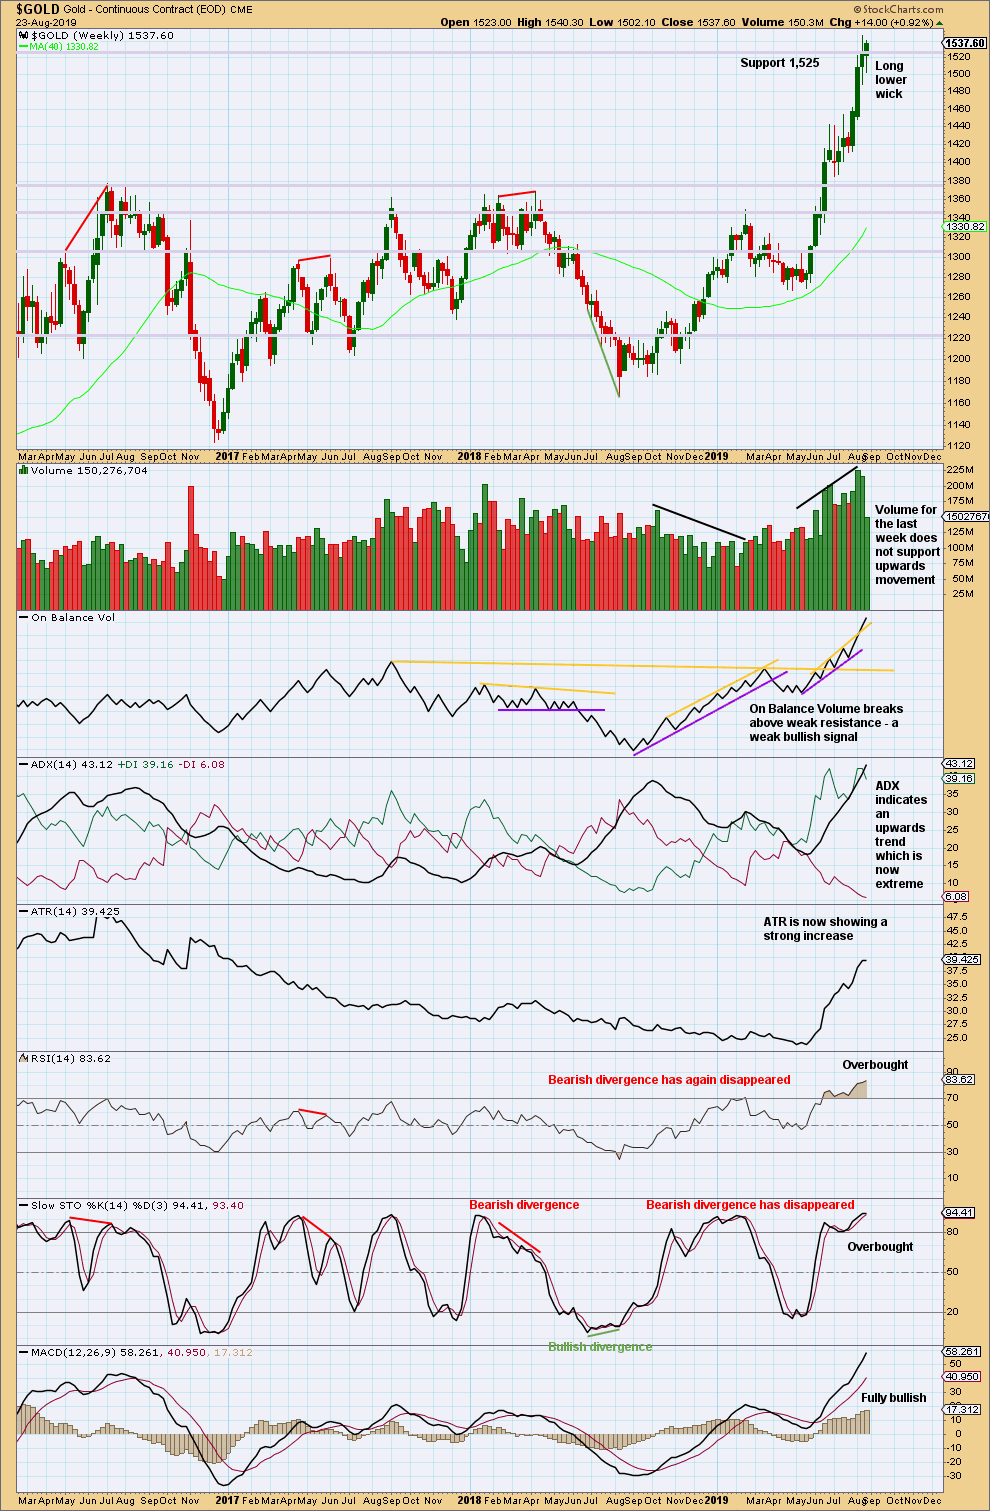
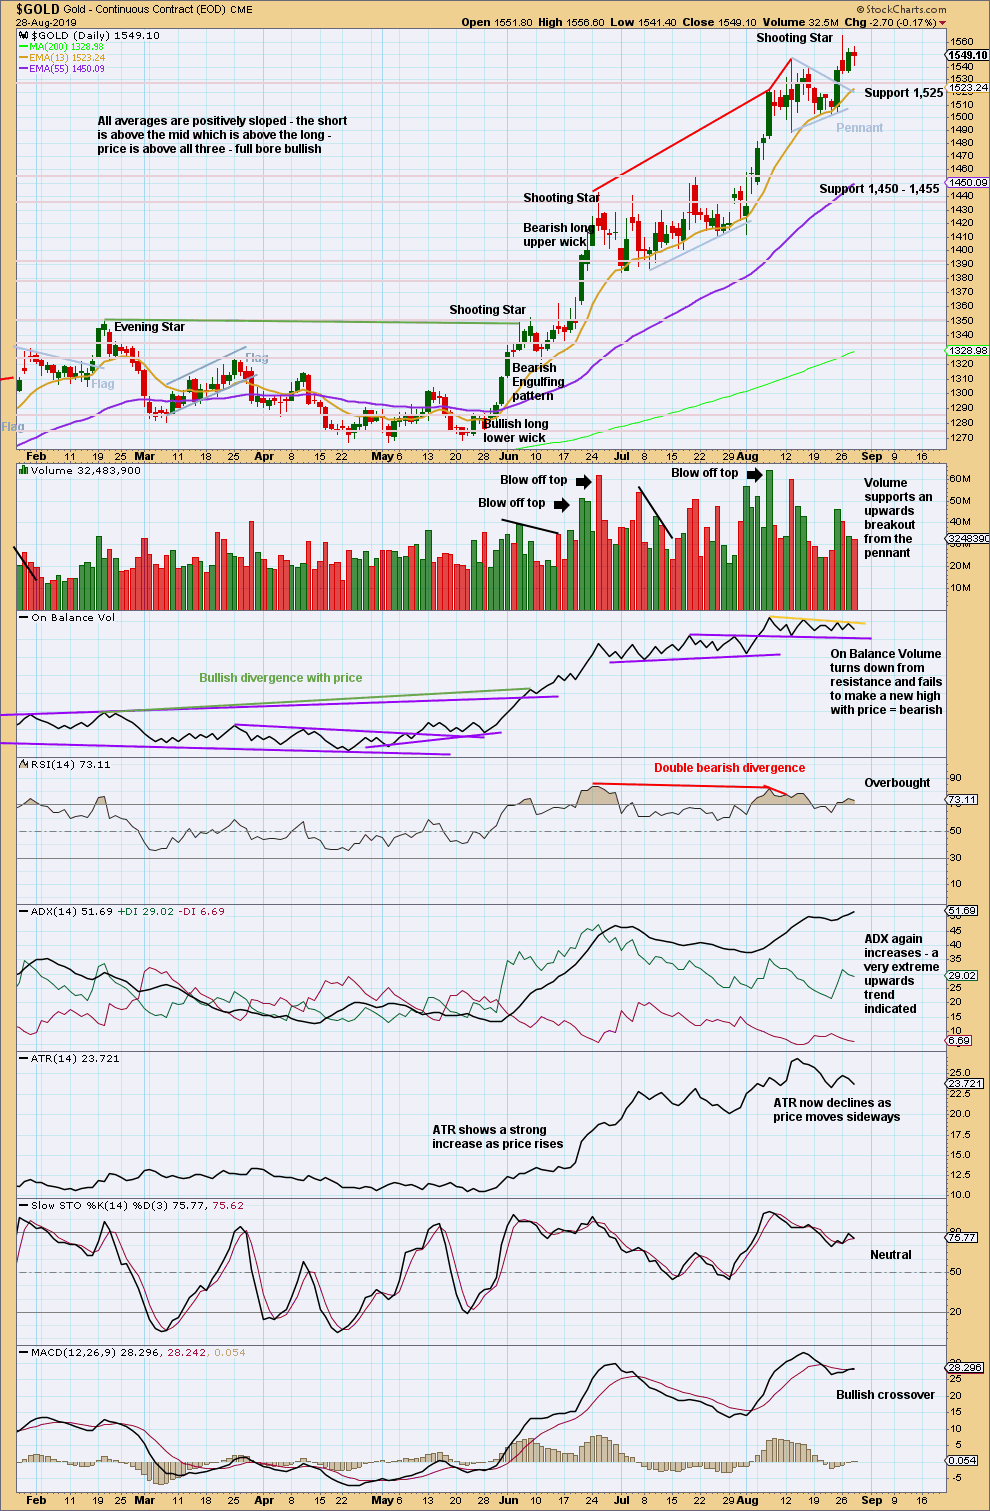
When trends for Gold reach extreme, they can continue still for a few weeks and price can continue for a considerable distance.
When both ADX and RSI reach extreme together, then that is sometimes where a trend ends.
RSI at overbought on the weekly chart is a warning to be cautious; the trend is overbought, but at this stage there is no evidence of a trend change.
Although volume does not support upwards movement, it may be better to judge short-term volume at the daily chart level because much of the last week was taken up by consolidation.
DAILY CHART
Click chart to enlarge. Chart courtesy of StockCharts.com.
A strong Shooting Star pattern with a decline in volume for the session is bearish at least for the short to mid term
When trends are very extreme and conditions are overbought, a candlestick reversal pattern should be taken seriously.
Look out for at least a consolidation or pullback to last a few sessions, if not an end to this upwards trend.
At this stage, sideways movement over the last two sessions on declining volume looks like a small consolidation within an ongoing upwards trend rather than a major trend change.
GDX WEEKLY CHART
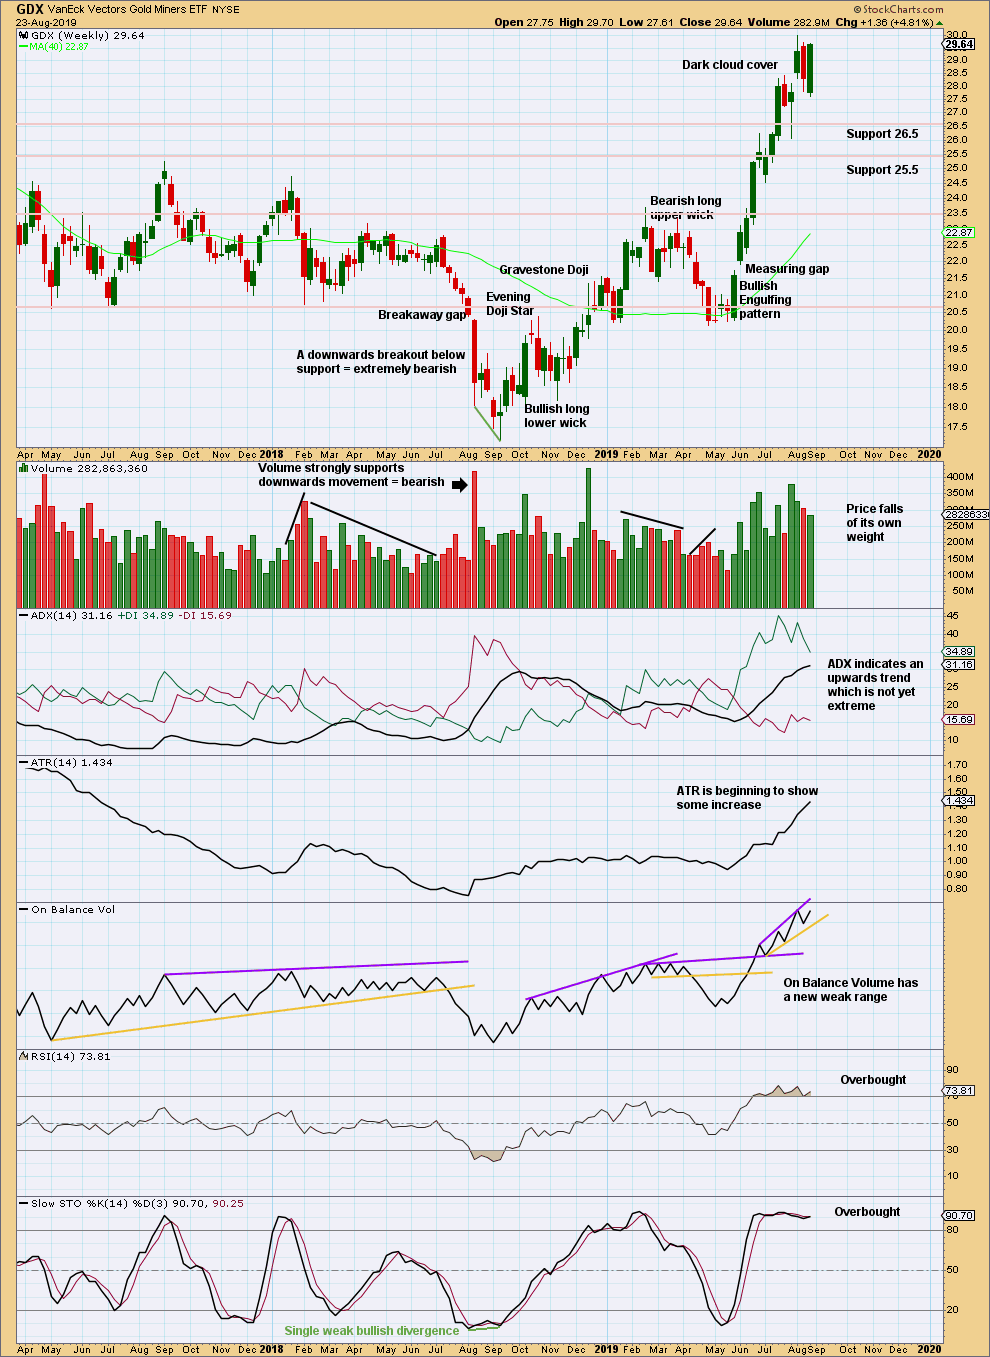
Click chart to enlarge. Chart courtesy of StockCharts.com.
The Bearish Engulfing pattern has been followed by what is technically a downwards week with a slightly lower low and lower high, but this last week has finished very strongly. It looks like the bearish implications of the engulfing pattern may be resolved. There is no evidence on this chart that there has been a trend change. An upwards trend remains intact.
GDX DAILY CHART
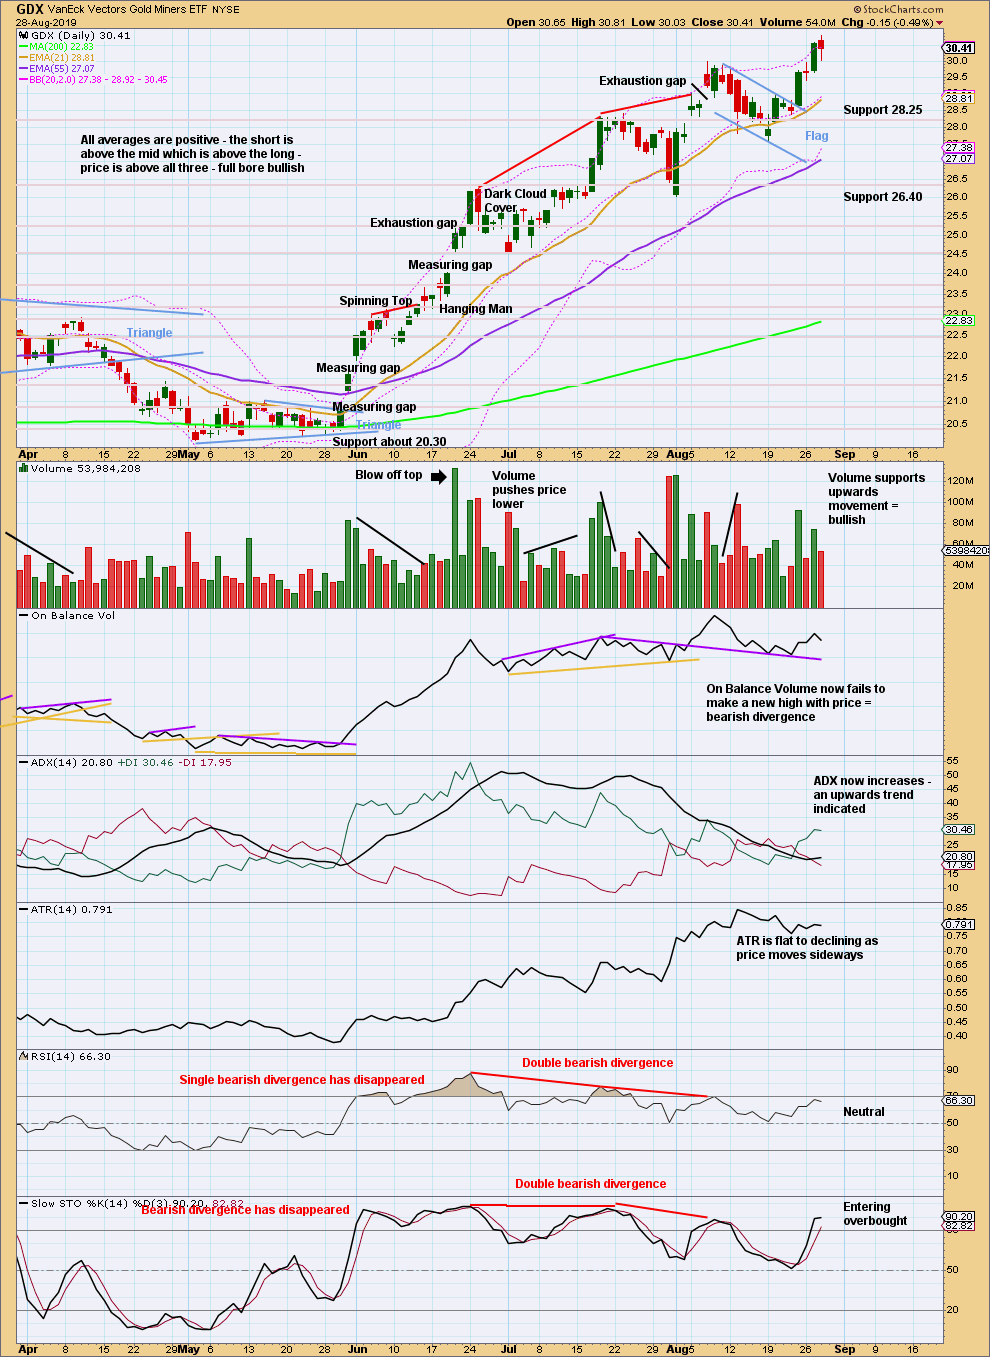
Click chart to enlarge. Chart courtesy of StockCharts.com.
The target using the flag pole is at 32.76.
GDX is now bullish. Expect further upwards movement to the target.
Published @ 06:45 p.m. EST.
—
Careful risk management protects your trading account(s).
Follow my two Golden Rules:
1. Always trade with stops.
2. Risk only 1-5% of equity on any one trade.
—
New updates to this analysis are in bold.
Hourly bear main count updated:
Just sharing this Gold chart from EWI’s free charts this week. They seem to be favoring the bearish outlook. I noted on the chart where EWI doesn’t appear to be following strict rules.
I’ve found one example on a daily chart in Bitcoin where in hindsight the only reasonable way to label a movement was a leading diagonal, where the third wave within it was the longest. But that period in time for Bitcoin didn’t have huge volume, so it’s a little suspicious.
I am coming to think that actually that rule needs to be changed. And this example on Gold is another very good one. That labelling does have the best look, but the rule regarding wave lengths of diagonals isn’t strictly met.
I would like to see how they’ve resolved A within the zigzag of B (circle) as a five though. That’s really important, and they’ve got no labels there.
Lara, EWI has some free posts this week and this one for the SPX caught my eye. In all the years that I have been an EWG member, I don’t think I’ve ever seen you label an EW pattern as an expanding triangle or maybe I have just not noticed any that you have labeled as such.
What are your thoughts about this specific chart and for expanding triangles in general? Seems like there should be some of them, even if they are rare..? Thanks,
In my research (full count on all data now for S&P500, US Oil and Bitcoin) I have found exactly zero examples of expanding triangles.
In my experience (up to 5 markets a day now for 11 years) I think I might have seen one once, on the hourly chart on the UDS index.
They are exceptionally rare.
There are ways to label the current structure for the S&P which avoids the expanding triangle and has a much much higher probability. I don’t know why they’re sticking with such a count.
I’m not saying it’s wrong, I’m just saying that in my knowledge and experience the probability is one of the lowest possible. Minuscule.
Thanks for the replies!