
An upwards breakout continues the upwards trend. Both Elliott wave counts expect the same direction for the short term next week.
Summary: If price makes a new high by any amount at any time frame above 17.680, then only the very bullish Elliott wave count would remain. The target would then be at 33.94.
If price makes a new low now below 15.149, then the bearish wave count would increase in probability.
For the short term, both wave counts now expect more upwards movement. The bearish wave count expects a trend change about 17.314.
Monthly charts were last updated here.
ELLIOTT WAVE COUNTS
BEARISH WAVE COUNT
WEEKLY CHART
Click chart to enlarge.
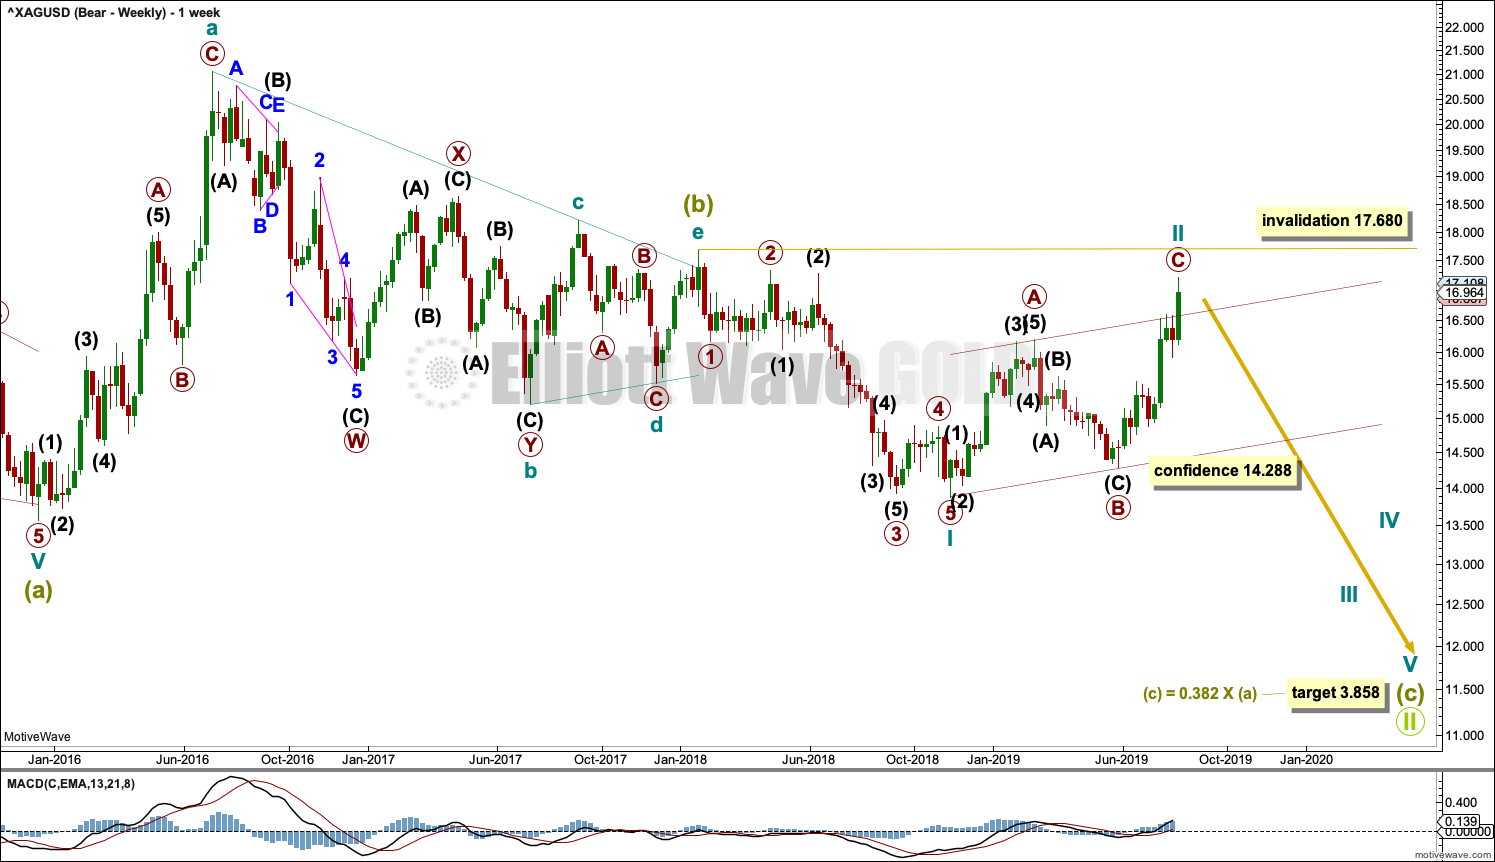
The basic Elliott wave structure is five steps forward followed by three steps back. At this time, it is expected that Silver is within a very large three steps back pattern that began at the all time high in April 2011.
Three steps back are almost always labelled in Elliott wave as A-B-C. This Elliott wave count labels waves A and B complete as Super Cycle wave (a) and a triangle for Super Cycle wave (b).
The Elliott wave structure for Grand Super Cycle wave II may be a zigzag. Zigzags subdivide 5-3-5. Within this zigzag, Super Cycle waves (a) and (b) may be complete. Super Cycle wave (c) must subdivide as a five wave Elliott wave structure, most likely an impulse.
Within the impulse of Super Cycle wave (c), if cycle wave II continues higher, it may not move beyond the start of cycle wave I above 17.680.
Within the zigzag of Grand Super Cycle wave II, it would be extremely likely for Super Cycle wave (c) to move below the end of cycle wave a at 13.569 to avoid a truncation. The target would see this achieved.
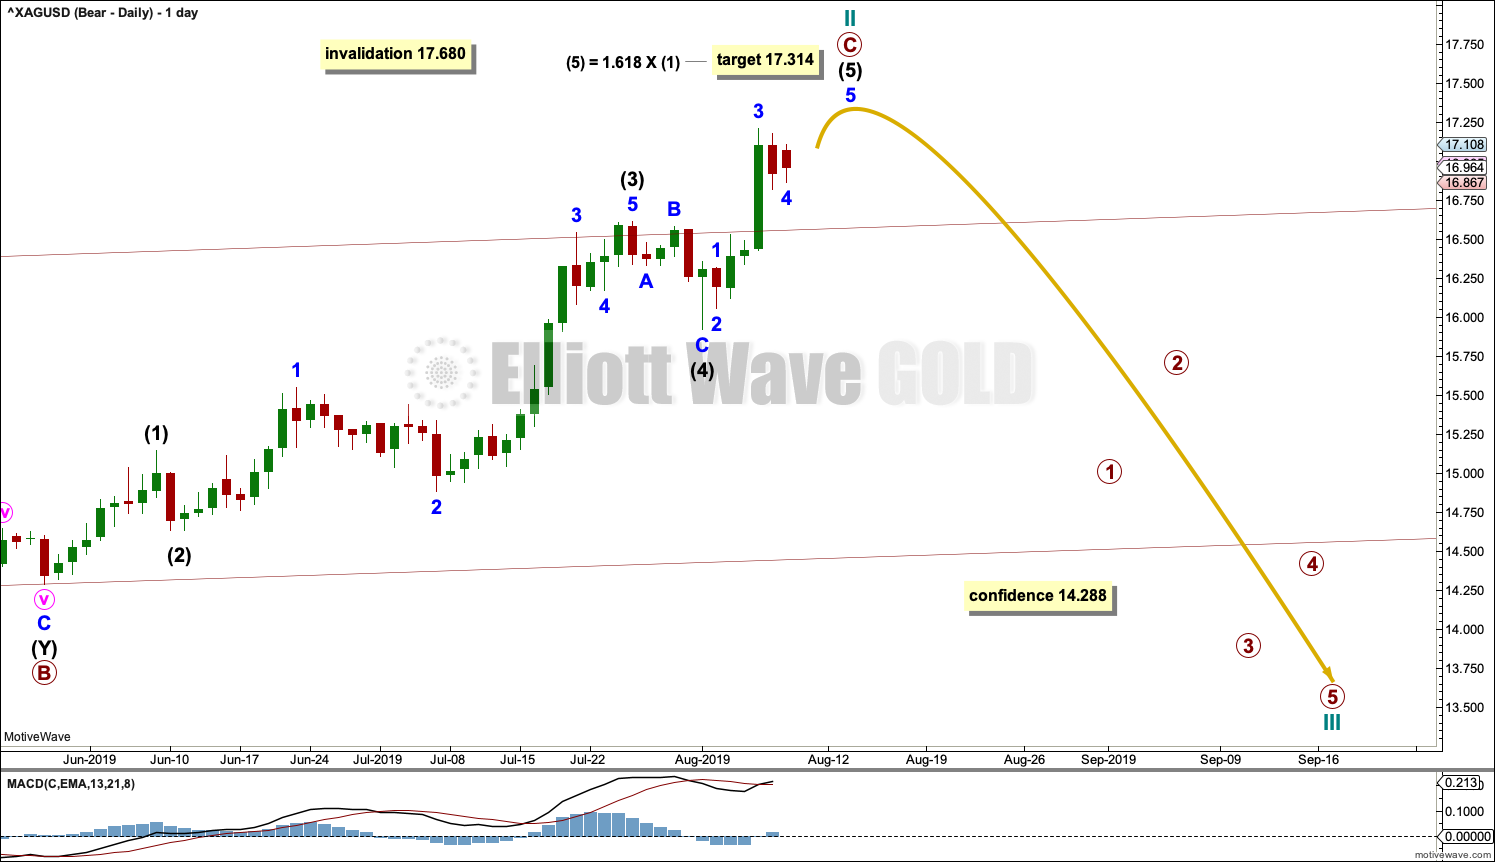
The daily chart below focusses on primary wave C within cycle wave II.
DAILY CHART
Click chart to enlarge.
Cycle wave II may be a zigzag. Primary wave C may be an incomplete impulse.
Within the impulse of primary wave C, intermediate waves (1) through to (4) may be complete. Intermediate wave (5) may be incomplete.
Within intermediate wave (5), minor waves 1 through to 3 may be complete. Minor wave 4 may be unfolding sideways as a small triangle, combination or flat correction. Only minor wave 5 may be now required to complete the structure at all degrees.
A target is calculated for intermediate wave (5) to end.
BULLISH WAVE COUNT
WEEKLY CHART
Click chart to enlarge.
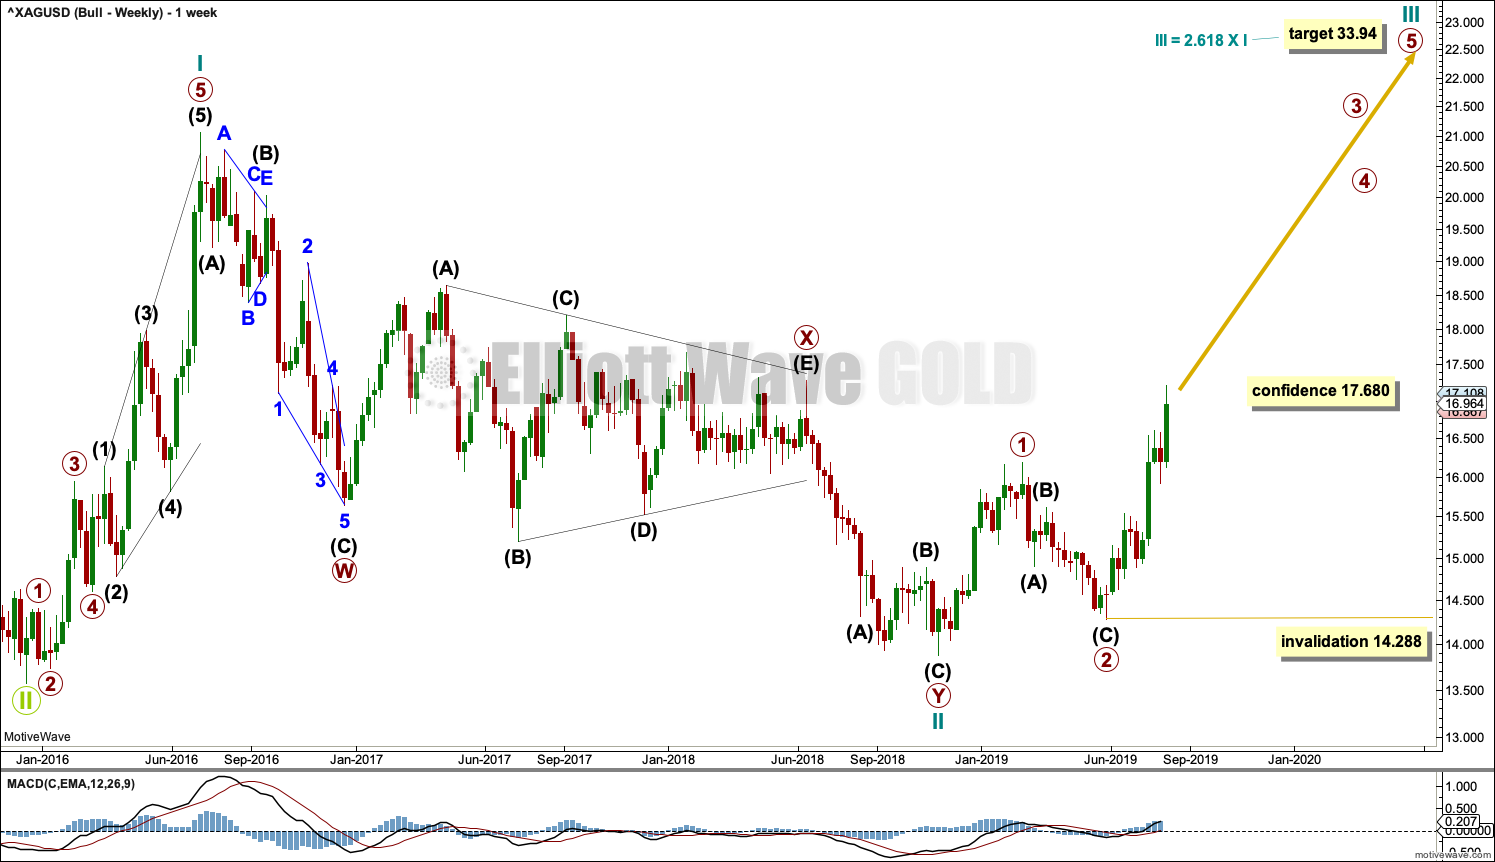
This bullish Elliott wave count sees the three steps back pattern as complete and a new bull market beginning for Silver at the low in December 2015.
A new bull market should begin with a five wave structure upwards. This is labelled cycle wave I.
Following five steps forward should be three steps back. This is labelled cycle wave II. The Elliott wave corrective structure of cycle wave II is labelled as a double zigzag, which is a fairly common structure.
Cycle wave III may only subdivide as an impulse. Within the impulse, primary waves 1 and 2 may now be complete.
Primary wave 3 may only subdivide as an impulse. Within the impulse, no second wave correction may move beyond its start below 14.288.
DAILY CHART
Click chart to enlarge.
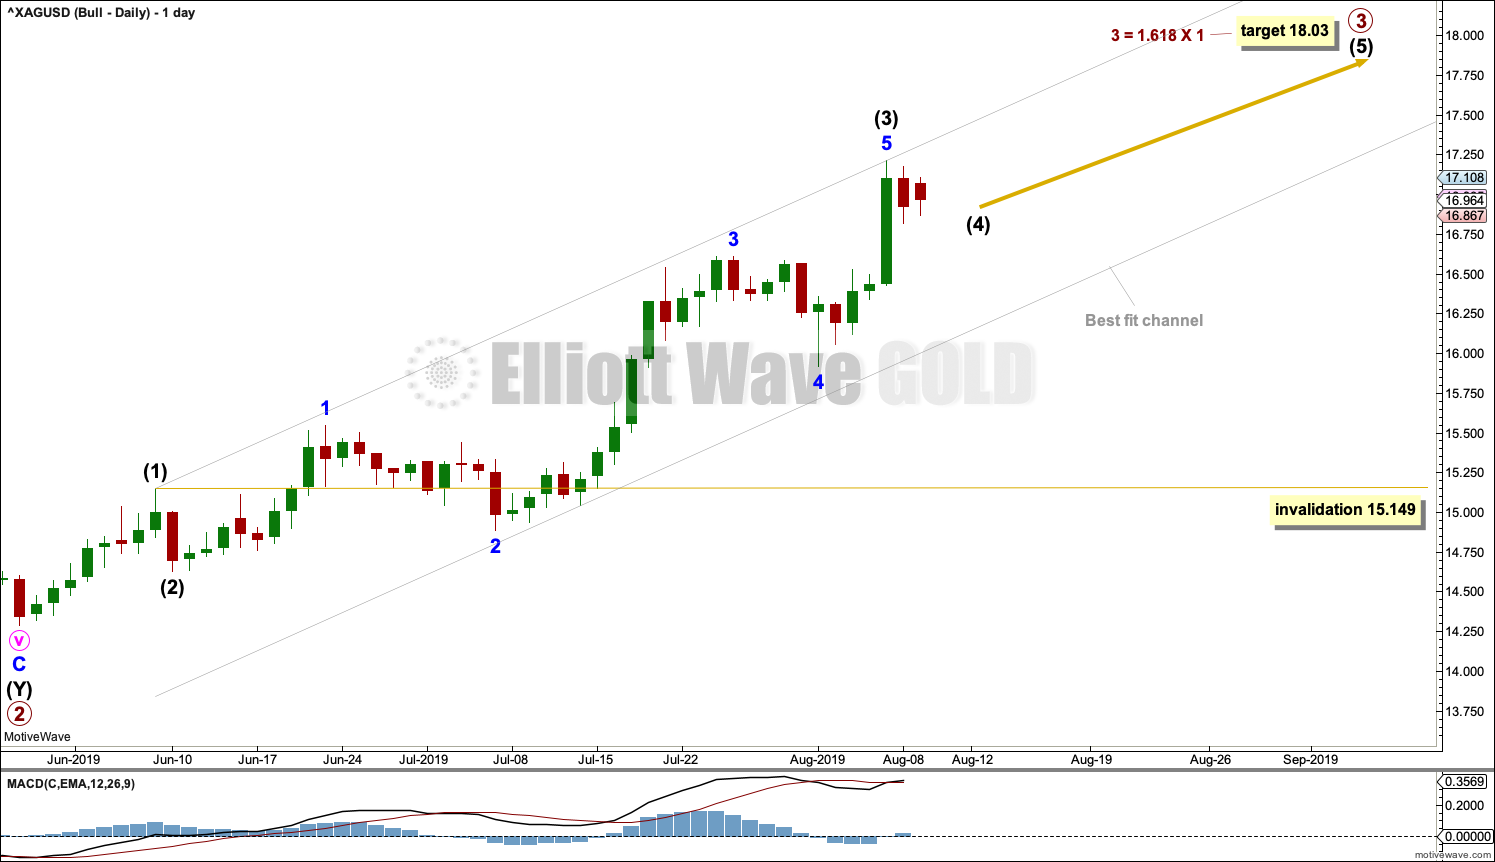
Primary wave 3 may only subdivide as an impulse. Within the impulse, intermediate waves (1) through to (3) may be complete.
Intermediate wave (4) may unfold sideways over a very few days as a triangle, combination or flat correction. Intermediate wave (4) may not move into intermediate wave (1) price territory below 15.149.
TECHNICAL ANALYSIS
WEEKLY CHART
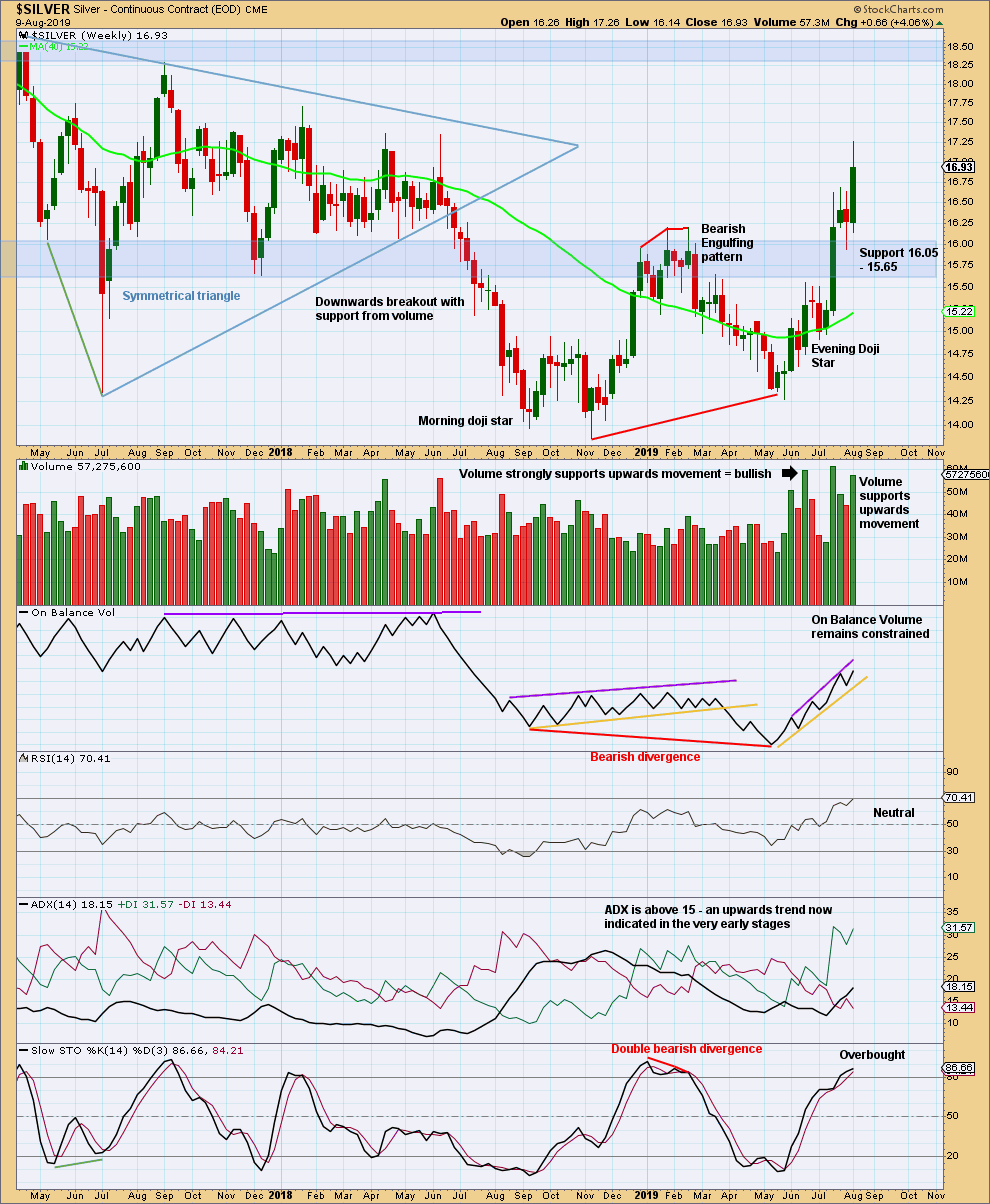
Click chart to enlarge. Chart courtesy of StockCharts.com.
Support has been tested and held. The upwards trend continues. Next strong resistance is in the blue shaded zone above.
DAILY CHART
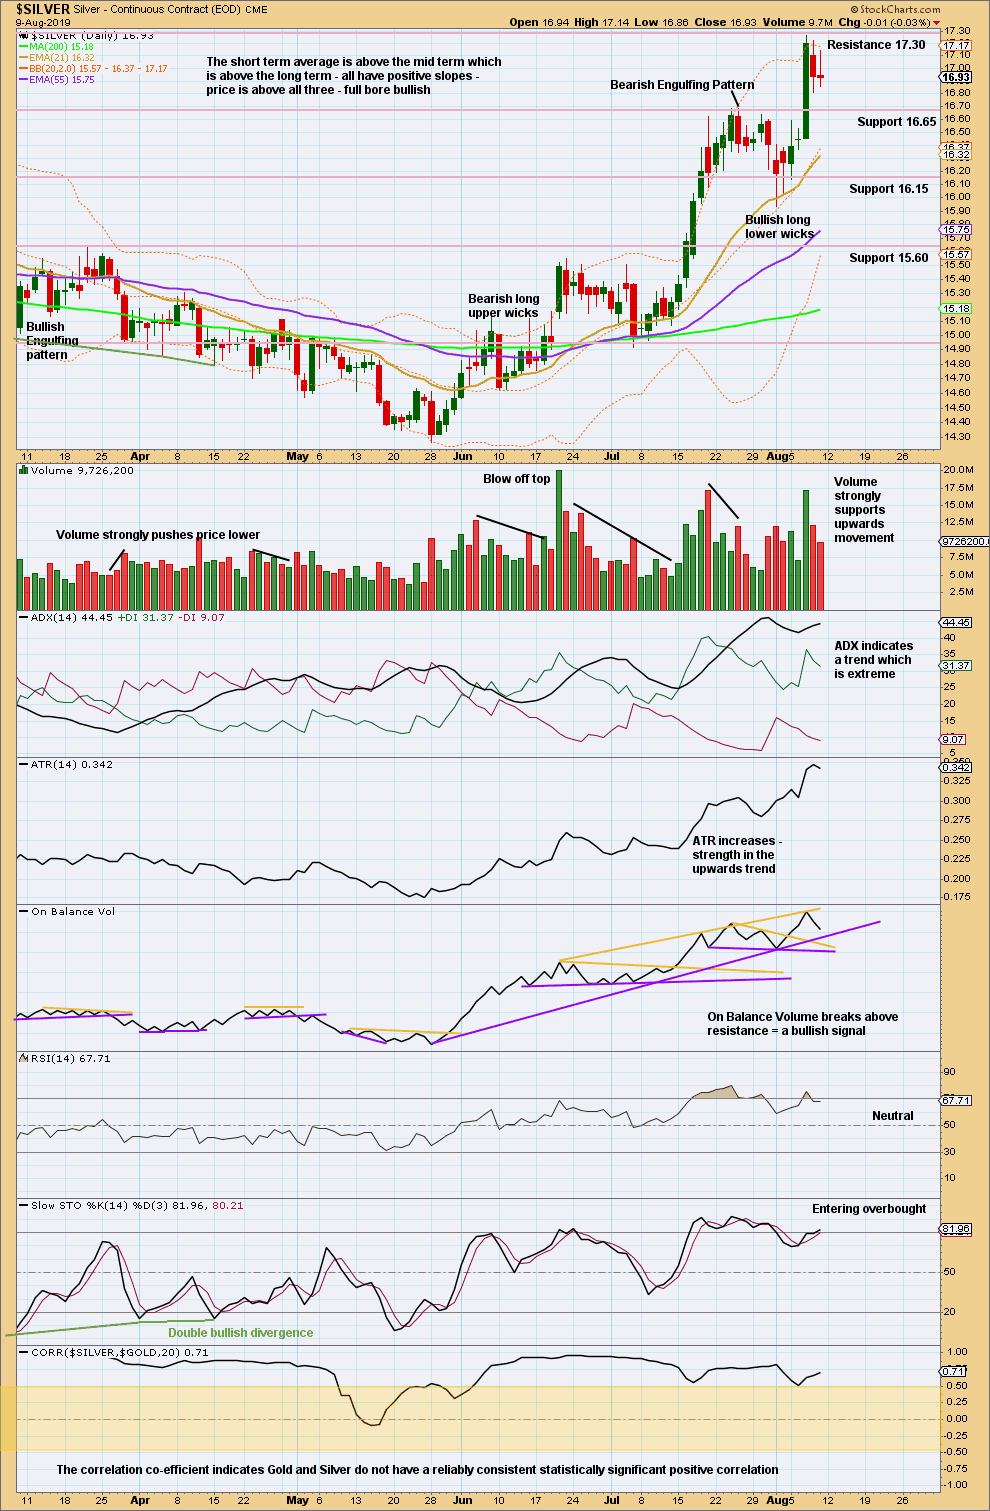
Click chart to enlarge. Chart courtesy of StockCharts.com.
There is reasonable resistance here about 17.30.
There is an upwards trend at both the daily and weekly chart time frames. There is as yet no evidence the trend has ended. Expect pullbacks and consolidations to occur within the upwards trend.
Published @ 09:53 p.m. EST.
—
Careful risk management protects your trading account(s).
Follow my two Golden Rules:
1. Always trade with stops.
2. Risk only 1-5% of equity on any one trade.
—
New updates to this analysis are in bold.