
A very small range day while New York is on holiday leaves both Elliott wave counts unchanged.
Summary: It looks increasingly likely that a major high may be in place. The upwards trend reached very extreme and overbought, and there are now candlestick reversal patterns on both weekly and daily charts.
The bullish wave count now expects downwards movement for a week or two to 1,469.
The main bearish wave count expects a new downwards wave to last one to several years has begun. This may now be taken more seriously.
If price makes a new high above 1,552.65, then the next target would be at 1,572
A classic analysis target using the pennant pattern is at 1,660. This target may still be optimistic.
Grand SuperCycle analysis is here.
Monthly charts were last published here with video here.
BEARISH ELLIOTT WAVE COUNT
WEEKLY CHART
Click chart to enlarge.
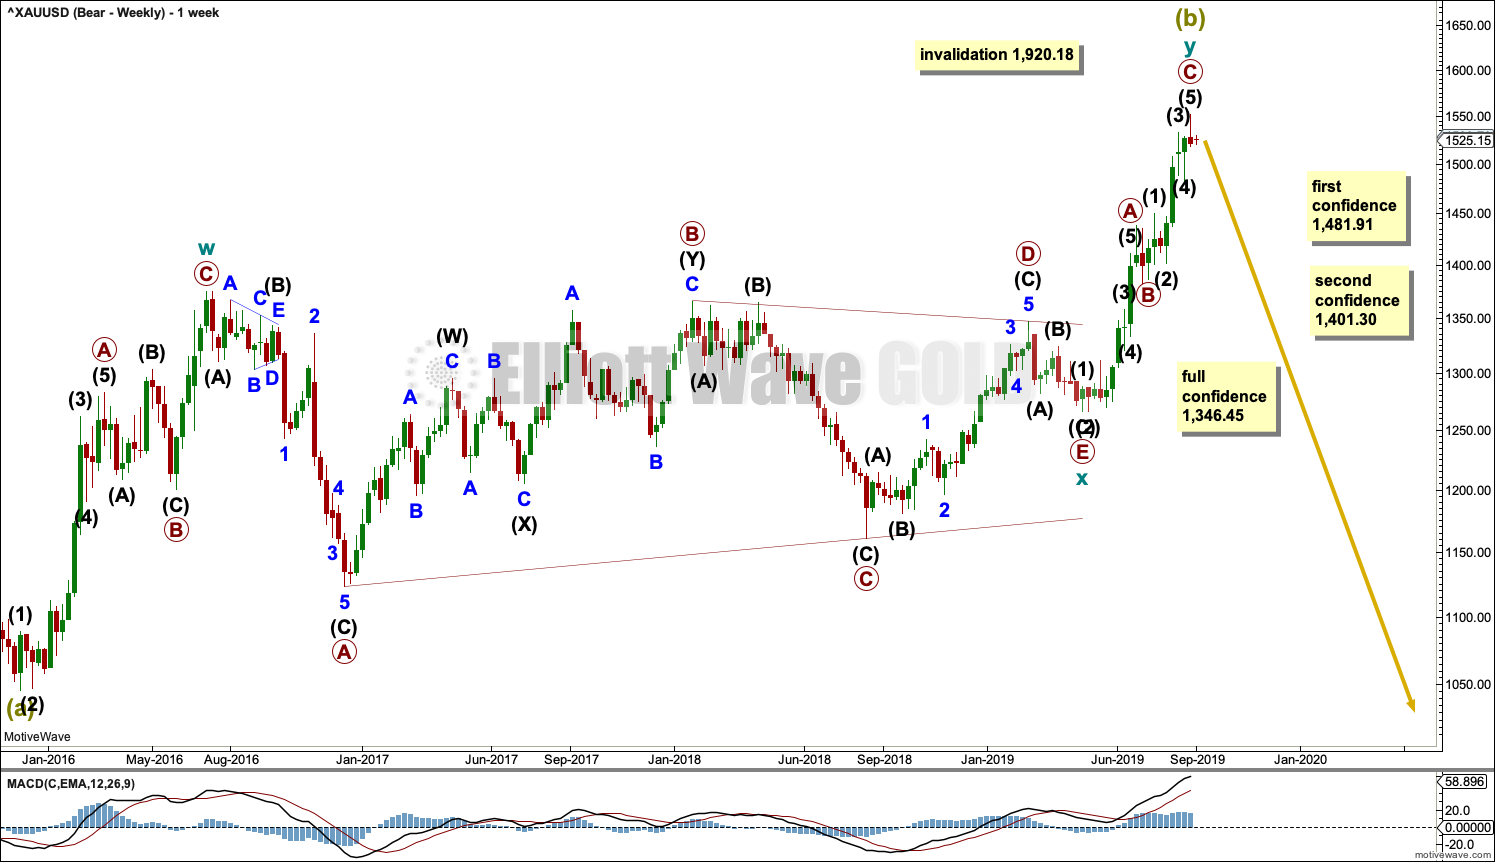
It is possible that Super Cycle wave (b) is completing as a double zigzag.
The first zigzag in the double is labelled cycle wave w. The double is joined by a three in the opposite direction, a triangle labelled cycle wave x. The second zigzag in the double is labelled cycle wave y.
Cycle wave y may now be a complete zigzag, or it may yet continue a little higher.
The purpose of the second zigzag in a double is to deepen the correction. Cycle wave y has achieved this purpose.
1,481.91 is the start of intermediate wave (5) within primary wave C. A new low below 1,481.91 could not be a second wave correction within intermediate wave (5), so at that stage intermediate wave (5) would have to be over.
1,401.30 is the start of primary wave C. A new low below this point could not be a second wave correction within primary wave C, so at that stage primary wave C would be confirmed as over.
A new low below 1,346.45 would invalidate the bullish wave count below and add confidence to a bearish wave count.
DAILY CHART
Click chart to enlarge.
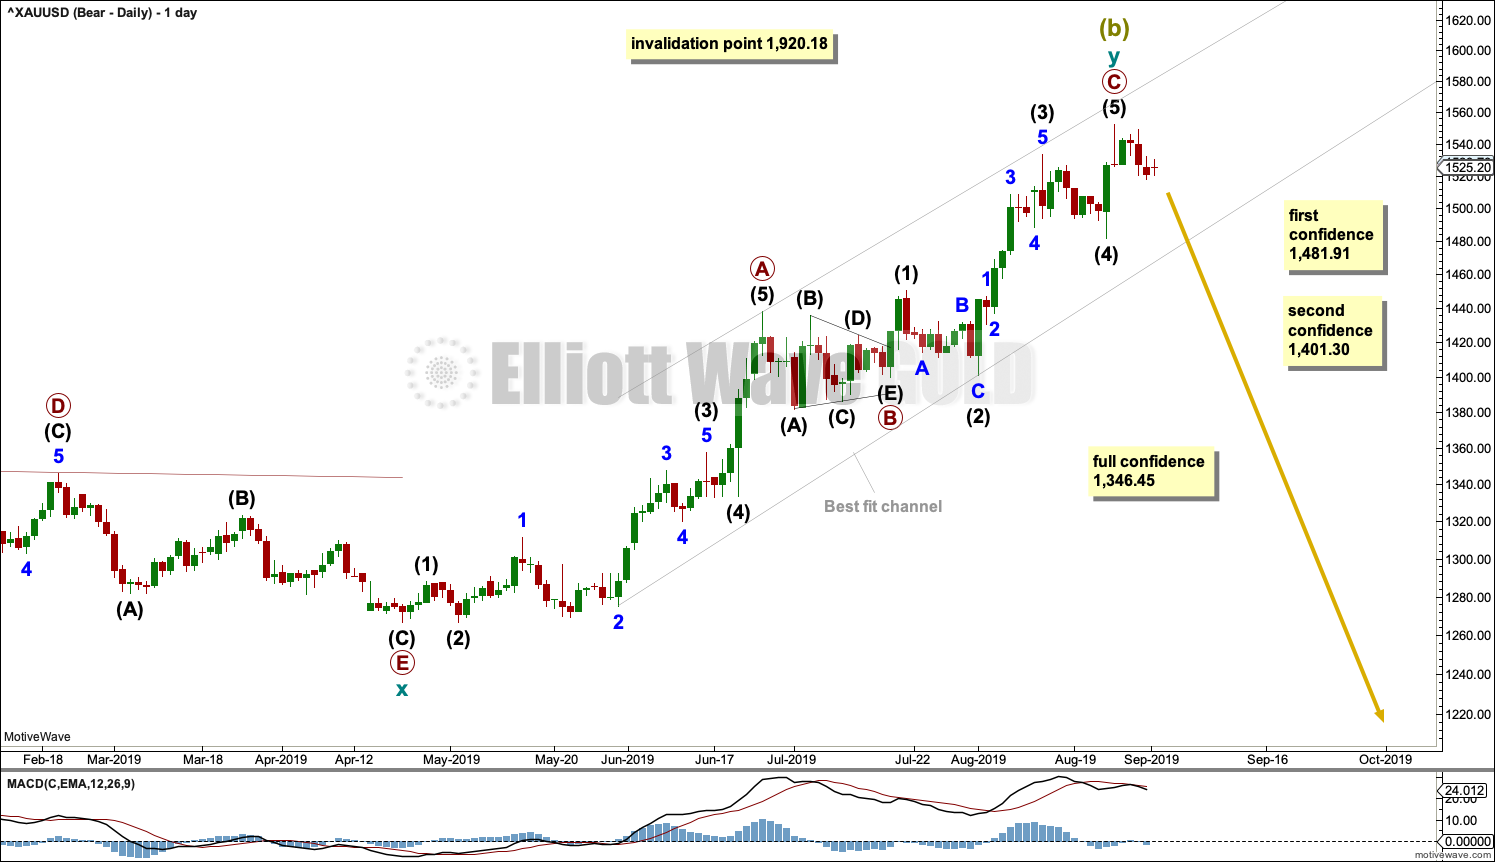
Within cycle wave y, the triangle that ended on the 17th of July may have been primary wave B. Primary wave C may have begun there. Primary wave C must subdivide as a five wave structure; it could be a complete impulse.
Within cycle wave y, there is no Fibonacci Ratio between primary waves A and C.
Within primary wave C, intermediate wave (3) is just 0.33 longer than 2.618 the length of intermediate wave (1). If intermediate wave (5) is over at the last high, then it exhibits no Fibonacci ratio to either of intermediate waves (1) or (3).
A breach of the best fit trend channel by downwards movement would be a very strong indication of a major trend change.
There are two hourly charts below. The first follows labelling from this main wave count. The alternate moves the degree of labelling within intermediate wave (5) down one degree and considers the possibility that it was not over at the last high.
MAIN HOURLY CHART
Click chart to enlarge.
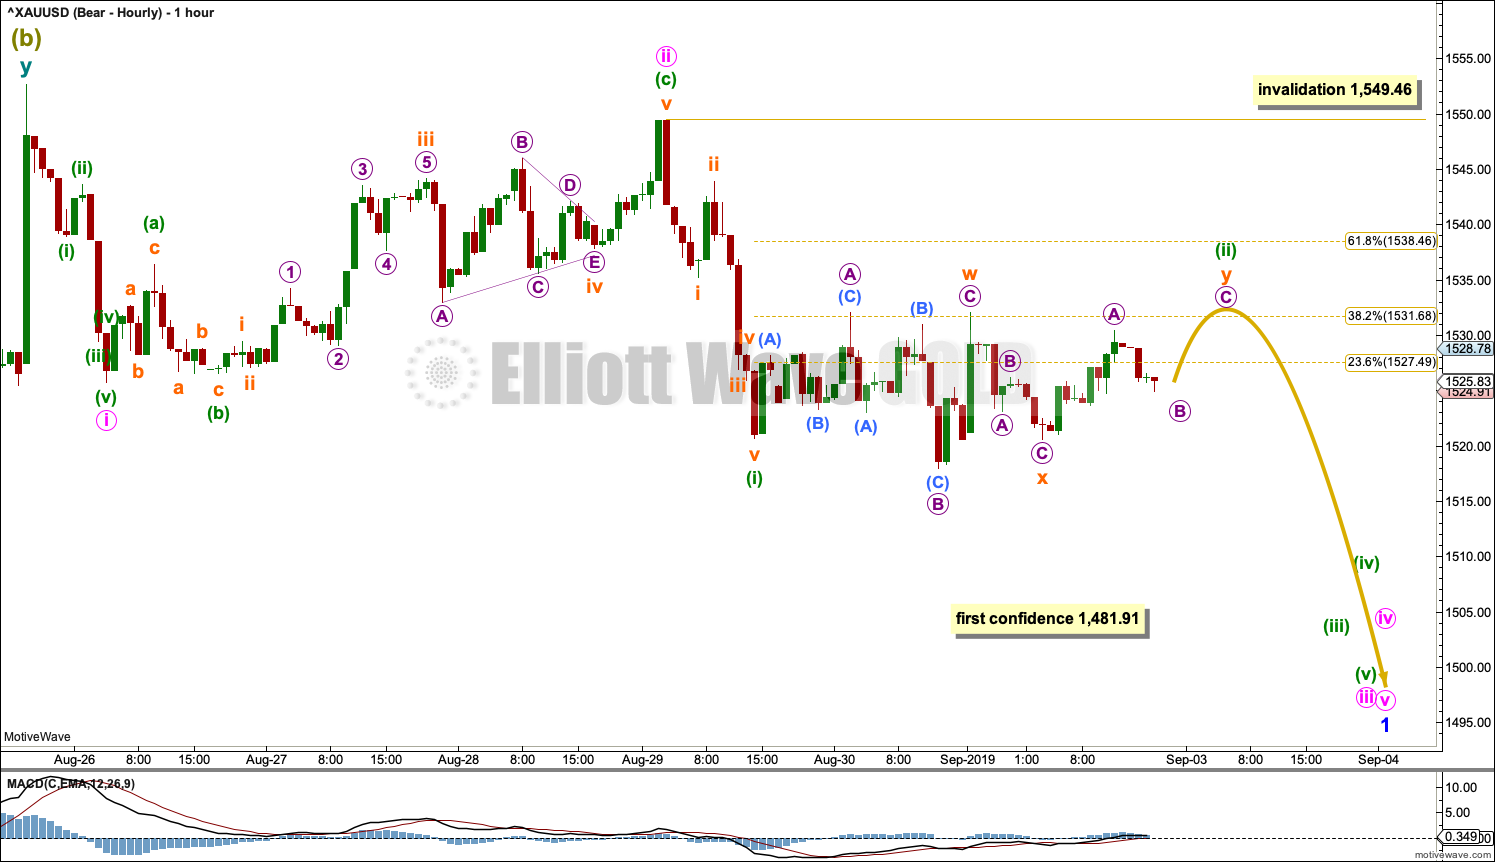
Intermediate wave (5) may now be a complete five wave impulse.
If there has been a trend change at Super Cycle degree, then a five down should develop at all of hourly, daily and weekly time frames. It would be labelled minor wave 1 at the hourly chart time frame.
Within minor wave 1, minute waves i and ii may be complete and minute wave iii may only subdivide as an impulse. Within minute wave iii, minuette wave (i) may be complete and minuette wave (ii) may not move beyond the start of minuette wave (i) above 1,549.46.
Minuette wave (ii) may be an incomplete double combination: flat – x – zigzag.
ALTERNATE HOURLY CHART
Click chart to enlarge.
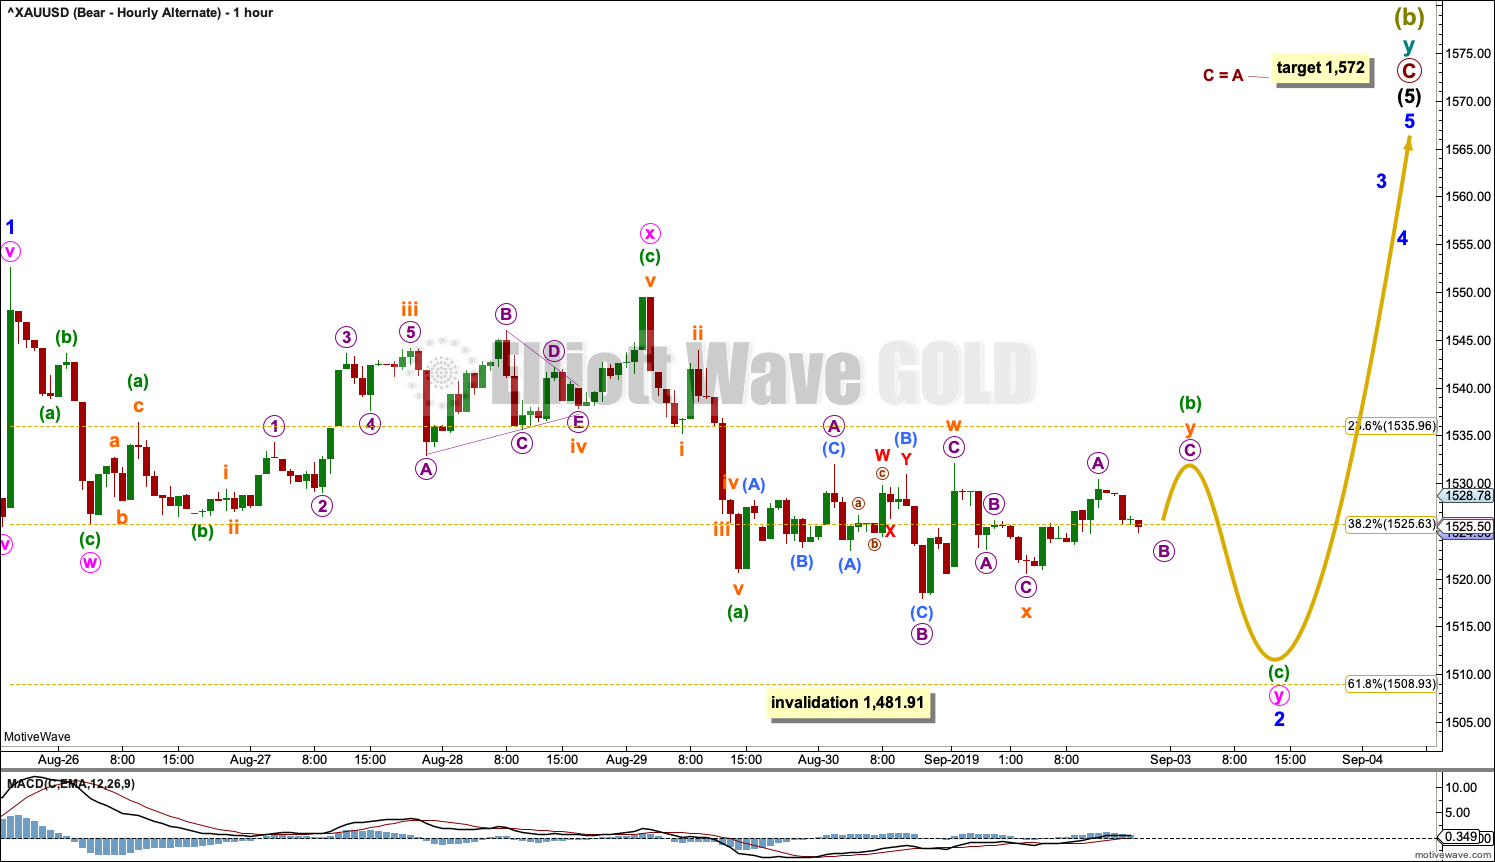
This alternate wave count moves the degree of labelling within intermediate wave (5) down one degree to see the structure incomplete. Only minor wave 1 within intermediate wave (5) may be over at the last high.
Minor wave 2 may not move beyond the start of minor wave 1 below 1,481.91. Minor wave 2 may be an incomplete double zigzag. Minor wave 2 may move lower to end closer to the 0.618 Fibonacci ratio of minor wave 1.
Minor wave 2 may not move beyond the start of minor wave 1 below 1,481.91.
The target for Super Cycle wave (b) to end remains the same.
BULLISH ELLIOTT WAVE COUNT
WEEKLY CHART
Click chart to enlarge.
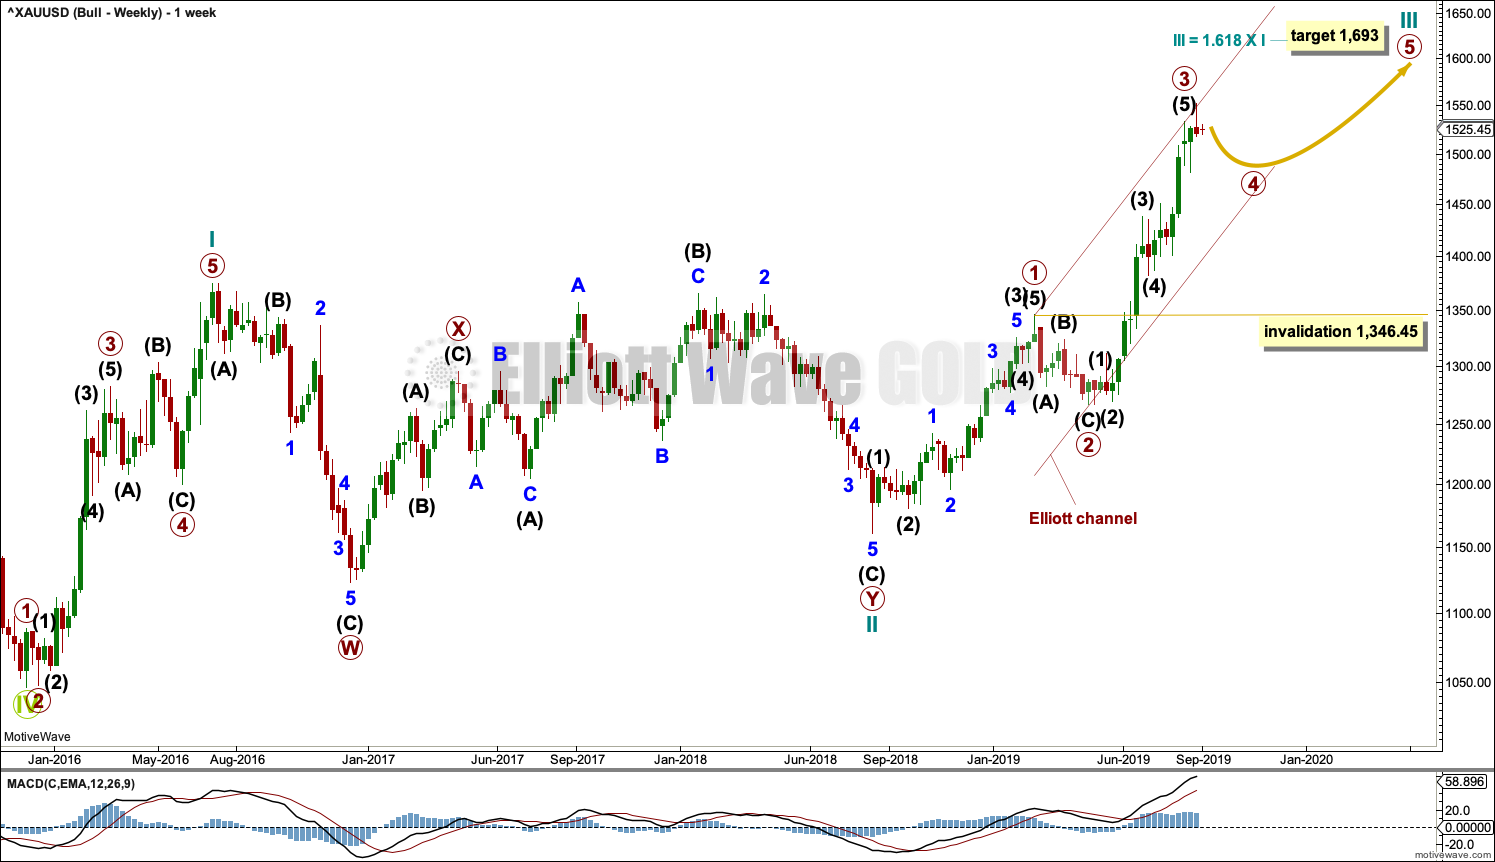
This wave count sees the the bear market complete at the last major low for Gold in November 2015.
If Gold is in a new bull market, then it should begin with a five wave structure upwards on the weekly chart. However, the biggest problem with this wave count is the structure labelled cycle wave I because this wave count must see it as a five wave structure, but it looks more like a three wave structure.
Commodities often exhibit swift strong fifth waves that force the fourth wave corrections coming just prior and just after to be more brief and shallow than their counterpart second waves. It is unusual for a commodity to exhibit a quick second wave and a more time consuming fourth wave, and this is how cycle wave I is labelled. This wave count still suffers from this very substantial problem, and for this reason the bearish wave count is still considered because it has a better fit in terms of Elliott wave structure.
Cycle wave II subdivides well as a double combination: zigzag – X – expanded flat.
Cycle wave III may have begun. Within cycle wave III, primary waves 1 and 2 may now be complete. Primary wave 3 has now moved above the end of primary wave 1 meeting a core Elliott wave rule. It has now moved far enough to allow room for primary wave 4 to unfold and remain above primary wave 1 price territory. Primary wave 4 may not move into primary wave 1 price territory below 1,346.45.
Cycle wave III so far for this wave count would have been underway now for 55 weeks. It is beginning to exhibit some support from volume and increasing ATR. This wave count now has some support from classic technical analysis.
The channel drawn about cycle wave III is an Elliott channel. Primary wave 4 may find support about the lower edge if it is time consuming enough.
DAILY CHART

Click chart to enlarge.
Primary wave 4 may be continuing as an expanded flat, which is a common corrective structure. This would see alternation in structure with the zigzag of primary wave 2.
Primary wave 2 lasted 43 sessions. Primary wave 4 may be expected to be more brief; Gold usually exhibits more brief fourth waves than their counterpart second waves. Primary wave 4 may end in a total Fibonacci 21 or 34 sessions. So far it has lasted 14 sessions.
Primary wave 4 may not move into primary wave 1 price territory below 1,346.45.
HOURLY CHART
Click chart to enlarge.
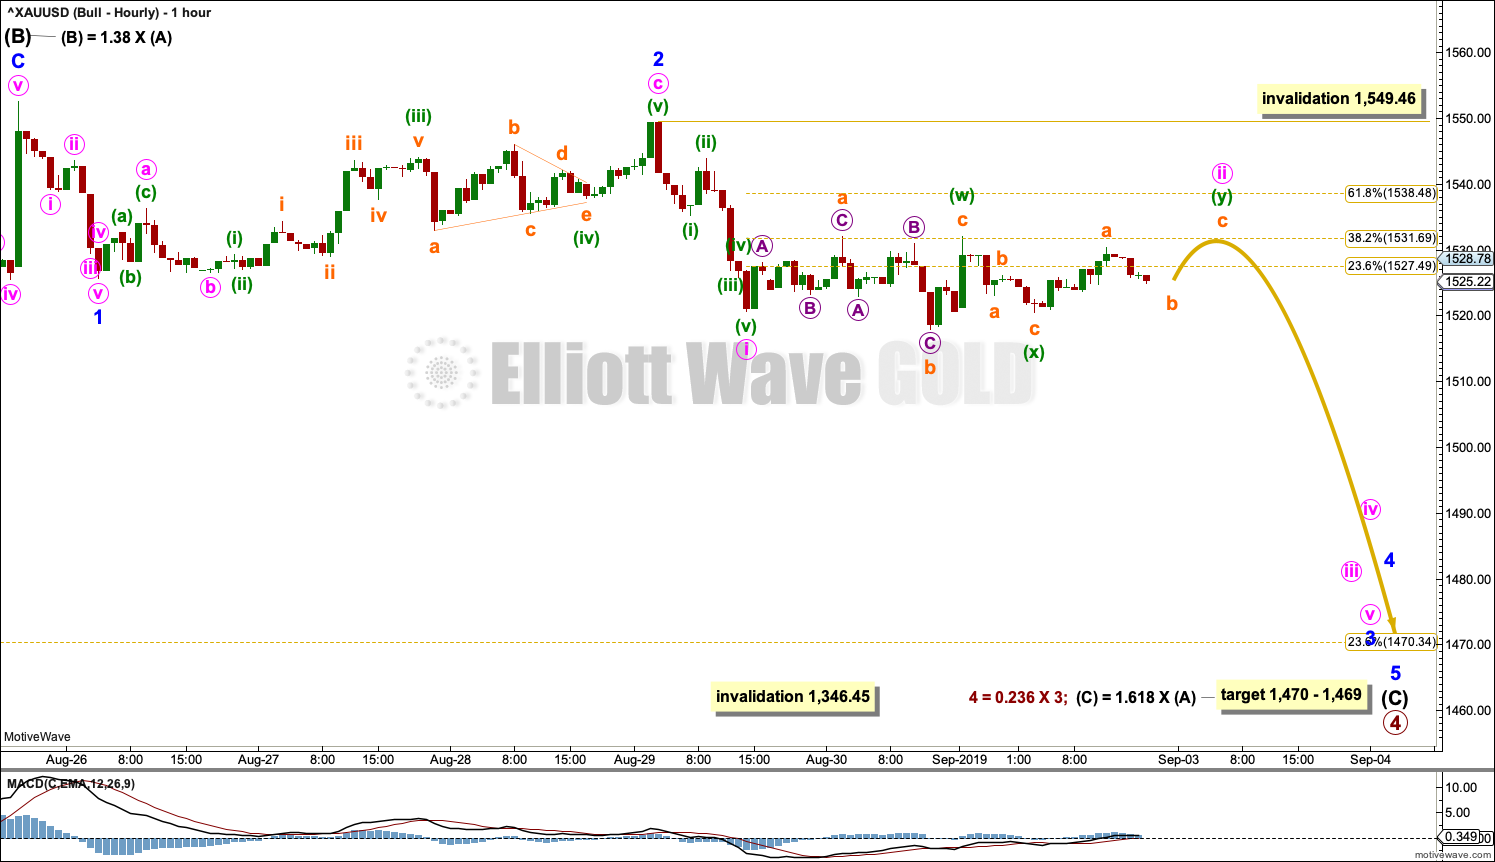
Within expanded flat corrections, wave B is commonly from 1 to 1.38 times the length of wave A. For this example, intermediate wave (B) is within the most common length.
A target is calculated for intermediate wave (C) to end based upon the most common Fibonacci Ratio to intermediate wave (A) within an expanded flat. This target is just $1 lower than the 0.236 Fibonacci Ratio of primary wave 3 at 1,470.
Intermediate wave (C) must subdivide as a five wave structure. Within intermediate wave (C), minor waves 1 and 2 may now be complete and minor wave 3 may only subdivide as an impulse. Within minor wave 3, minute wave ii may not move beyond the start of minute wave i above 1,549.46.
Minute wave ii may be an incomplete double combination: flat – x – zigzag.
TECHNICAL ANALYSIS
WEEKLY CHART
Click chart to enlarge. Chart courtesy of StockCharts.com.
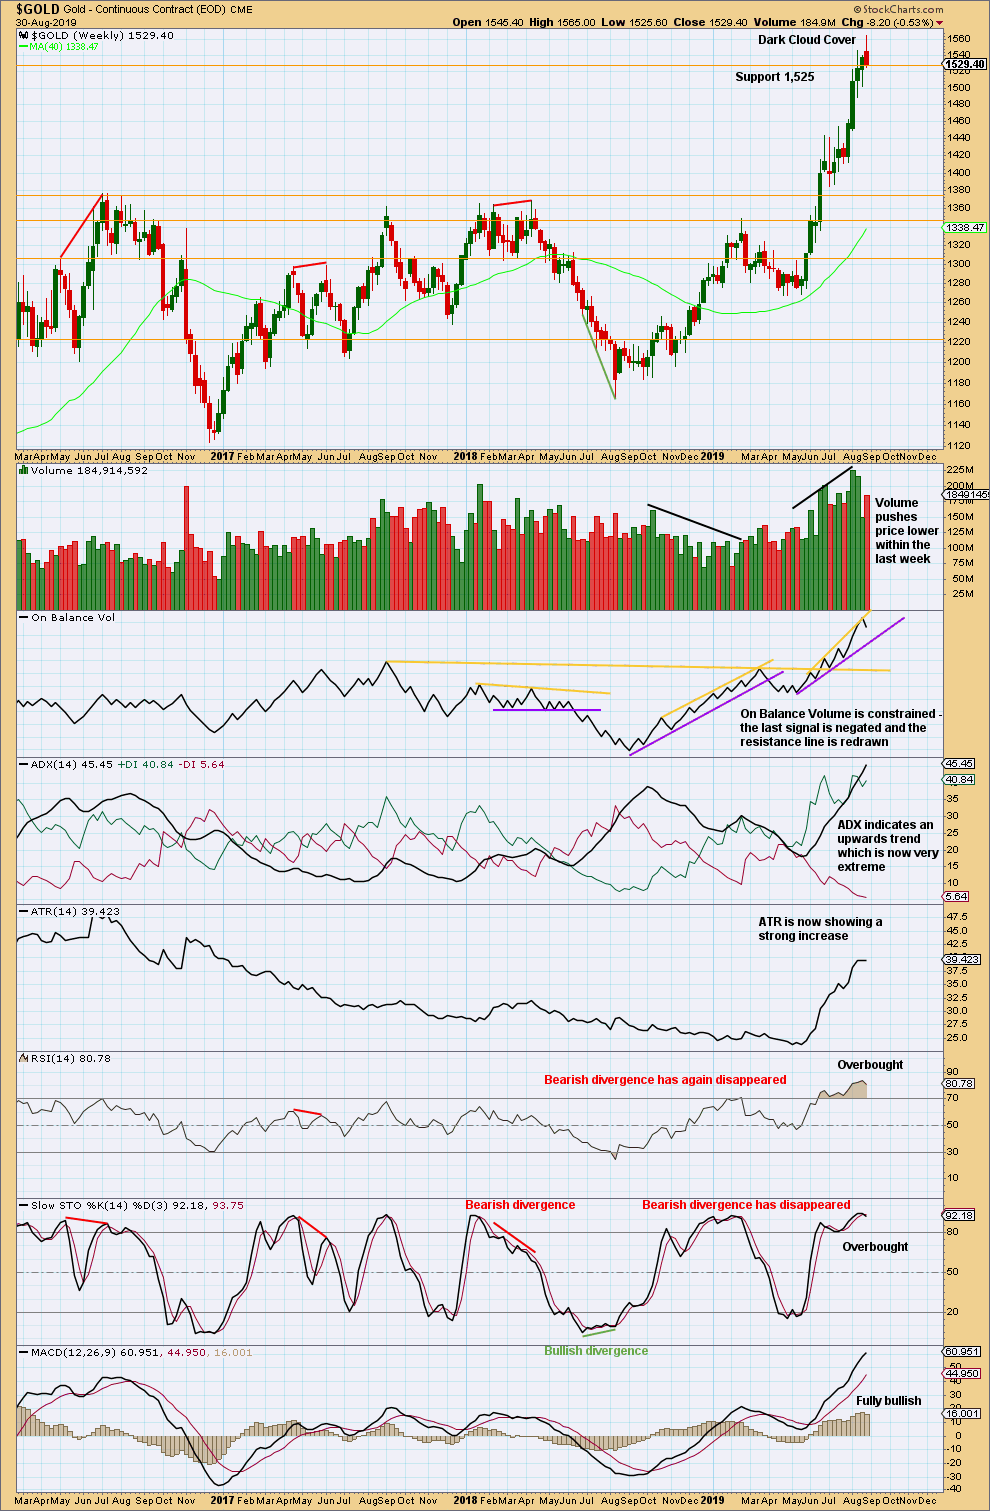
When trends reach very extreme, candlestick reversal patterns should be given weight. The Dark Cloud Cover bearish reversal pattern is given more bearish weight from the long upper wick.
The risk of a major high and a trend change or a large time consuming consolidation developing here is very high. These two scenarios effectively follow the main bearish wave count (major trend change) or bullish wave count (a large time consuming consolidation).
DAILY CHART
Click chart to enlarge. Chart courtesy of StockCharts.com.
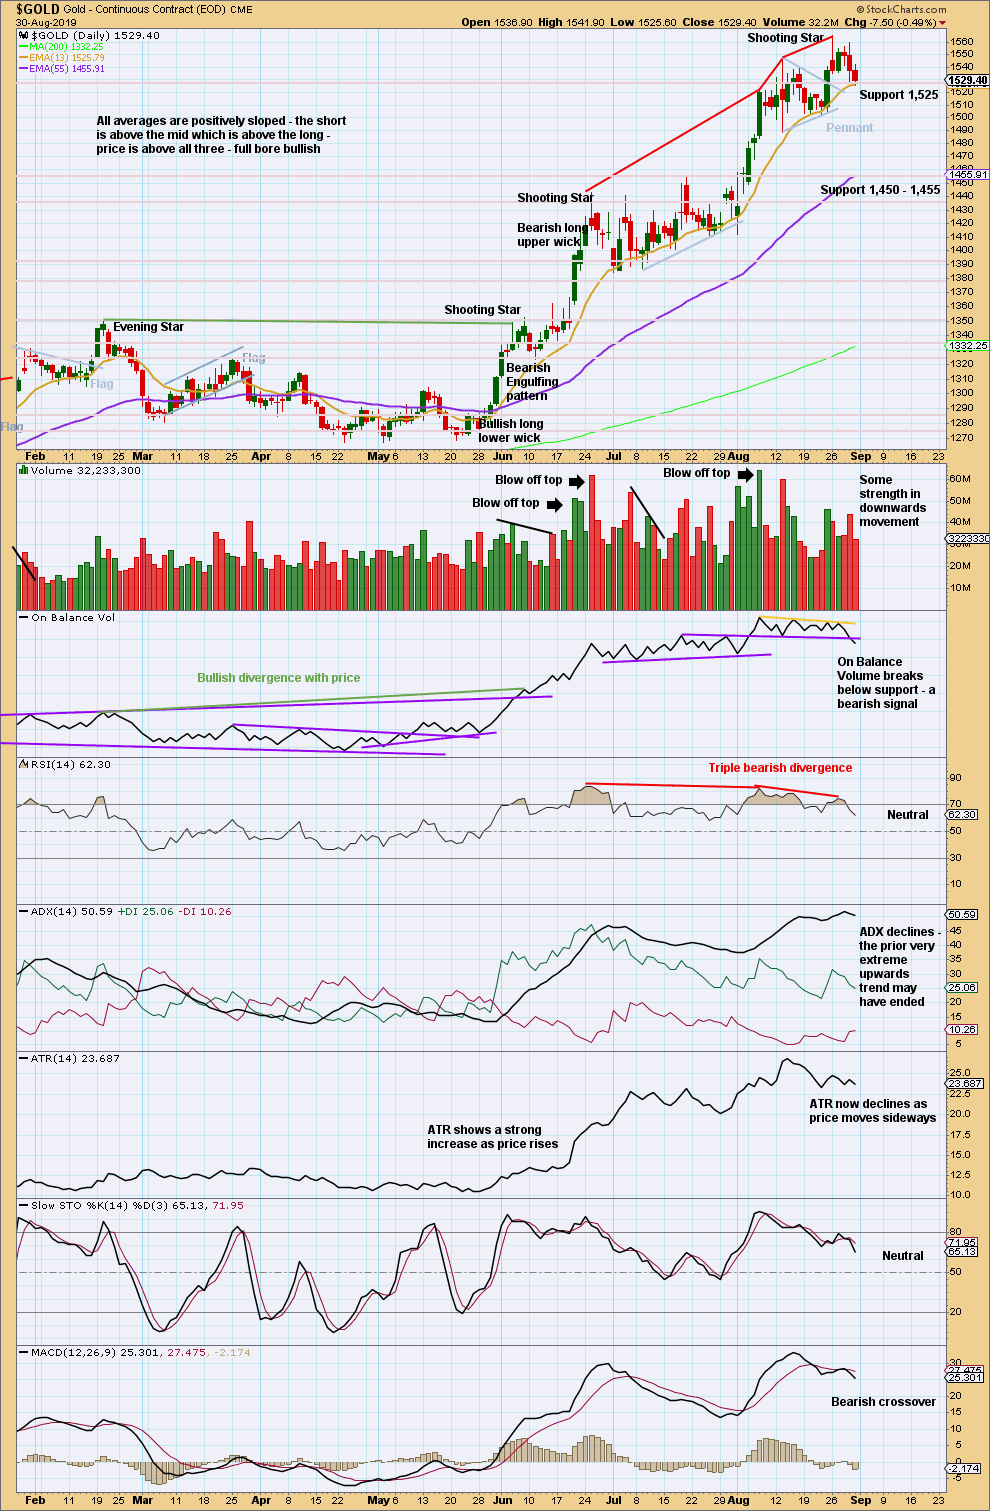
There is no new data today to analyse because StockCharts data is New York session only and New York is closed for Labor Day, a public holiday in the US.
When trends reach very extreme at both weekly and daily time frames, and then candlestick reversal patterns develop at both time frames, more weight may be given to the idea of a major trend change. This is especially so when RSI has reached extreme and then exhibited multiple divergence with price.
Look out for either a major trend change or a very time consuming consolidation to alleviate extreme conditions.
GDX WEEKLY CHART
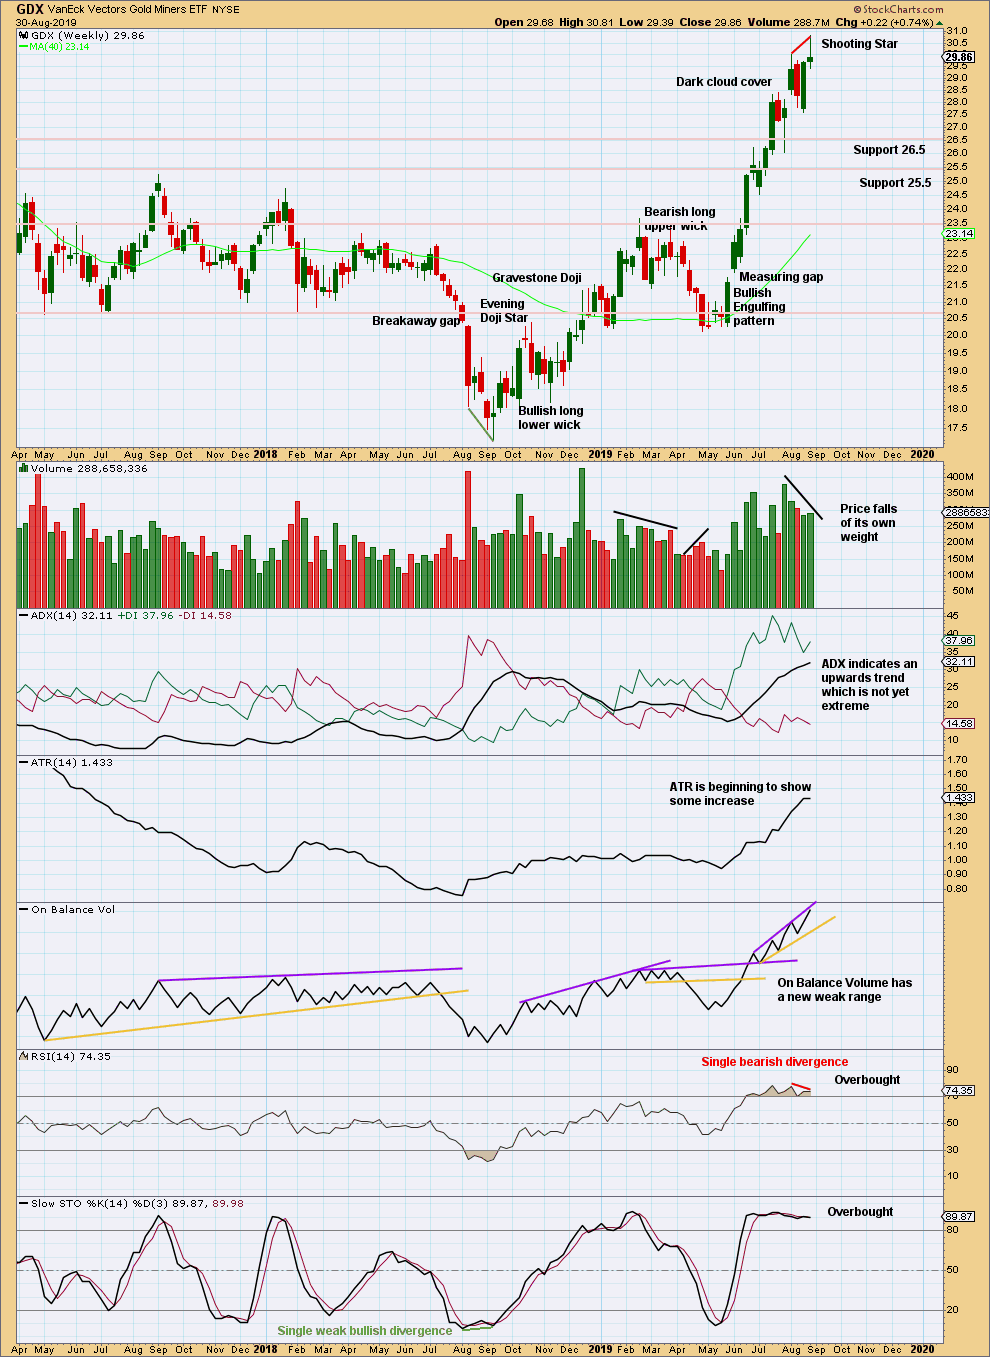
Click chart to enlarge. Chart courtesy of StockCharts.com.
This week closes as a fairly strong bearish candlestick, a Shooting Star with a long upper wick. Look out for either a trend change to either down or sideways here.
GDX DAILY CHART
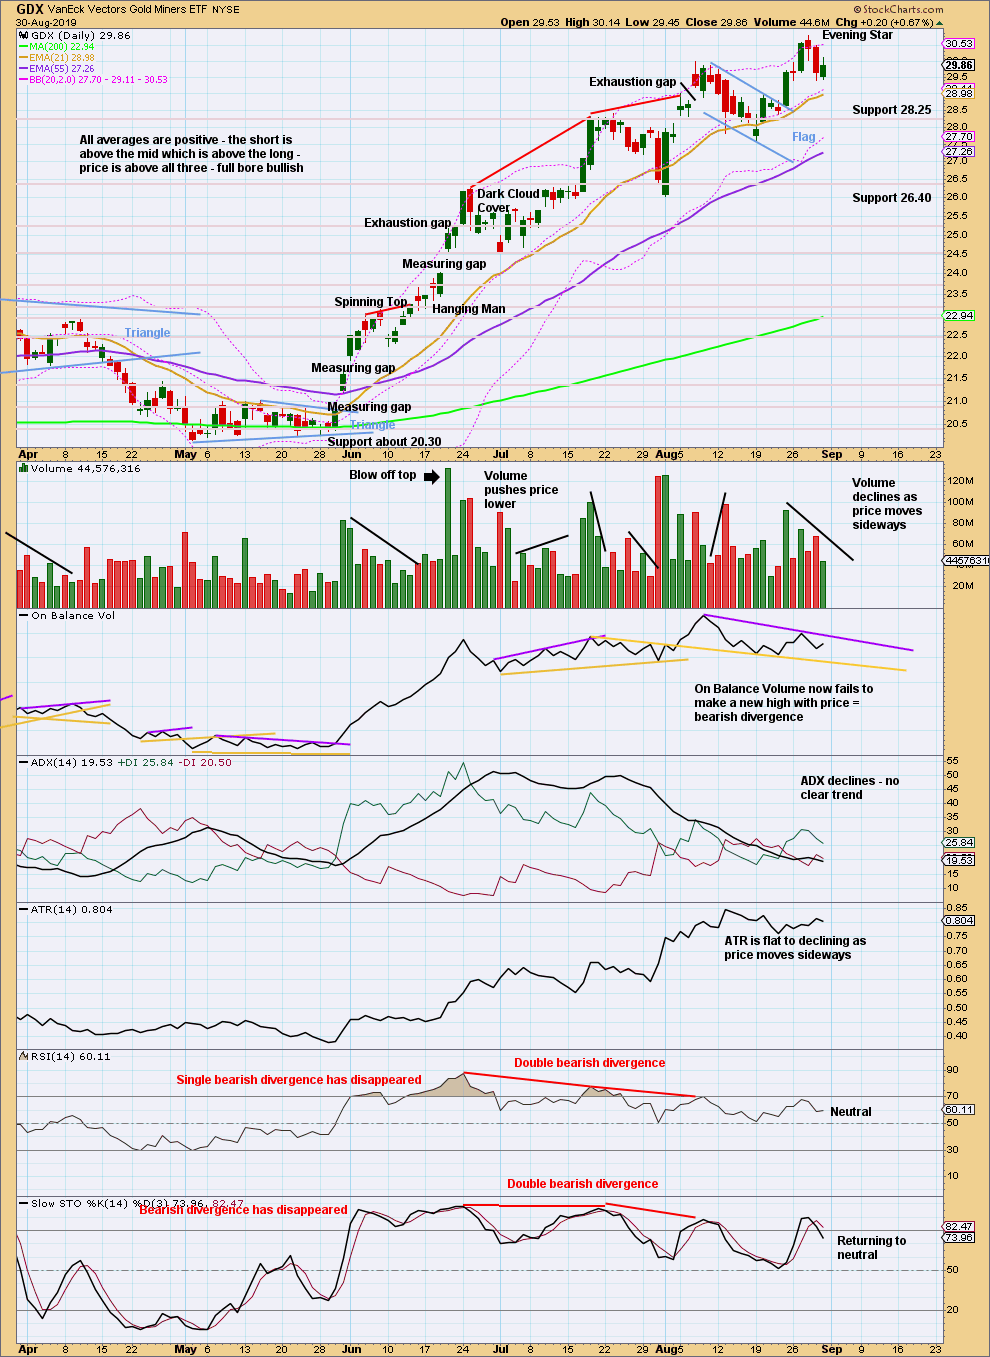
Click chart to enlarge. Chart courtesy of StockCharts.com.
The target using the flag pole is at 32.76. This may now not be met.
GDX may have seen a trend change to either sideways for a consolidation or downwards for a new trend.
Published @ 09:14 p.m. EST.
—
Careful risk management protects your trading account(s).
Follow my two Golden Rules:
1. Always trade with stops.
2. Risk only 1-5% of equity on any one trade.
—
New updates to this analysis are in bold.
Gold is at the top of the uptrend channel since 2016. It would be normal for at least a pullback here.
https://www.tradingview.com/x/zCzNN5VJ/
Thats a great channel Dreamer! I’m adding that to weekly charts.
Yes, it seems reasonable to expect a downwards reaction from that line.
hourly bearish chart updated:
hourly bullish chart updated:
if 1,549.46 is breached then I’ll relabel this correction in the same way I have for the bearish hourly chart published above this one.
I think the pennant target is still in play. Today looks bullish too me. Nice 4% pop in silver. Platinum up too. All pm acting the same.
Price remains below resistance. For the pennant target to be back in serious consideration we need an upwards breakout with support from volume. That’s a close above 1,552
Thank you Lara,
I guess we’ll see what happens over the next week or so.
Wow, quite a pop for gold. Curious if this changes the outlook. Price is close to a new high.