
A small range upwards day has failed to close above resistance and exhibits a decline in volume. Three Elliott wave counts now remain valid.
Summary: Price remains range bound and volume suggests a downwards swing to support may begin here. The upwards trend remains very extreme and overbought. The risk of a large consolidation or major trend change here is very high indeed.
The bullish Elliott wave count expects a swing down to 1,473 to 1,470.
The bearish wave count has two scenarios: a false upward breakout to about 1,472 before a major trend change, or a major trend change at today’s high. Use confidence points to indicate which scenario is most likely.
Grand SuperCycle analysis is here.
Monthly charts were last published here with video here.
BEARISH ELLIOTT WAVE COUNT
WEEKLY CHART

Click chart to enlarge.
It is possible that Super Cycle wave (b) is completing as a double zigzag.
The first zigzag in the double is labelled cycle wave w. The double is joined by a three in the opposite direction, a triangle labelled cycle wave x. The second zigzag in the double is labelled cycle wave y.
Cycle wave y may now be a complete zigzag, or it may yet continue a little higher.
The purpose of the second zigzag in a double is to deepen the correction. Cycle wave y has achieved this purpose.
1,481.91 is the start of intermediate wave (5) within primary wave C. A new low below 1,481.91 could not be a second wave correction within intermediate wave (5), so at that stage intermediate wave (5) would have to be over.
1,401.30 is the start of primary wave C. A new low below this point could not be a second wave correction within primary wave C, so at that stage primary wave C would be confirmed as over.
A new low below 1,346.45 would invalidate the bullish wave count below and add confidence to a bearish wave count.
A wide best fit channel is added in light blue. This channel contains all of Super Cycle wave (b) and may currently provide strong resistance. Copy this channel over to daily charts.
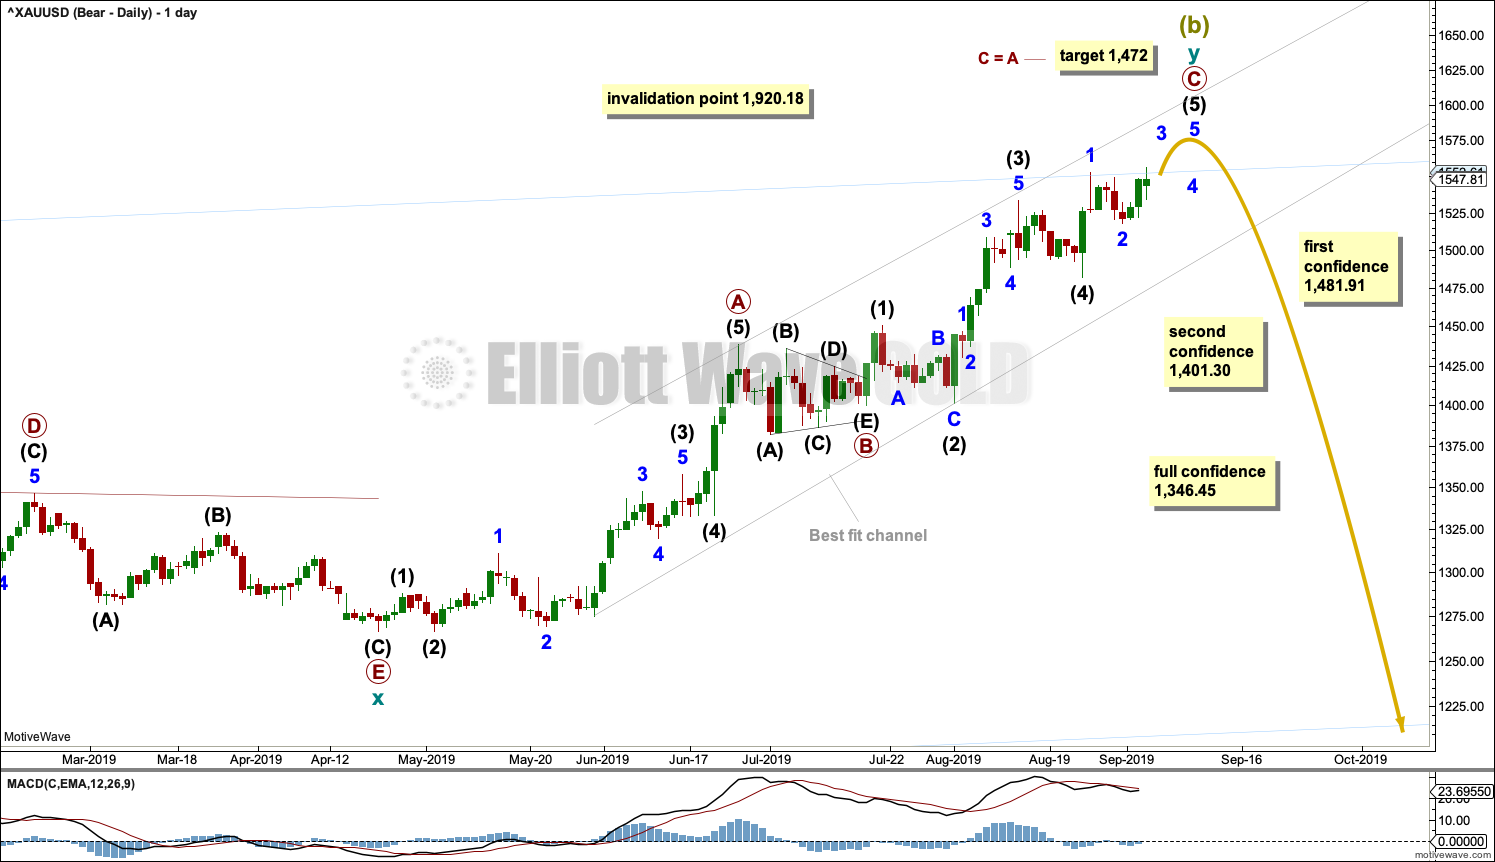
DAILY CHART
Click chart to enlarge.
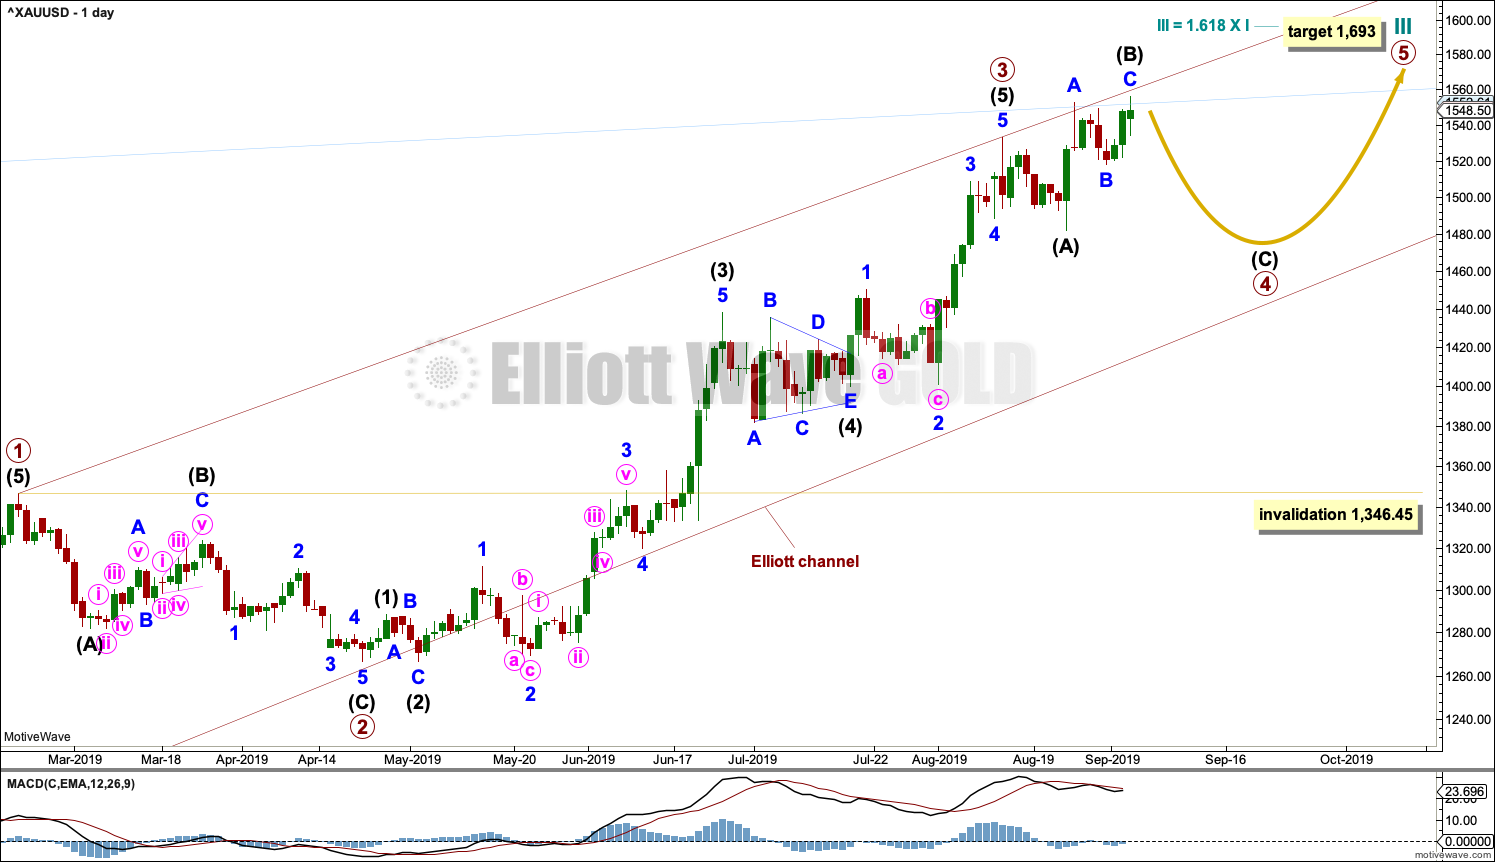
Within cycle wave y, the triangle that ended on the 17th of July may have been primary wave B. Primary wave C may have begun there. Primary wave C must subdivide as a five wave structure; it could be an incomplete impulse.
Within cycle wave y, there is no Fibonacci Ratio between primary waves A and C.
Within primary wave C, intermediate wave (3) is just 0.33 longer than 2.618 the length of intermediate wave (1).
A breach of the best fit trend channel by downwards movement would be a very strong indication of a major trend change.
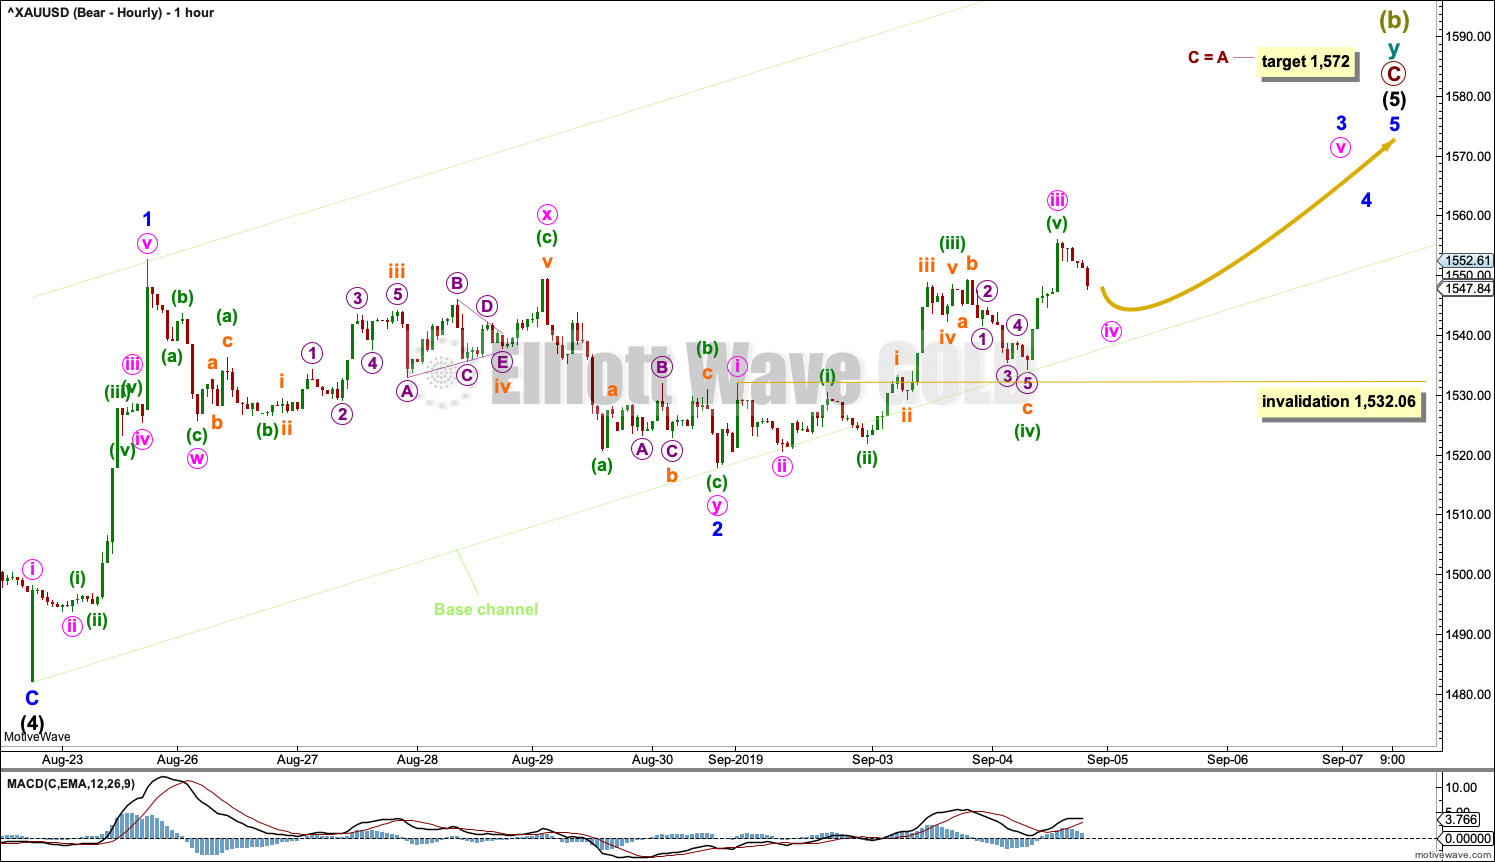
MAIN HOURLY CHART
Click chart to enlarge.
Only minor wave 1 within intermediate wave (5) may be over at the last high.
Minor wave 2 may now be complete. Minor wave 3 must move move above the end of minor wave 1.
Within minor wave 3, minute waves i through to iii may be complete. Minute wave iii would be just 1.32 short of 2.618 the length of minute wave i. Minute wave iv may not move into minute wave i price territory below 1,532.06.
The target for Super Cycle wave (b) to end remains the same.
A base channel is drawn about intermediate wave (5). The lower edge may provide support for pullbacks along the way up.
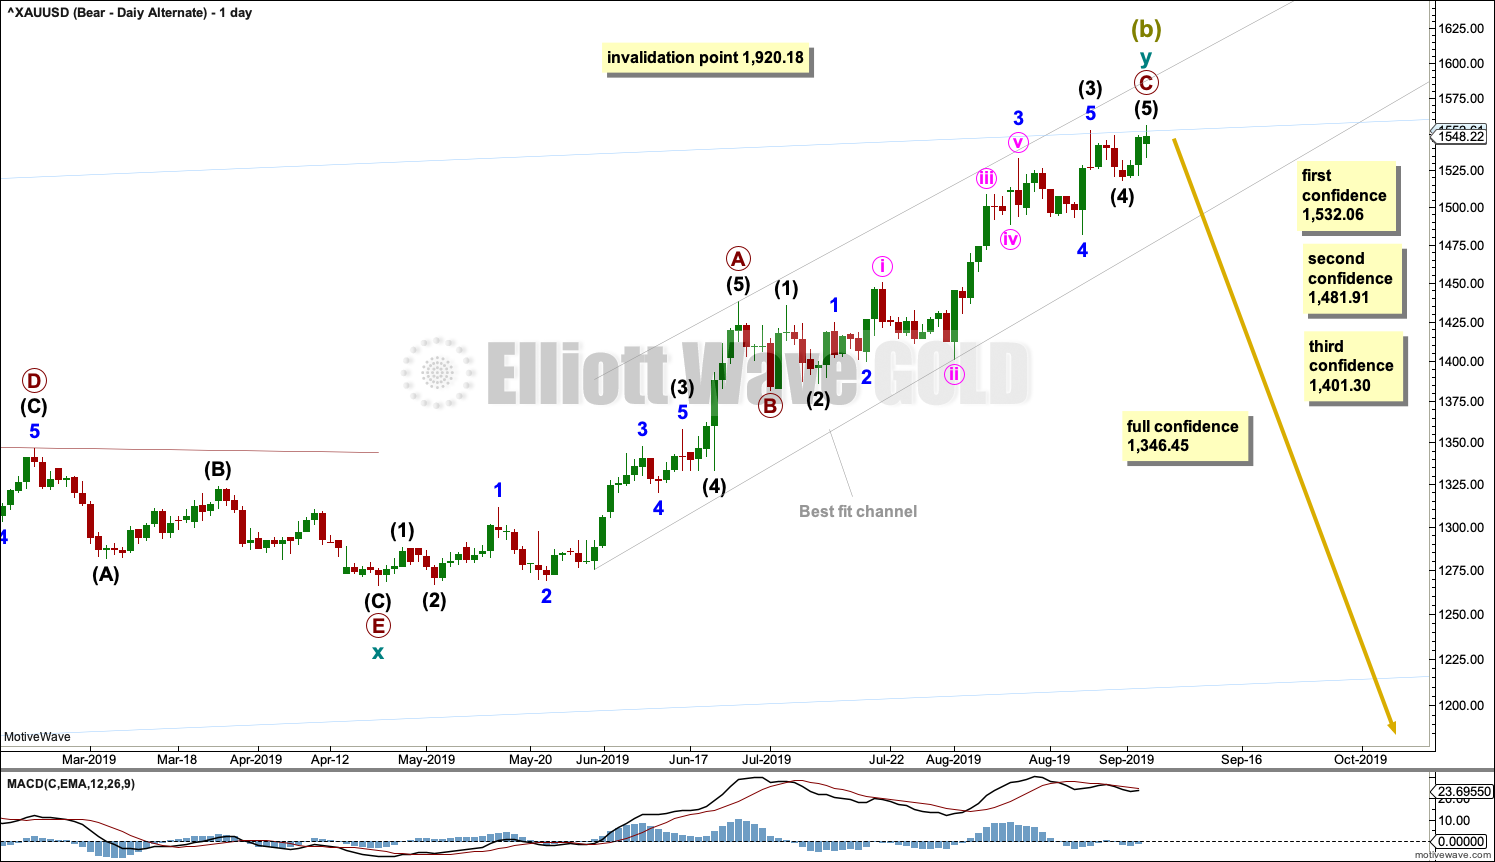
ALTERNATE DAILY CHART
Click chart to enlarge.
Alternately, it is again possible that Super Cycle wave (b) may be a complete five wave impulse at today’s high.
If the triangle which is labelled as primary wave B on the main daily chart is ignored, then primary wave B may have been a brief and shallow zigzag. Primary wave C may have begun earlier with a series of overlapping first and second waves. The structure of primary wave C may now be complete.
This wave count requires confidence points to be passed before it should be taken seriously.
BULLISH ELLIOTT WAVE COUNT
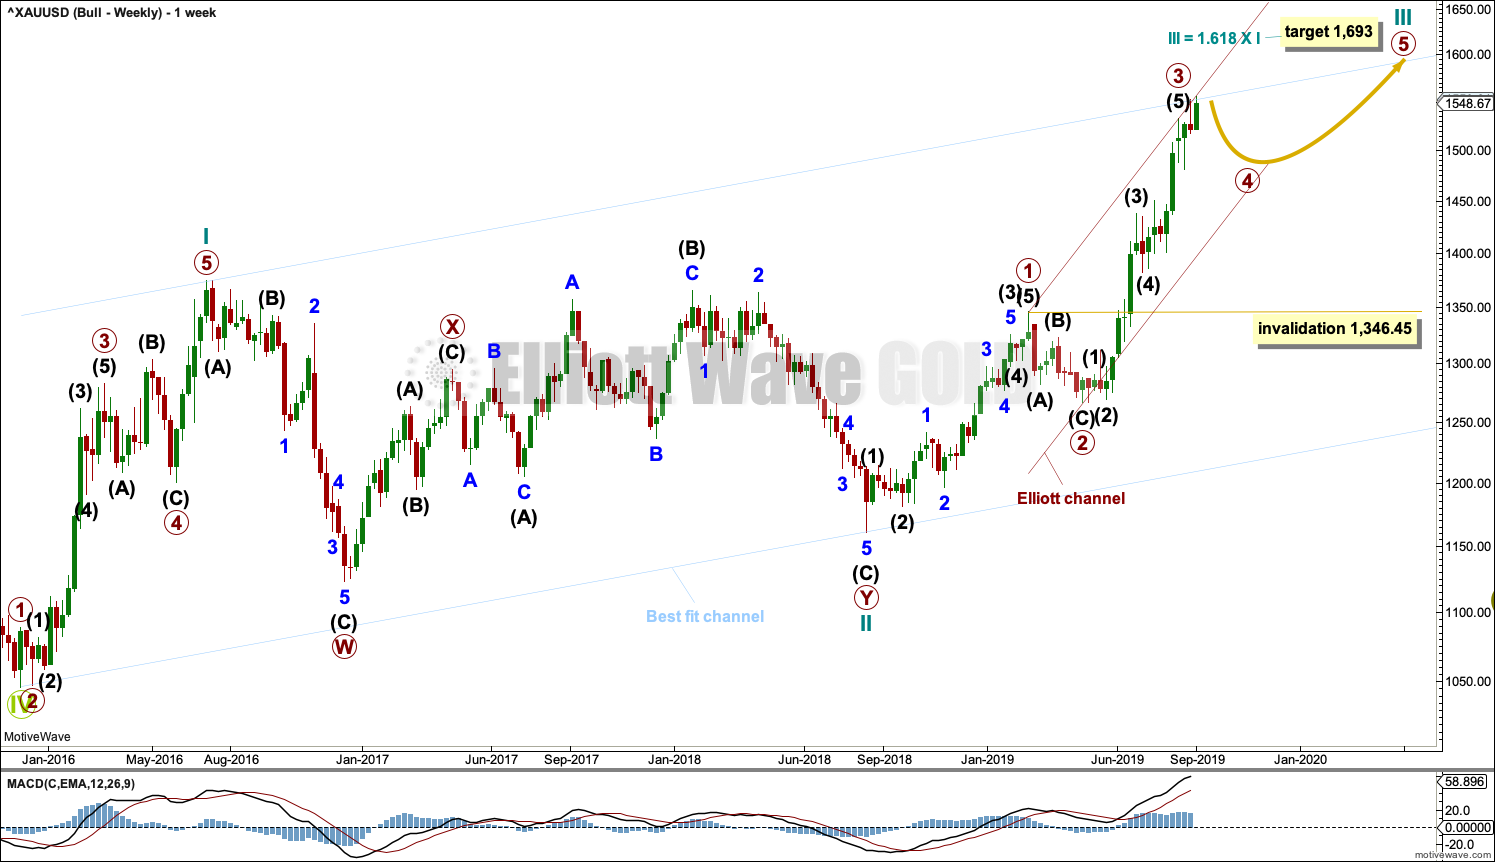
WEEKLY CHART
Click chart to enlarge.
This wave count sees the the bear market complete at the last major low for Gold in November 2015.
If Gold is in a new bull market, then it should begin with a five wave structure upwards on the weekly chart. However, the biggest problem with this wave count is the structure labelled cycle wave I because this wave count must see it as a five wave structure, but it looks more like a three wave structure.
Commodities often exhibit swift strong fifth waves that force the fourth wave corrections coming just prior and just after to be more brief and shallow than their counterpart second waves. It is unusual for a commodity to exhibit a quick second wave and a more time consuming fourth wave, and this is how cycle wave I is labelled. This wave count still suffers from this very substantial problem, and for this reason the bearish wave count is still considered because it has a better fit in terms of Elliott wave structure.
Cycle wave II subdivides well as a double combination: zigzag – X – expanded flat.
Cycle wave III may have begun. Within cycle wave III, primary waves 1 and 2 may now be complete. Primary wave 3 has now moved above the end of primary wave 1 meeting a core Elliott wave rule. It has now moved far enough to allow room for primary wave 4 to unfold and remain above primary wave 1 price territory. Primary wave 4 may not move into primary wave 1 price territory below 1,346.45.
Cycle wave III so far for this wave count would have been underway now for 55 weeks. It is beginning to exhibit some support from volume and increasing ATR. This wave count now has some support from classic technical analysis.
The channel drawn about cycle wave III is an Elliott channel. Primary wave 4 may find support about the lower edge if it is time consuming enough.
Add the wide best fit channel to weekly and daily charts.
DAILY CHART
Click chart to enlarge.
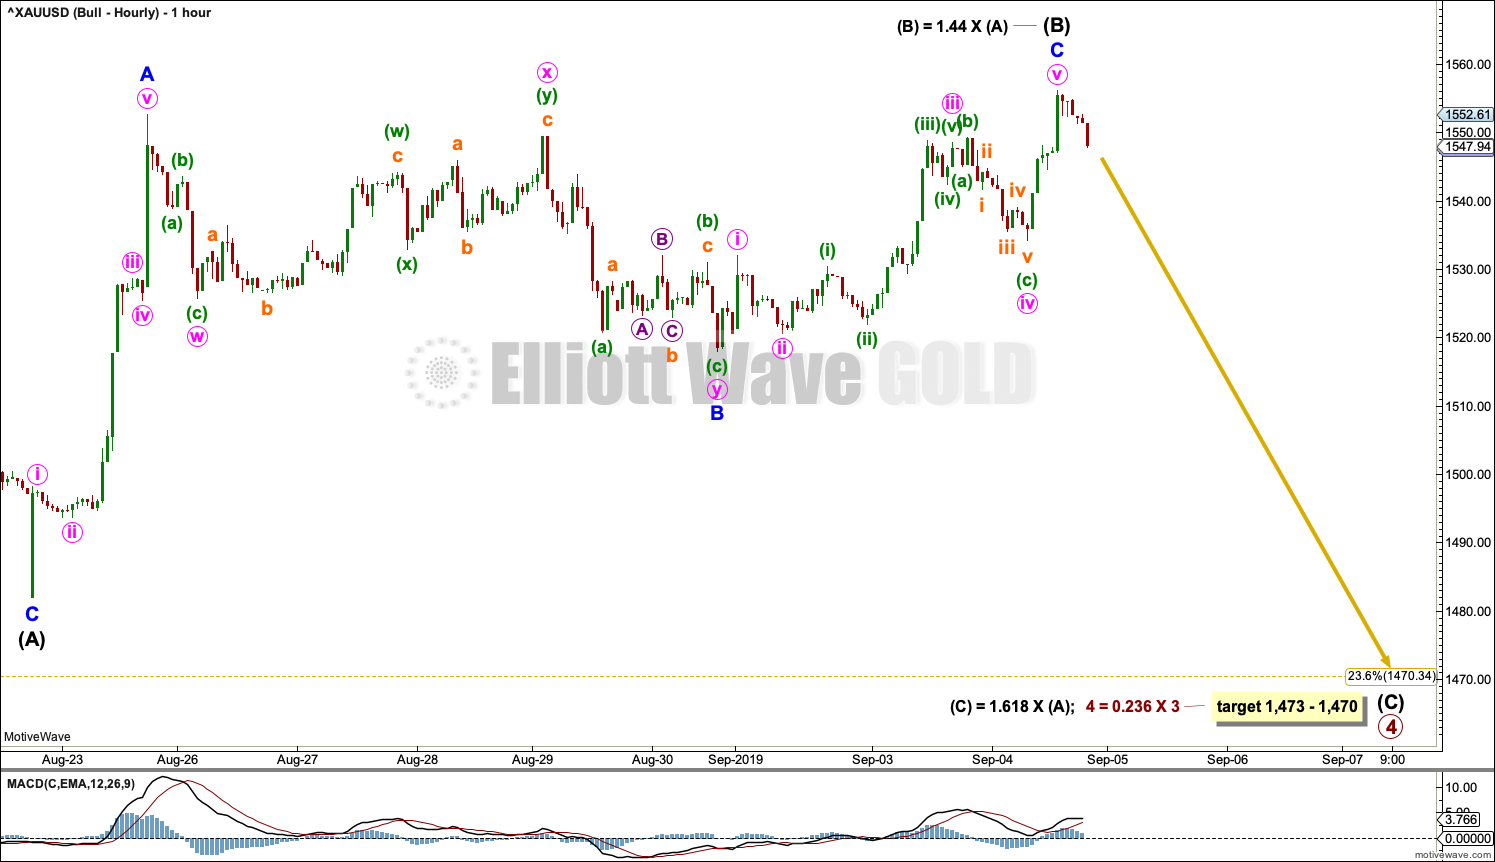
Primary wave 4 may be continuing as an expanded flat, which is a common corrective structure. This would see alternation in structure with the zigzag of primary wave 2.
Primary wave 2 lasted 43 sessions. Primary wave 4 may be expected to be more brief; Gold usually exhibits more brief fourth waves than their counterpart second waves. Primary wave 4 may end in a total Fibonacci 21 or 34 sessions. So far it has lasted 16 sessions.
Primary wave 4 may not move into primary wave 1 price territory below 1,346.45.
Intermediate wave (B) may be continuing higher. There is no Elliott wave rule which states a limit for B waves within flat corrections, so there is no upper invalidation point for this wave count.
B waves should be identifiable by weak volume, momentum or ATR. If intermediate wave (B) is over at today’s high, then it has ended on weak volume, exhibits bearish divergence between price and On Balance Volume, and exhibits quadruple bearish divergence between price and RSI. Technical analysis supports the possibility that this high may be the end of a B wave.
HOURLY CHART
Click chart to enlarge.
Within expanded flat corrections, wave B is commonly from 1 to 1.38 times the length of wave A. For this example, intermediate wave (B) is now just beyond the most common length at 1.44 times the length of intermediate wave (A). This is acceptable.
A target is now calculated for intermediate wave (C).
TECHNICAL ANALYSIS
WEEKLY CHART
Click chart to enlarge. Chart courtesy of StockCharts.com.
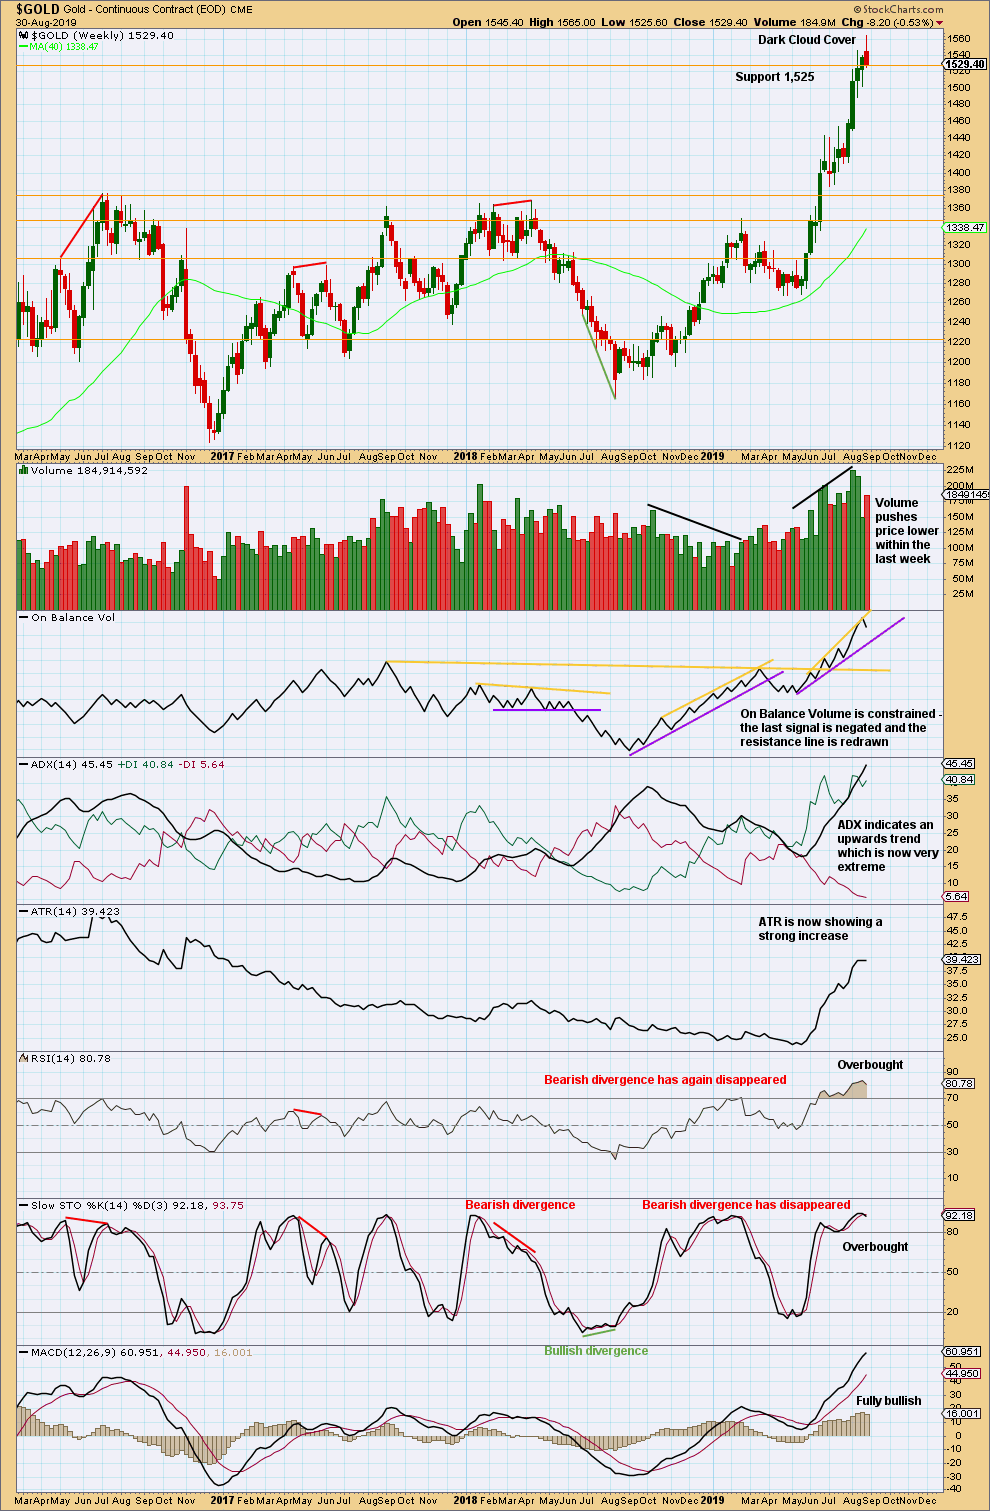
When trends reach very extreme, candlestick reversal patterns should be given weight. The Dark Cloud Cover bearish reversal pattern is given more bearish weight from the long upper wick.
The risk of a major high and a trend change or a large time consuming consolidation developing here is very high. These two scenarios effectively follow the main bearish wave count (major trend change) or bullish wave count (a large time consuming consolidation).
DAILY CHART
Click chart to enlarge. Chart courtesy of StockCharts.com.
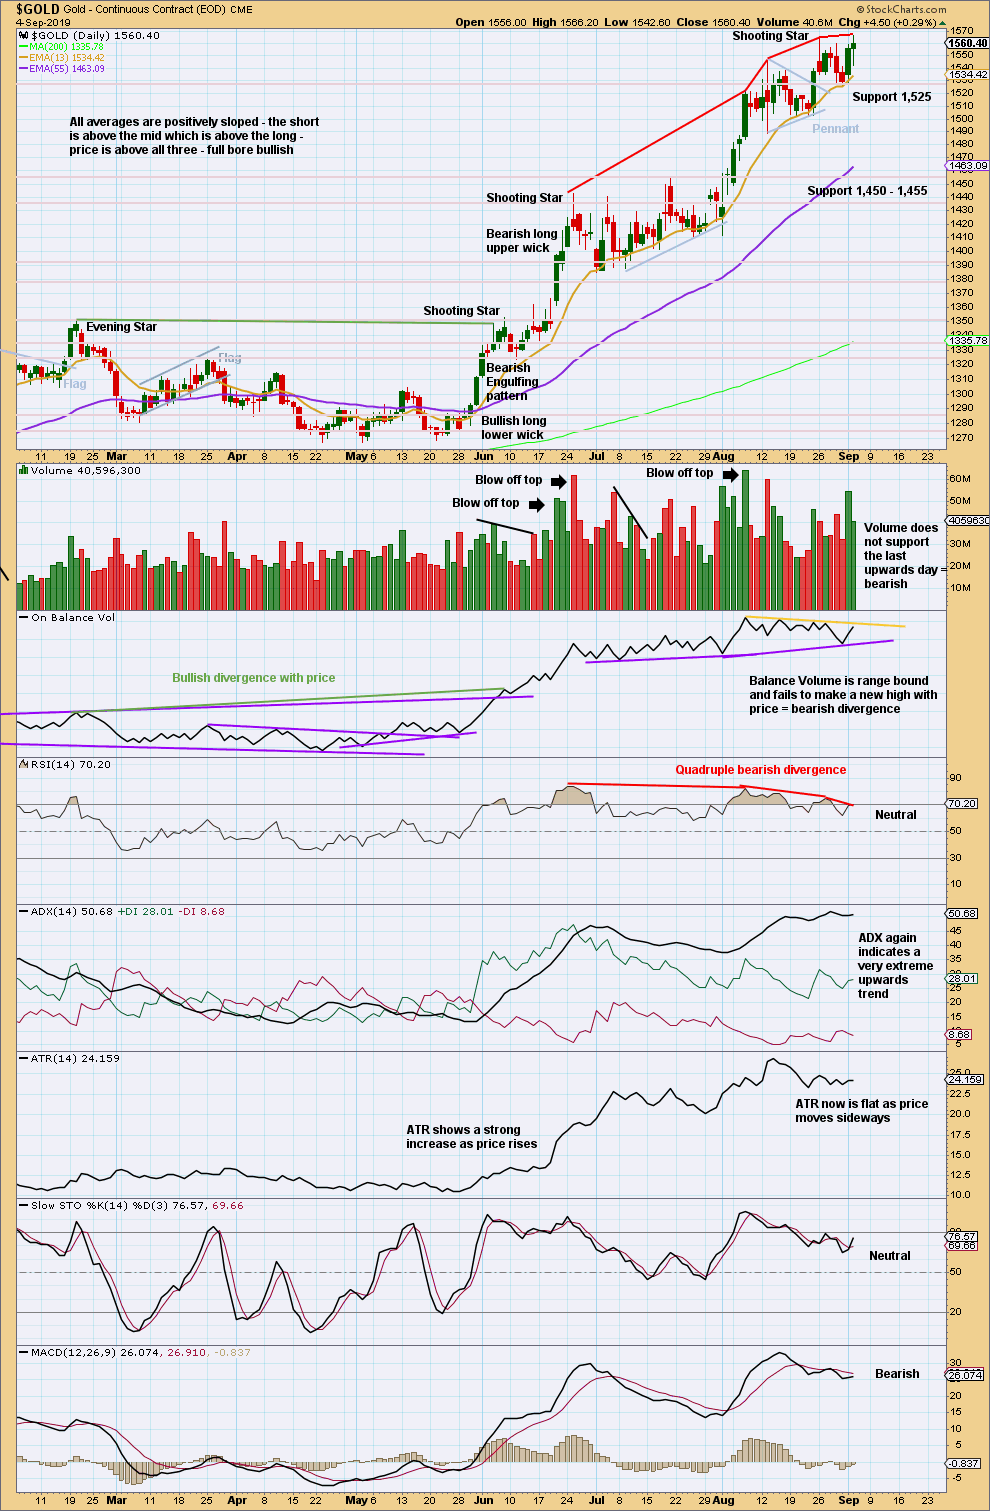
This last session has failed to close above resistance at 1,565 and volume today does not support upwards movement. There is no upwards breakout. Price remains range bound with resistance at 1,565 and support about 1,540.
The upwards trend remains very extreme and indicators exhibit multiple bearish divergence with price. While price can continue higher in these conditions, this is a very strong warning that a major trend change may be here now or arrive at any time soon.
GDX WEEKLY CHART
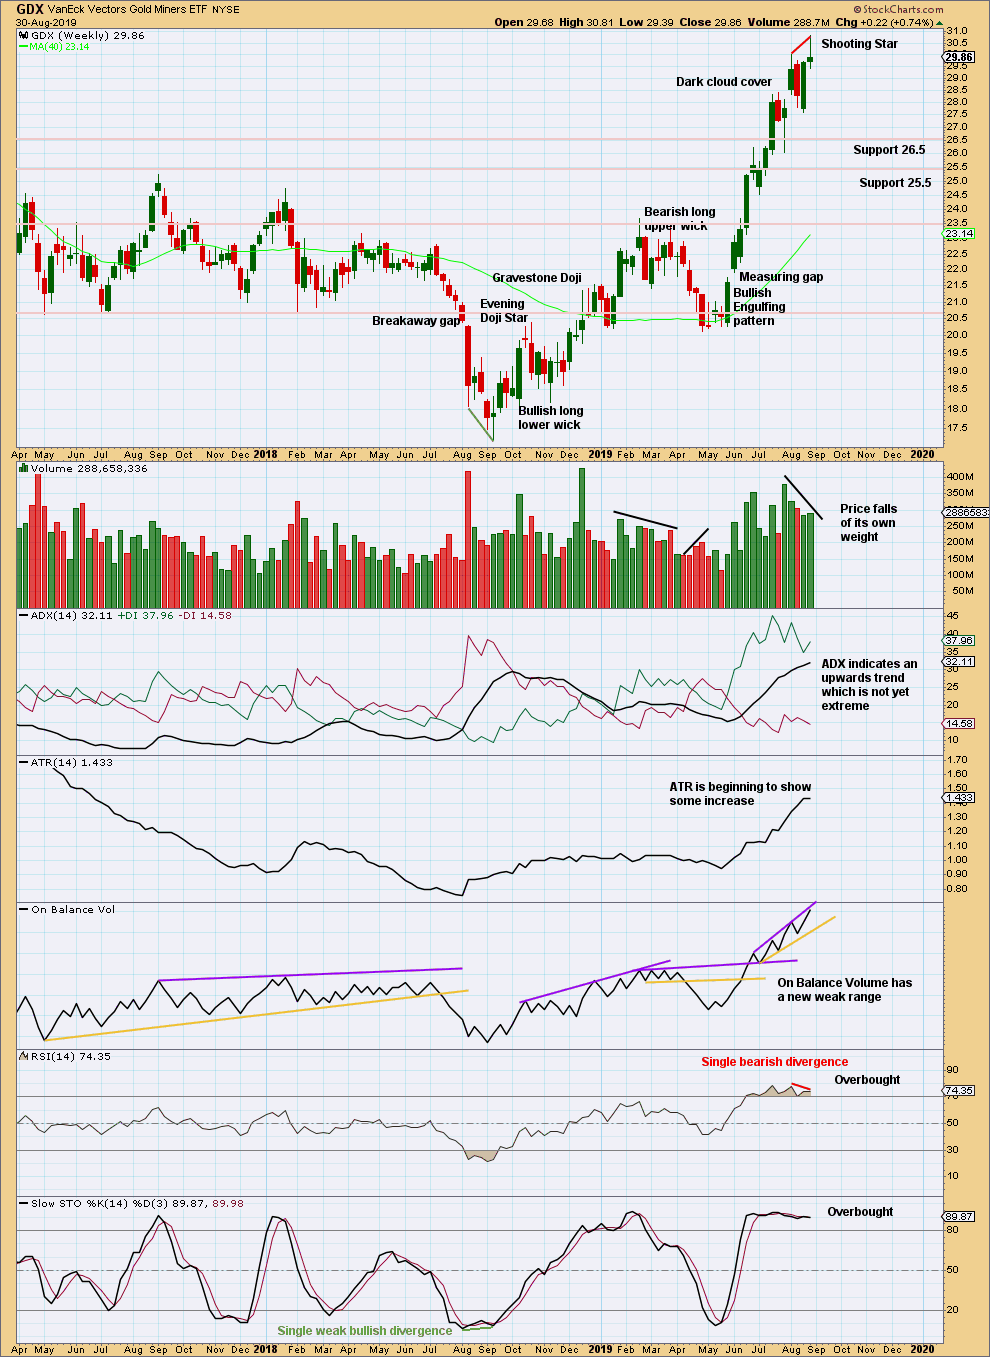
Click chart to enlarge. Chart courtesy of StockCharts.com.
This week closes as a fairly strong bearish candlestick, a Shooting Star with a long upper wick. Look out for either a trend change to either down or sideways here.
GDX DAILY CHART
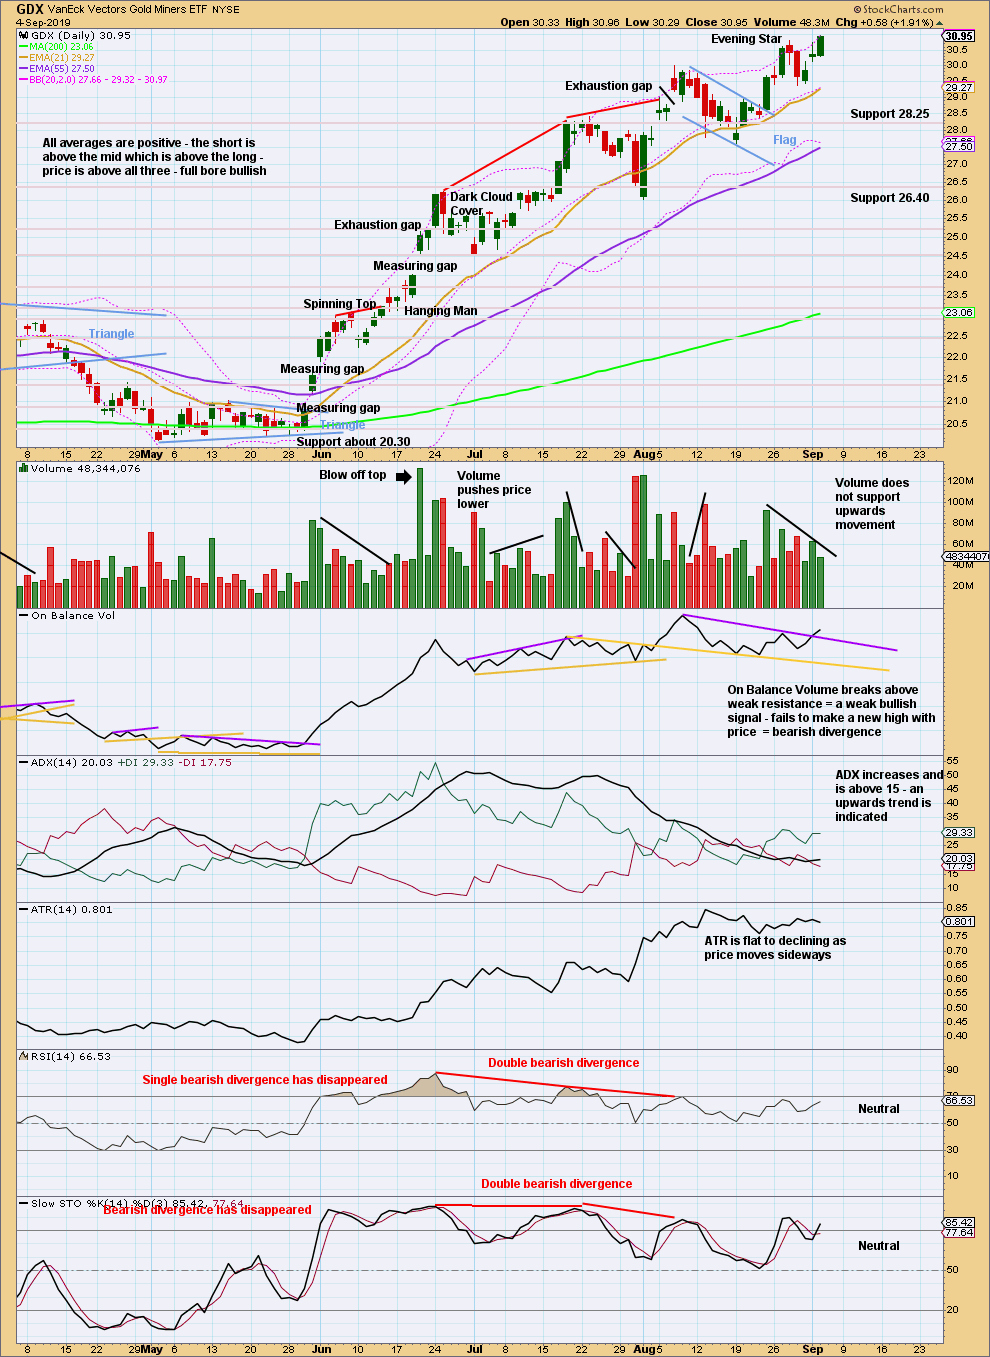
Click chart to enlarge. Chart courtesy of StockCharts.com.
The target using the flag pole is at 32.76.
Unlike Gold, GDX today has an upwards breakout. But this breakout does not have support from volume, so it is suspicious.
Published @ 09:20 p.m. EST.
—
Careful risk management protects your trading account(s).
Follow my two Golden Rules:
1. Always trade with stops.
2. Risk only 1-5% of equity on any one trade.
—
New updates to this analysis are in bold.
Bull hourly chart updated
Thank you
Any chance of an updated hourly silver chart – we’ve gone quite a bit higher than anticipated.
Gold to silver is a credible indicator of credit cycle in the market. When it rises nominal price of gold and silver decline. and when it declines nominal price of gold and silver trends up. In 100 years history of this ratio bullion prices have followed this trend and has never failed.
A review of monthly chart indicates GSR has broken down below 80 a critical level forecasting upward pressure on the gold and silver prices.
Last 100 years only few times GSR has been this high near 93 to 100 level.
With the breakdown from consolidation at high level GSR is poised to go down to its normal trading range 60 to 43.
It appears that GSR is forecasting the bullish count may prevail for gold.
Having invalidation of bearish count at 1923 both counts will continue to haunt us till that time.
IMO.
Also Weekly chart of GSR .
Note when GSR was at 30 gold and silver prices were at their high $1923 and $49.
Here on Florida coast during Hurricane surfers were trying to surf . Technically these surfs are different than normal waves for surfing? Is that correct?
Not being surfer I think these waves are part of ocean surge rather than normal surf wave. for surfing.
Probably a wind swell, so a shorter period between waves and more challenging to surf in those conditions.
But AFAIK in Florida there is rarely big swell, so I bet the surfers there were stoked to see a decent size!
As long as there’s swell and the wind is offshore, it’s all good to surf.
Ocean surge is I think different from wind generated swell. A wind swell relatively close to shore will have a short period. When it was generated further out to sea it becomes a ground swell, with a longer period. That’s better for surfing.
Ocean surge is I think more like… a low forming pressure on the ocean surface which forces the water there to move out and increases high tide marks. Kinda like imagine a person sitting into a bathtub of water, it forces the level of the water up.
If I’ve got any of this wrong, I bet Google knows more than me.
Here in Coromandel where I now live in New Zealand, we’ve had no surf now for months! It’s really sad, and a horrible challenge to keep fit and ready for when it comes. I feel a road trip coming on…
Hi Lara: ” a false upward breakout to about 1,472 ”
I think you meant 1572 target as shown on hourly chart??
Great work. Love your analysis.
Thanks Papudi, yes that’s a typo.