
A small range inside day leaves both Elliott wave counts the same today.
Summary: For the short term, while price remains below 1,503.29, it is safest to assume price will keep falling. If price makes a new high by any amount at any time frame above 1,503.29, then expect a bounce to about 1,529 before the resumption of the downwards trend.
The bearish Elliott wave count expects a new downwards trend to last one to several years has just begun. Confidence in this view may be had if price makes a new low by any amount at any time frame below 1,346.45.
The bullish Elliott wave count expects a primary degree fourth wave is unfolding, forming a large consolidation to in possibly one more session. The eventual area of support for the consolidation is expected to be about 1,470.
Grand SuperCycle analysis is here.
Monthly charts were last published here with video here.
BEARISH ELLIOTT WAVE COUNT
WEEKLY CHART
Click chart to enlarge.
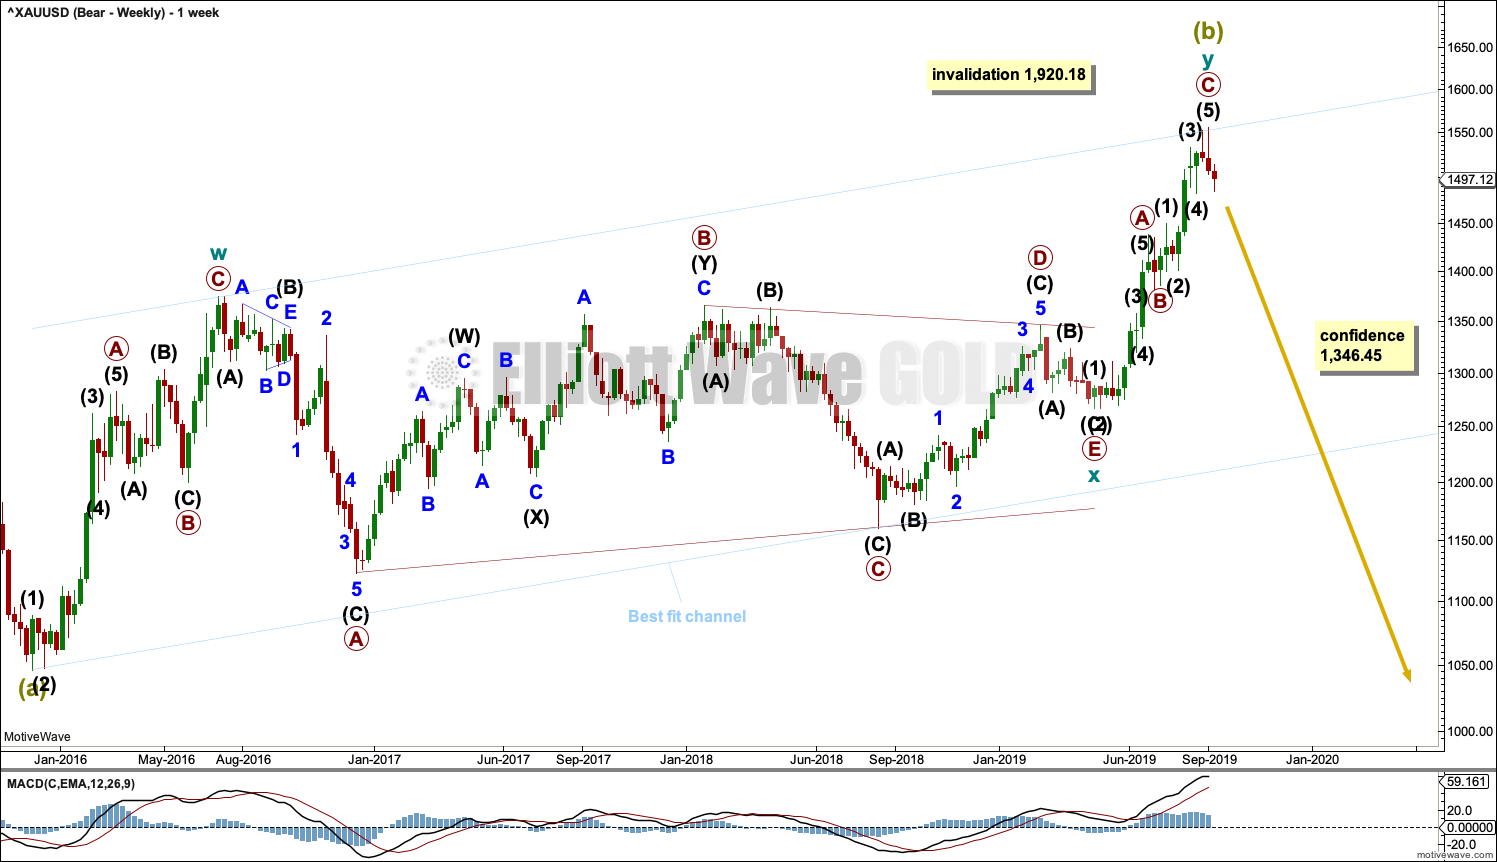
It is possible that Super Cycle wave (b) is completing as a double zigzag.
The first zigzag in the double is labelled cycle wave w. The double is joined by a three in the opposite direction, a triangle labelled cycle wave x. The second zigzag in the double is labelled cycle wave y.
Cycle wave y may now be a complete zigzag.
The purpose of the second zigzag in a double is to deepen the correction. Cycle wave y has achieved this purpose.
A new low below 1,346.45 would add strong confidence to this wave count. At that stage, the bullish Elliott wave count would be invalidated.
A wide best fit channel is added in light blue. This channel contains all of Super Cycle wave (b) and may currently provide strong resistance. Copy this channel over to daily charts.
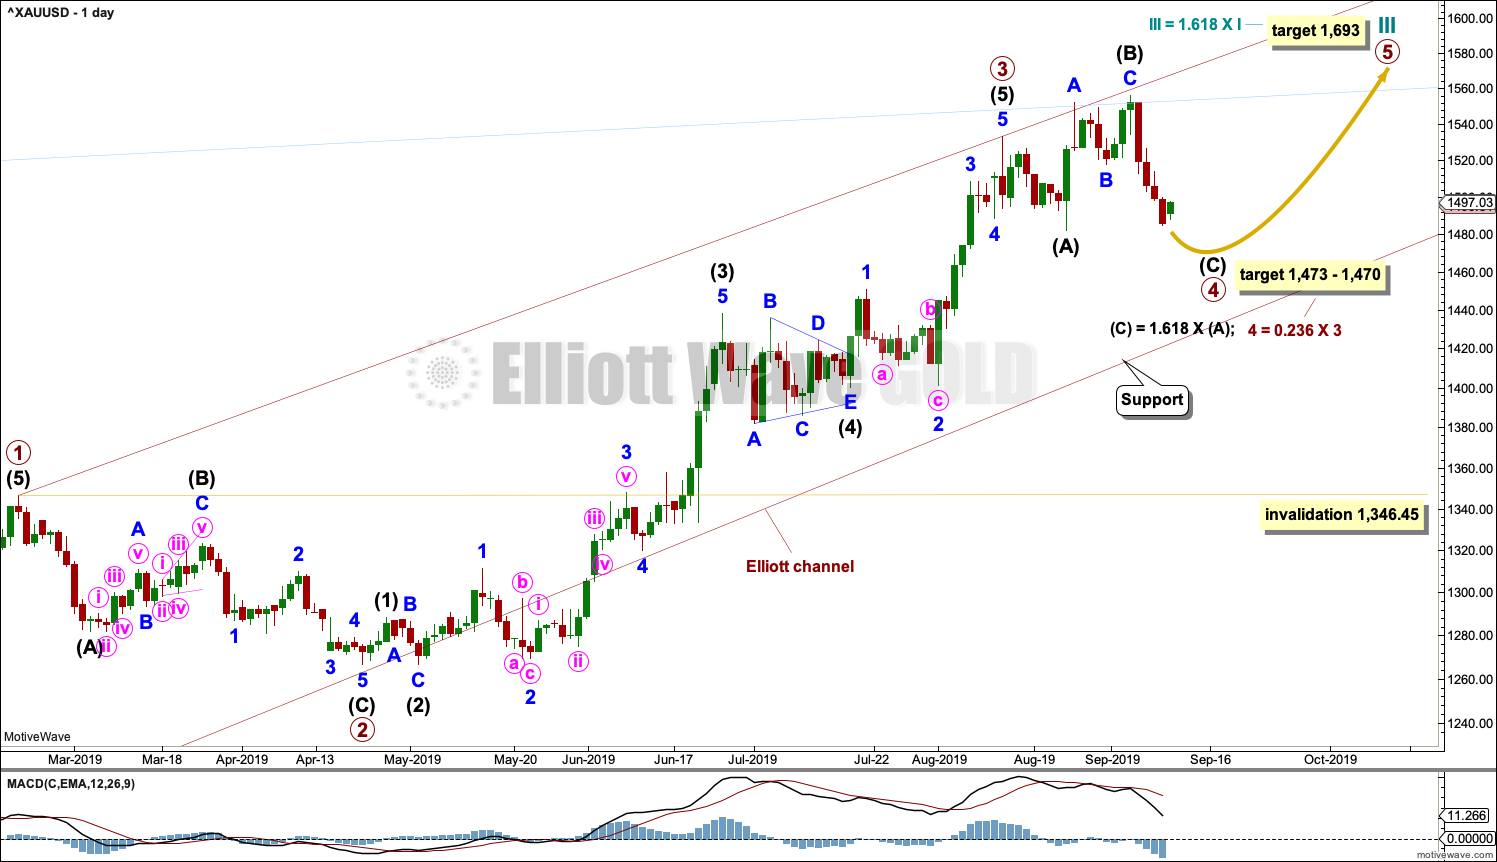
DAILY CHART
Click chart to enlarge.
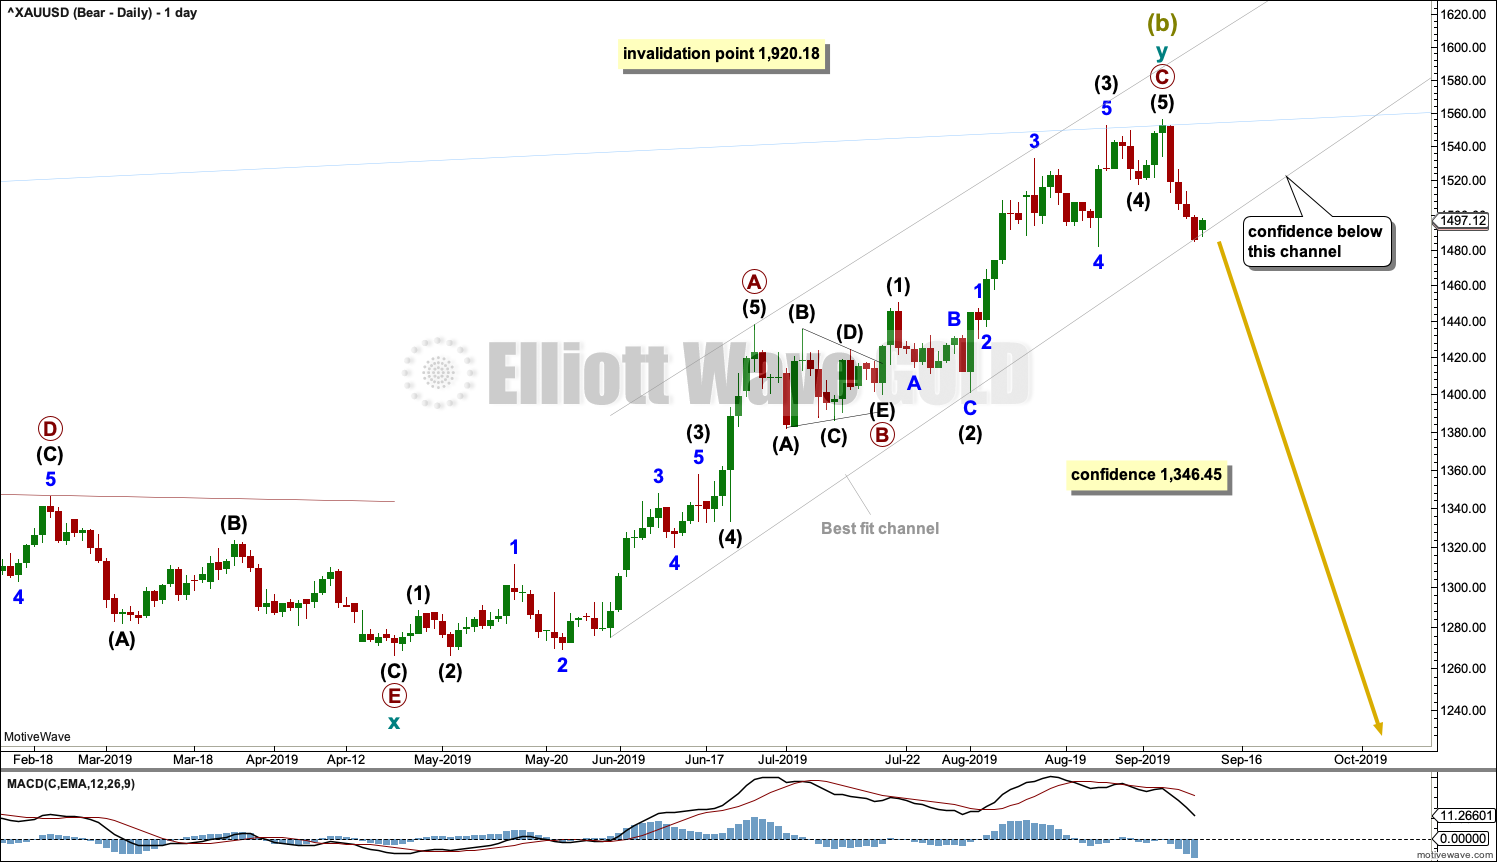
Within cycle wave y, the triangle that ended on the 17th of July may have been primary wave B. Primary wave C may have begun there. Primary wave C must subdivide as a five wave structure; it could be a complete impulse.
Within cycle wave y, there is no Fibonacci Ratio between primary waves A and C.
A breach of the best fit trend channel by downwards movement would be a very strong indication of a major trend change.
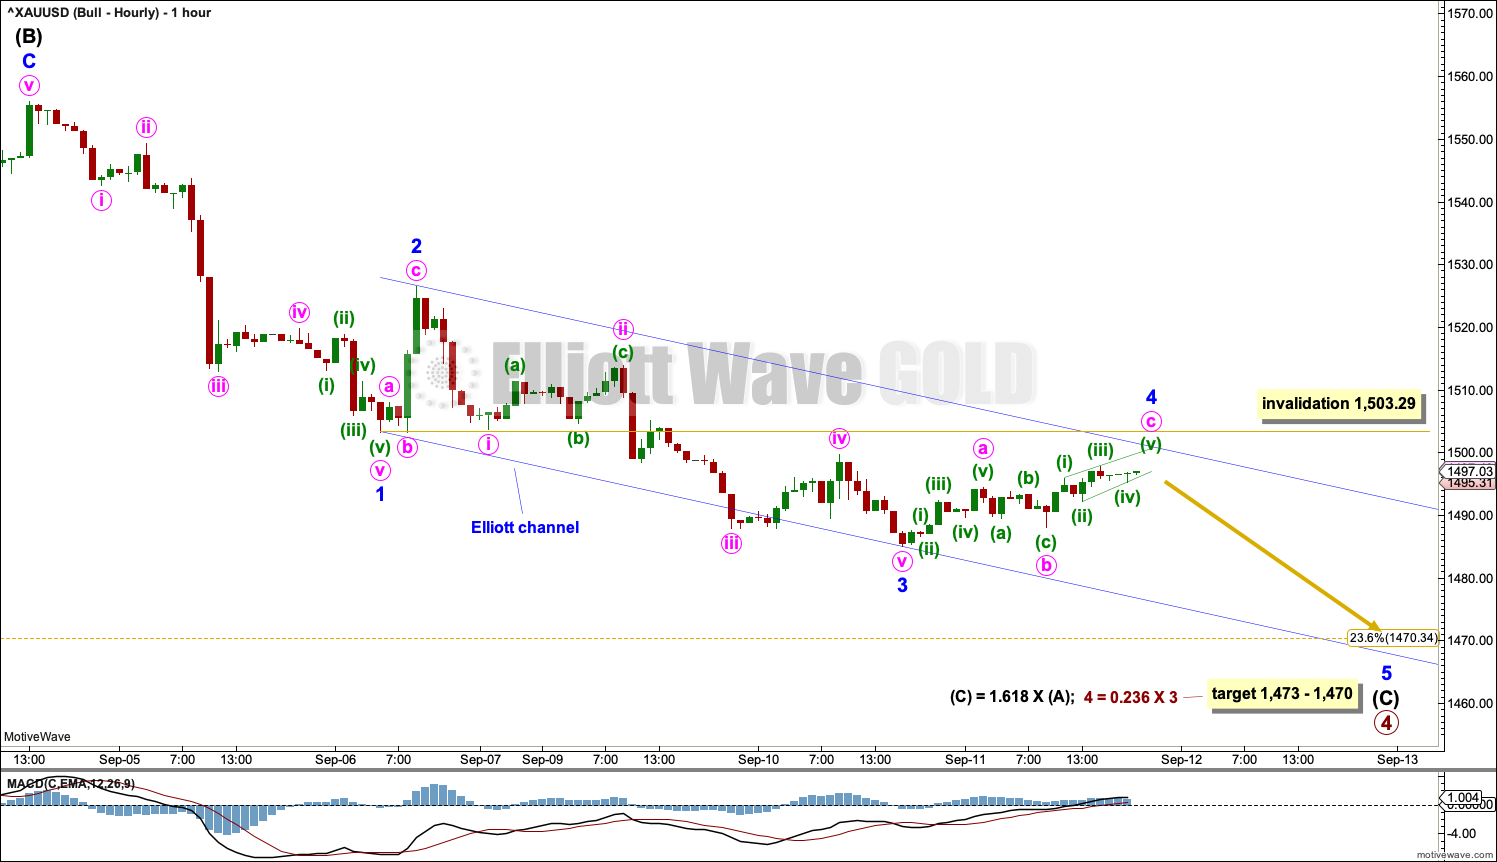
HOURLY CHART
Click chart to enlarge.
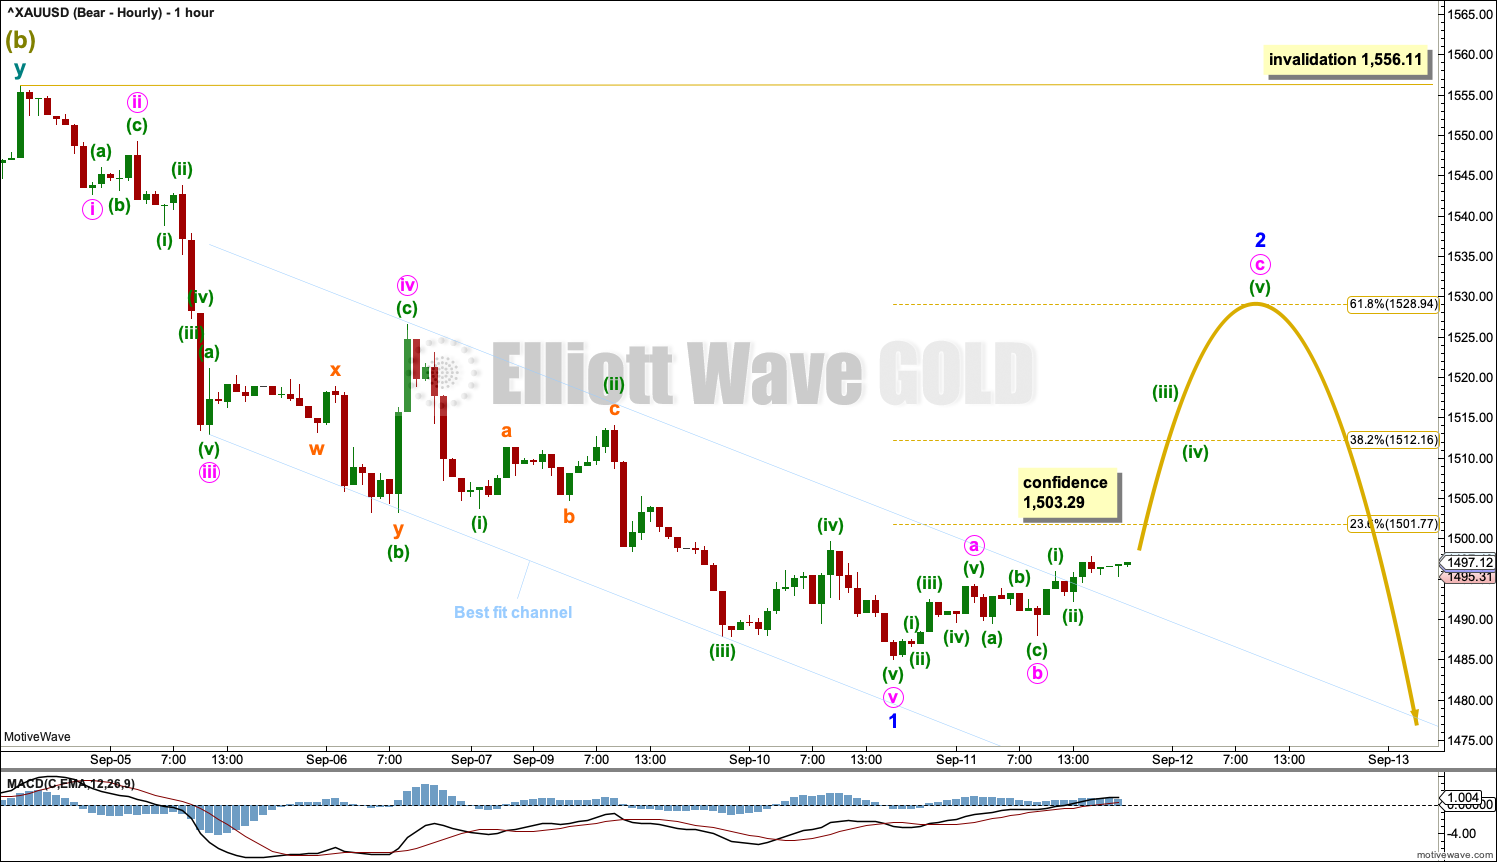
At this stage, there is now more than one way to label downwards movement from the high as an impulse. This chart considers it may be complete. The hourly chart for the bullish wave count considers it may be incomplete. Both ideas work for both bull and bear counts in the same way.
Minor wave 1 may be a complete impulse.
Fibonacci ratios within minor wave 1 are: minute wave iii is 1.23 longer than 2.618 the length of minute wave i, and minute wave v exhibits no Fibonacci Ratio to either of minute waves i or iii.
If minor wave 1 is over, then minor wave 2 may begin. The most likely target for minor wave 2 would be the 0.618 Fibonacci Ratio of minor wave 1. It may however be deeper than that. The first second wave correction within a new trend for Gold tends to be very deep.
A breach of the best fit channel indicates that this labelling for short-term movement may be correct.
Minor wave 2 may not move beyond the start of minor wave 1 above 1,556.11.
BULLISH ELLIOTT WAVE COUNT
WEEKLY CHART
Click chart to enlarge.
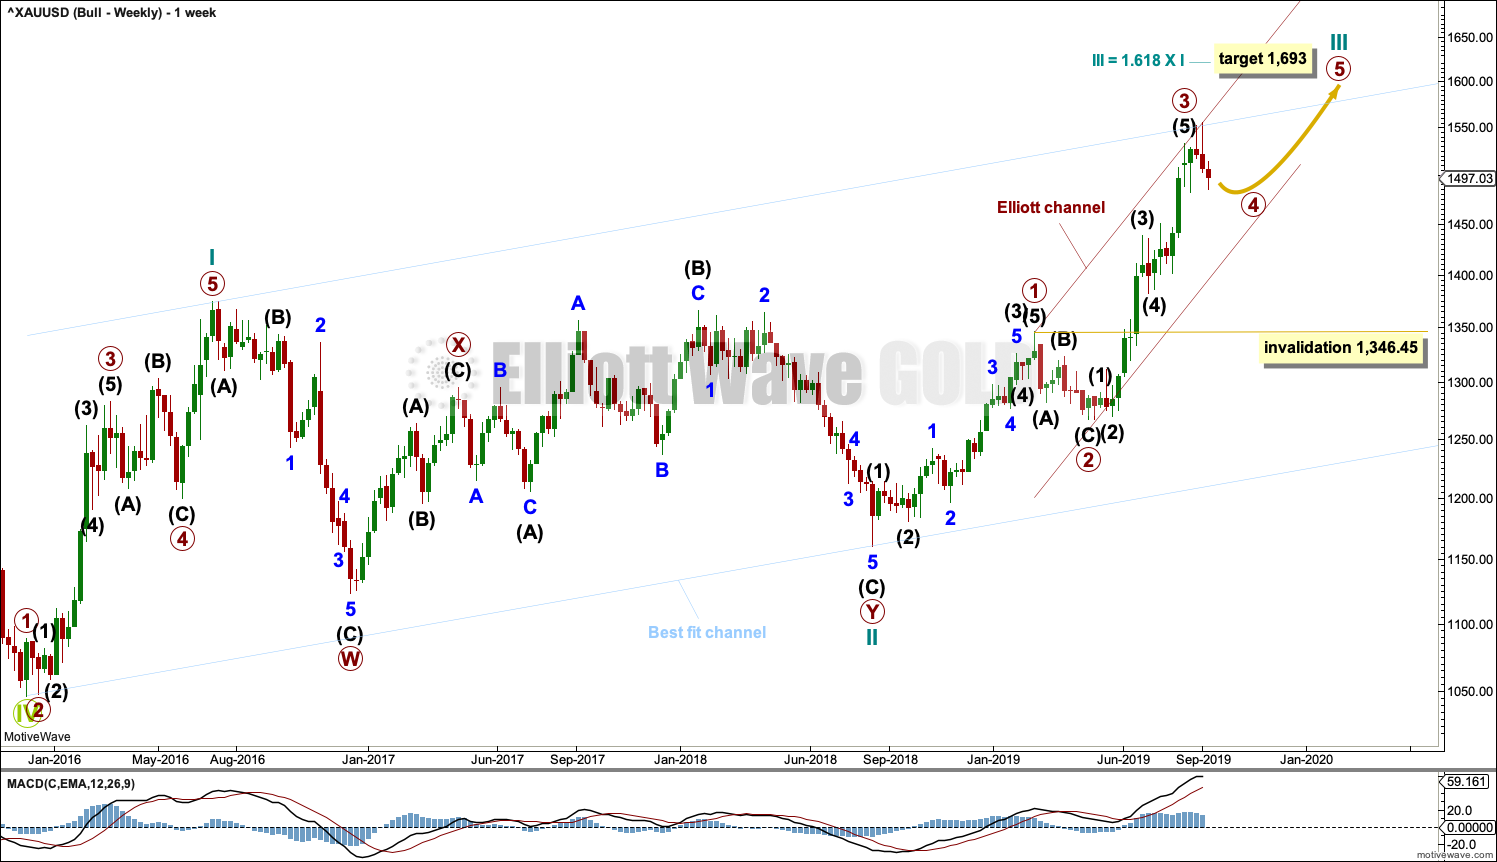
This wave count sees the the bear market complete at the last major low for Gold in November 2015.
If Gold is in a new bull market, then it should begin with a five wave structure upwards on the weekly chart. However, the biggest problem with this wave count is the structure labelled cycle wave I because this wave count must see it as a five wave structure, but it looks more like a three wave structure.
Commodities often exhibit swift strong fifth waves that force the fourth wave corrections coming just prior and just after to be more brief and shallow than their counterpart second waves. It is unusual for a commodity to exhibit a quick second wave and a more time consuming fourth wave, and this is how cycle wave I is labelled. This wave count still suffers from this very substantial problem, and for this reason the bearish wave count is still considered because it has a better fit in terms of Elliott wave structure.
Cycle wave II subdivides well as a double combination: zigzag – X – expanded flat.
Cycle wave III may have begun. Within cycle wave III, primary waves 1 and 2 may now be complete. Primary wave 3 has now moved above the end of primary wave 1 meeting a core Elliott wave rule. It has now moved far enough to allow room for primary wave 4 to unfold and remain above primary wave 1 price territory. Primary wave 4 may not move into primary wave 1 price territory below 1,346.45.
Cycle wave III so far for this wave count would have been underway now for 56 weeks. It is beginning to exhibit some support from volume and increasing ATR. This wave count now has some support from classic technical analysis.
The channel drawn about cycle wave III is an Elliott channel. Primary wave 4 may find support about the lower edge if it is time consuming enough.
Add the wide best fit channel to weekly and daily charts.
DAILY CHART
Click chart to enlarge.
Primary wave 4 may be continuing as an expanded flat, which is a common corrective structure. This would see alternation in structure with the zigzag of primary wave 2.
Primary wave 2 lasted 43 sessions. Primary wave 4 may be expected to be more brief; Gold usually exhibits more brief fourth waves than their counterpart second waves. Primary wave 4 may end in a total Fibonacci 21 or 34 sessions. So far it has lasted 21 sessions. Primary wave 4 may now continue for a further 13 sessions to total a Fibonacci 34. Within primary wave 4, it would be extremely likely for intermediate wave (C) to move at least slightly below the end of intermediate wave (A) at 1,481.91 to avoid a truncation and a very rare running flat. It would be most likely that primary wave 4 is incomplete because there is not yet a new low below 1,481.91.
Primary wave 4 may not move into primary wave 1 price territory below 1,346.45.
HOURLY CHART
Click chart to enlarge.
Both hourly charts see a five wave impulse unfolding lower. This chart considers the possibility that it may be incomplete.
The channel drawn here is different. This channel is drawn using Elliott’s technique for this labelling. Minor wave 4 may find resistance about the upper edge.
Minor wave 4 may not move into minor wave 1 price territory above 1,503.29.
As soon as price makes a new low below the end of intermediate wave (A) at 1,481.91, then intermediate wave (C) would have avoided a truncation and a very rare running flat. At that stage, intermediate wave (C) may end at any time. It may also continue lower and last longer.
TECHNICAL ANALYSIS
WEEKLY CHART
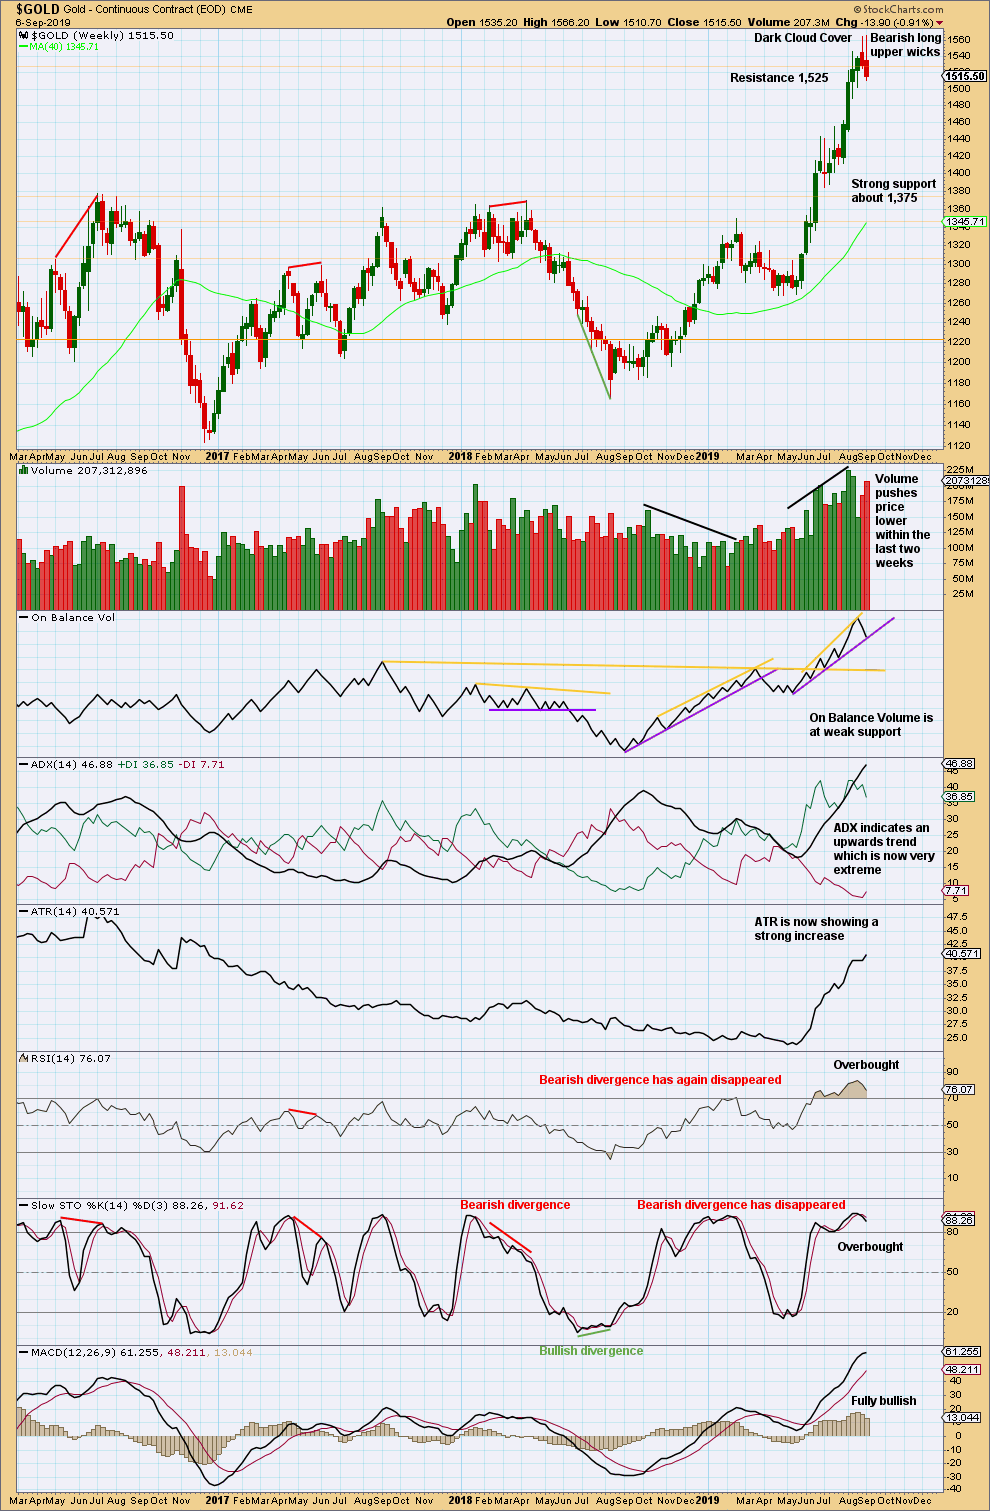
Click chart to enlarge. Chart courtesy of StockCharts.com.
When trends reach very extreme, candlestick reversal patterns should be given weight. The Dark Cloud Cover bearish reversal pattern is given more bearish weight from the long upper wick.
The risk of a major high and a trend change or a large time consuming consolidation developing here is very high. These two scenarios effectively follow the main bearish wave count (major trend change) or bullish wave count (a large time consuming consolidation).
Despite a very slight new high last week, the weekly candlestick is bearish and has support from volume pushing price lower.
DAILY CHART
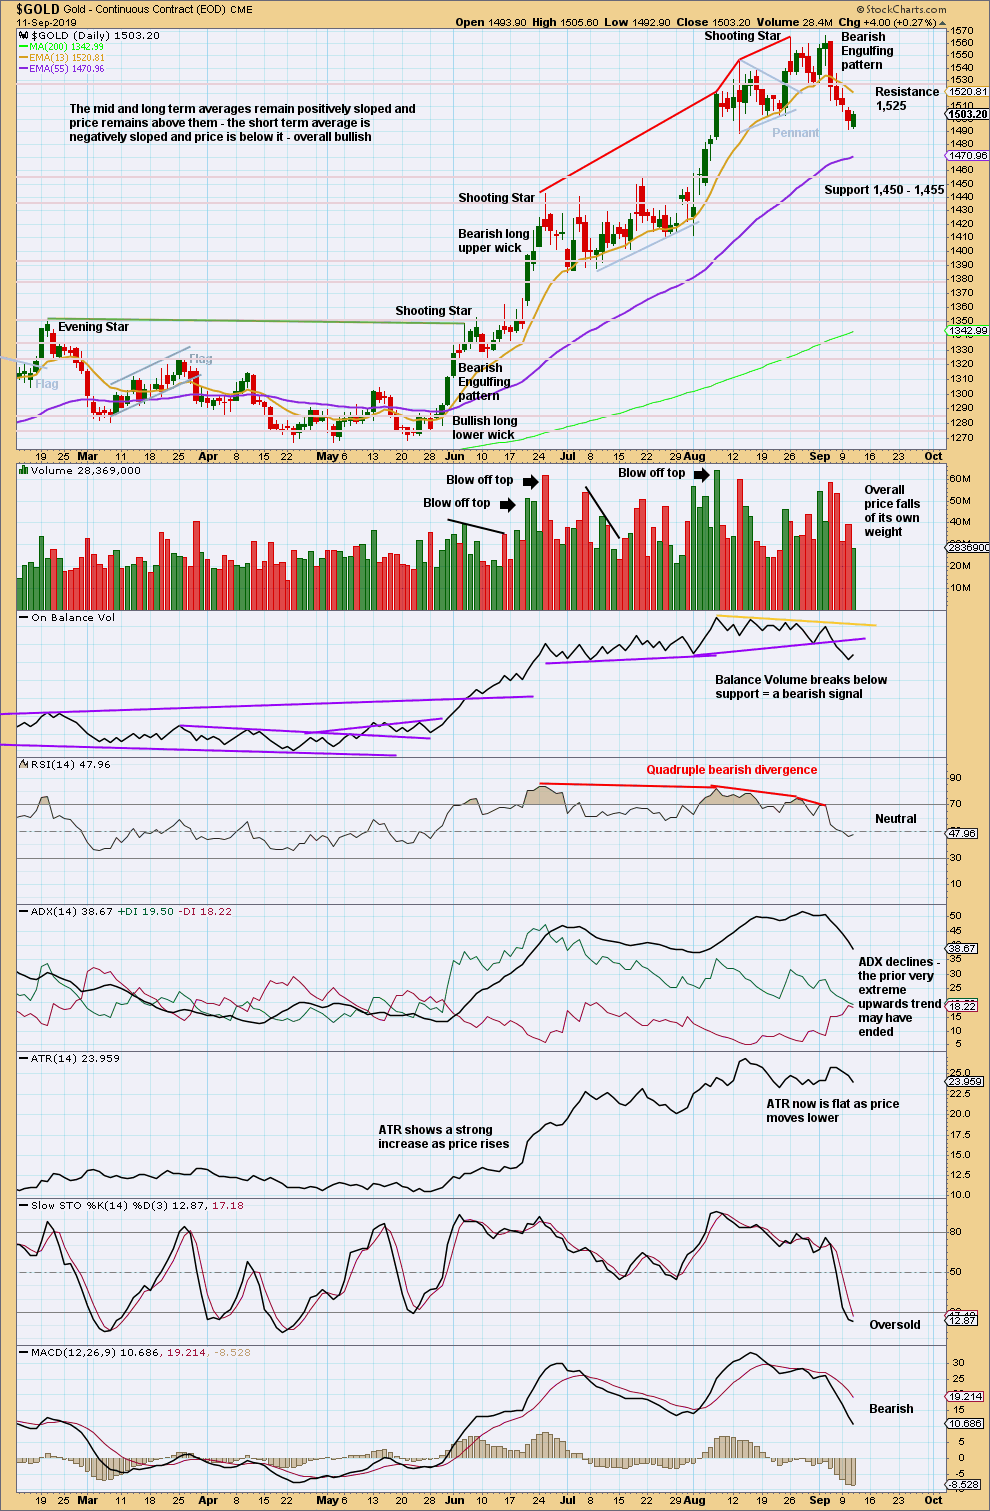
Click chart to enlarge. Chart courtesy of StockCharts.com.
The Bearish Engulfing pattern is very strong. It fully engulfs the real bodies of the prior seven daily candlesticks. Coming after an upwards trend reached very extreme and indicators reached overbought then exhibited multiple bearish divergence with price, the probability here of either a major trend change to a new downwards trend, or a major consolidation to last weeks or months, is very high indeed.
The last swing low is at 1,488.90. A new low below this point would confirm a trend change.
The last session closes as a small inside day, which closed green.
Upwards movement within the session lacks support from volume. So far this looks like a small pause within a downwards swing or new downwards trend.
GDX WEEKLY CHART
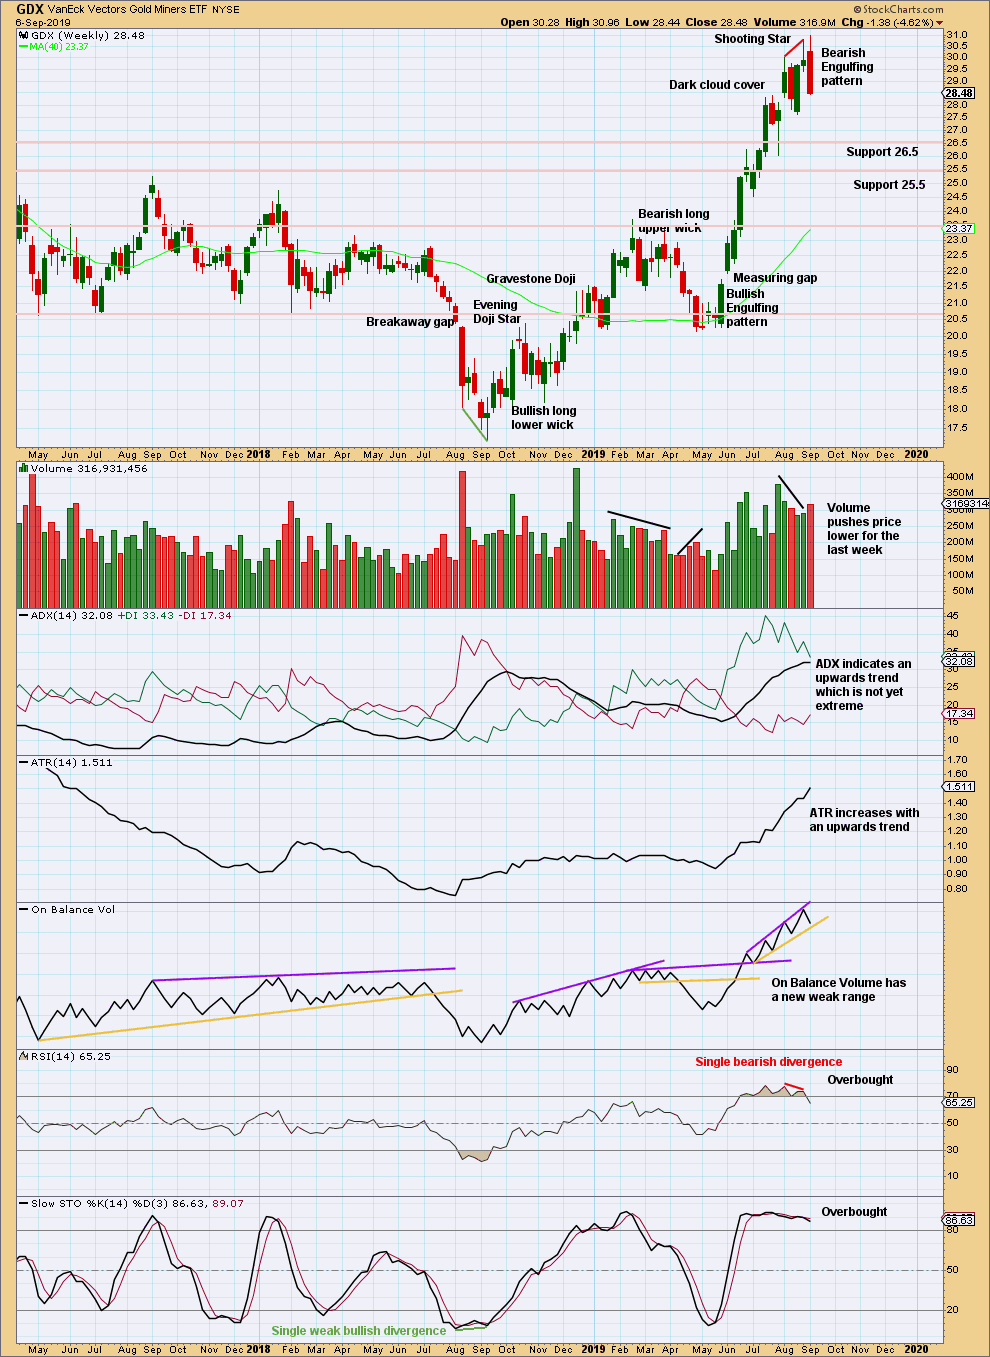
Click chart to enlarge. Chart courtesy of StockCharts.com.
Look out for either a trend change to either down or sideways here.
GDX DAILY CHART
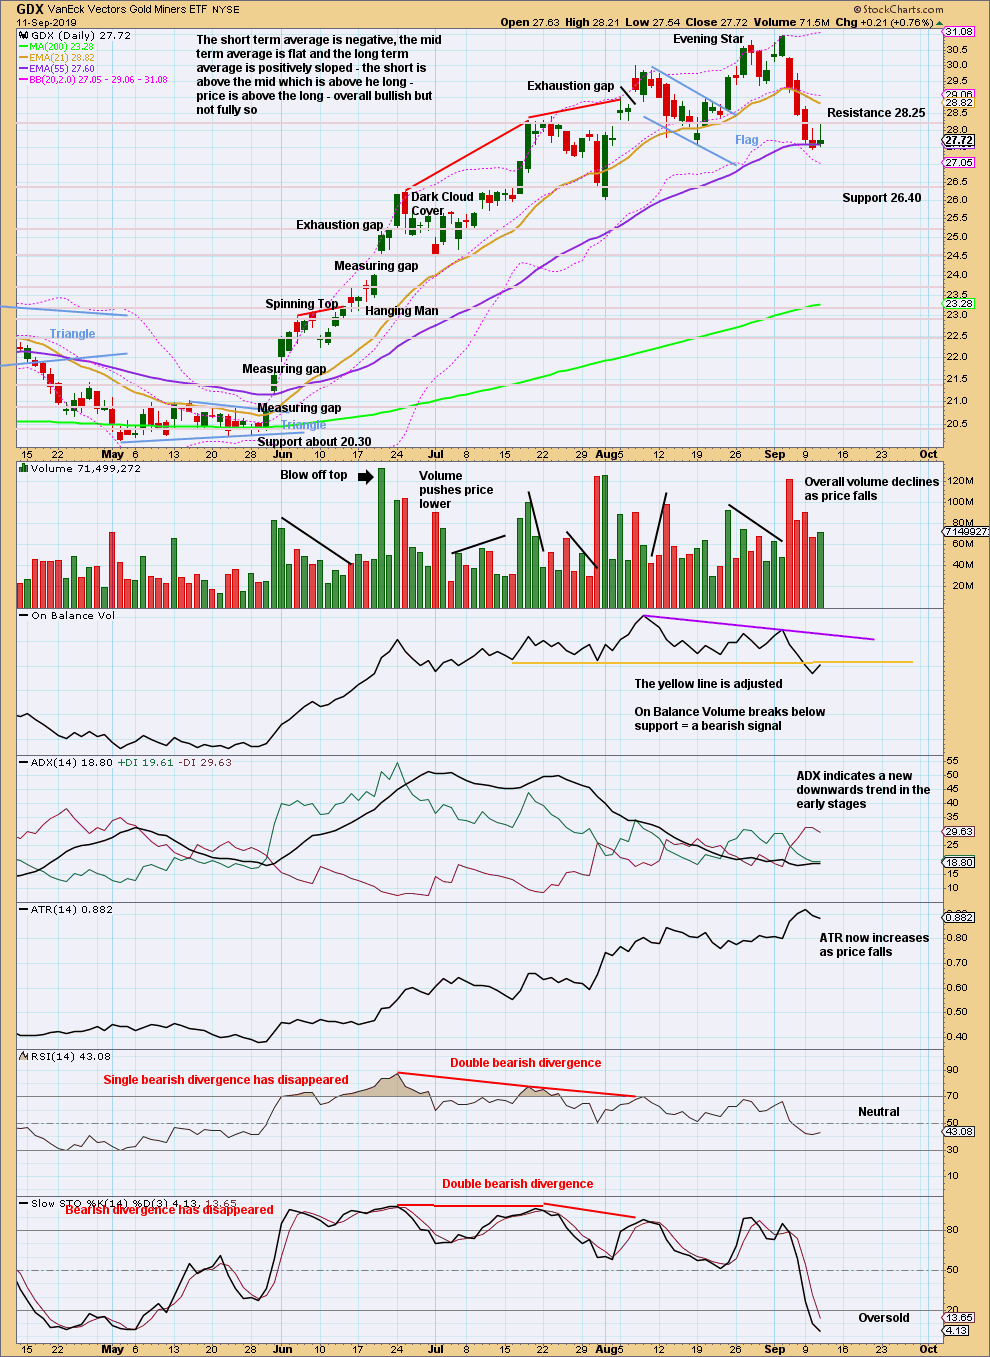
Click chart to enlarge. Chart courtesy of StockCharts.com.
A new low below the prior swing low at 27.61 today confirms a trend change. This comes with a bearish signal from On Balance Volume. Expect price to keep falling, interrupted at support levels, until proven otherwise. ADX agrees with a downwards trend now.
Published @ 08:20 p.m. EST.
—
Careful risk management protects your trading account(s).
Follow my two Golden Rules:
1. Always trade with stops.
2. Risk only 1-5% of equity on any one trade.
—
New updates to this analysis are in bold.
Updated hourly chart
The breakout seems to be fading. I wonder if it will have a second life.
Hi Lara,
Last time Grand Super Cycle wave analysis was updated was on July 7th 2016. Do you think it needs to be updated in light of a strong break out above $1377 price?
To me it appears it does not require any updates as far as targets going forward.
I don’t think it needs updating until Grand Super Cycle IV is complete.
It’s barely going to change if I updated it prior to that.
Breach !!!
So, we are expecting a leg higher before the decline.
If assume if silver now makes a blow off top towards 21 we could well start the bear running.
If not, where do we see Silver going short term before it’s run up ?
Silver may not make its final run until Gold has primary 1 down complete (bear count) and then makes primary 2 to last months.