
Gold has moved lower for this last week, which was overall what was expected from both Elliott wave counts. The price point which differentiates the bull and bear Elliott wave counts remains the same.
Summary: The situation is still unclear for the short term. The bounce may continue up to about 1,529 before the downwards trend resumes, or price may simply keep falling from here.
The bearish Elliott wave count expects a new downwards trend to last one to several years has begun. Confidence in this view may be had if price makes a new low by any amount at any time frame below 1,346.45.
The bullish Elliott wave count expects a primary degree fourth wave is unfolding, forming a large consolidation to in possibly 11 more sessions. The eventual area of support for the consolidation is expected to be about 1,431.
Grand SuperCycle analysis is here.
Monthly charts were last published here with video here.
BEARISH ELLIOTT WAVE COUNT
WEEKLY CHART
Click chart to enlarge.
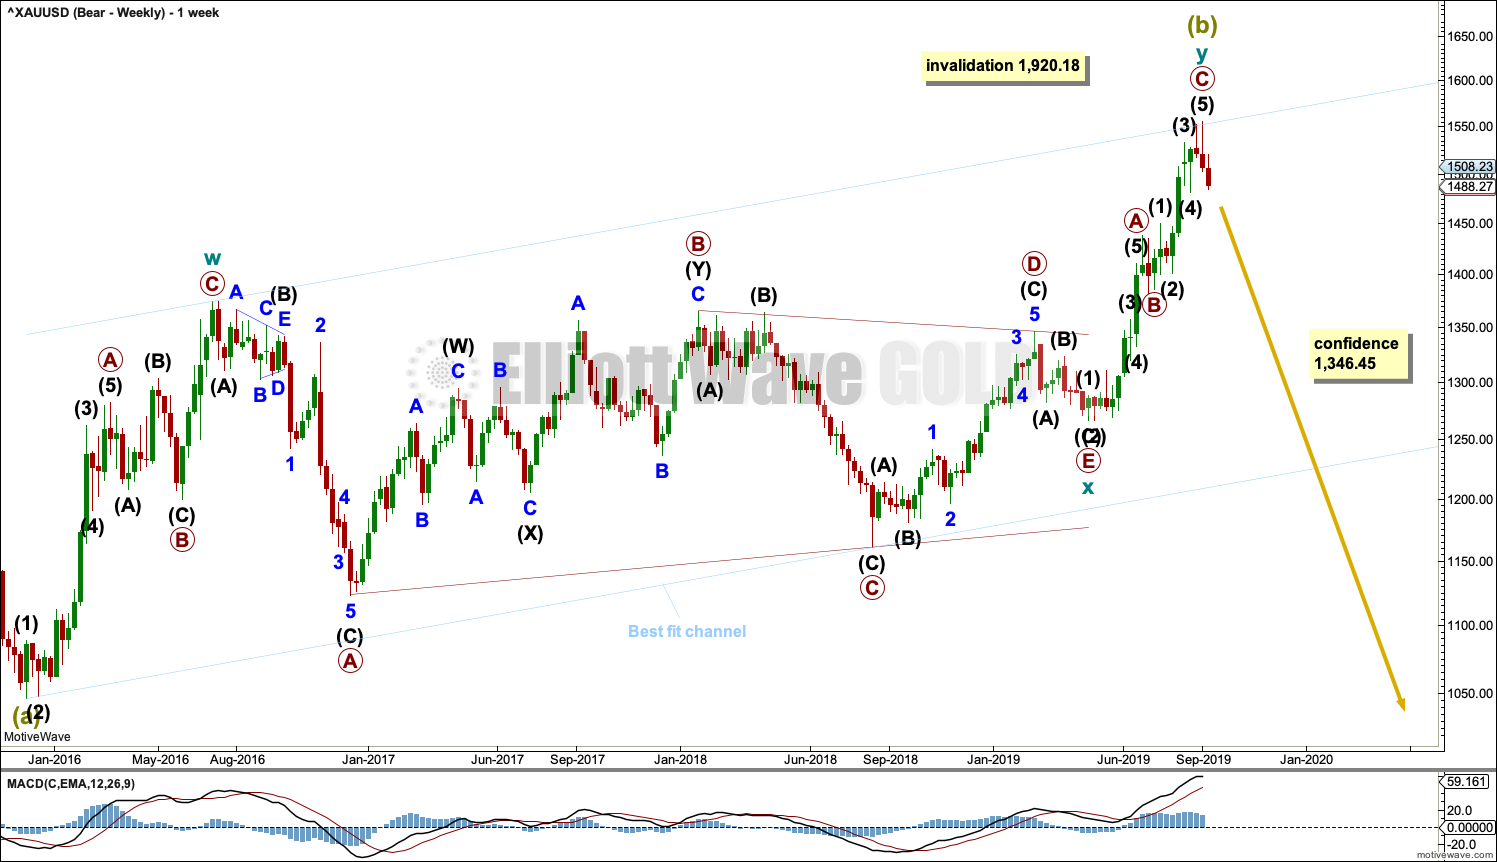
It is possible that Super Cycle wave (b) is complete as a double zigzag.
The first zigzag in the double is labelled cycle wave w. The double is joined by a three in the opposite direction, a triangle labelled cycle wave x. The second zigzag in the double is labelled cycle wave y.
The purpose of the second zigzag in a double is to deepen the correction. Cycle wave y has achieved this purpose.
A new low below 1,346.45 would add strong confidence to this wave count. At that stage, the bullish Elliott wave count would be invalidated.
A wide best fit channel is added in light blue. This channel contains all of Super Cycle wave (b) and may currently provide strong resistance. Copy this channel over to daily charts.
DAILY CHART
Click chart to enlarge.
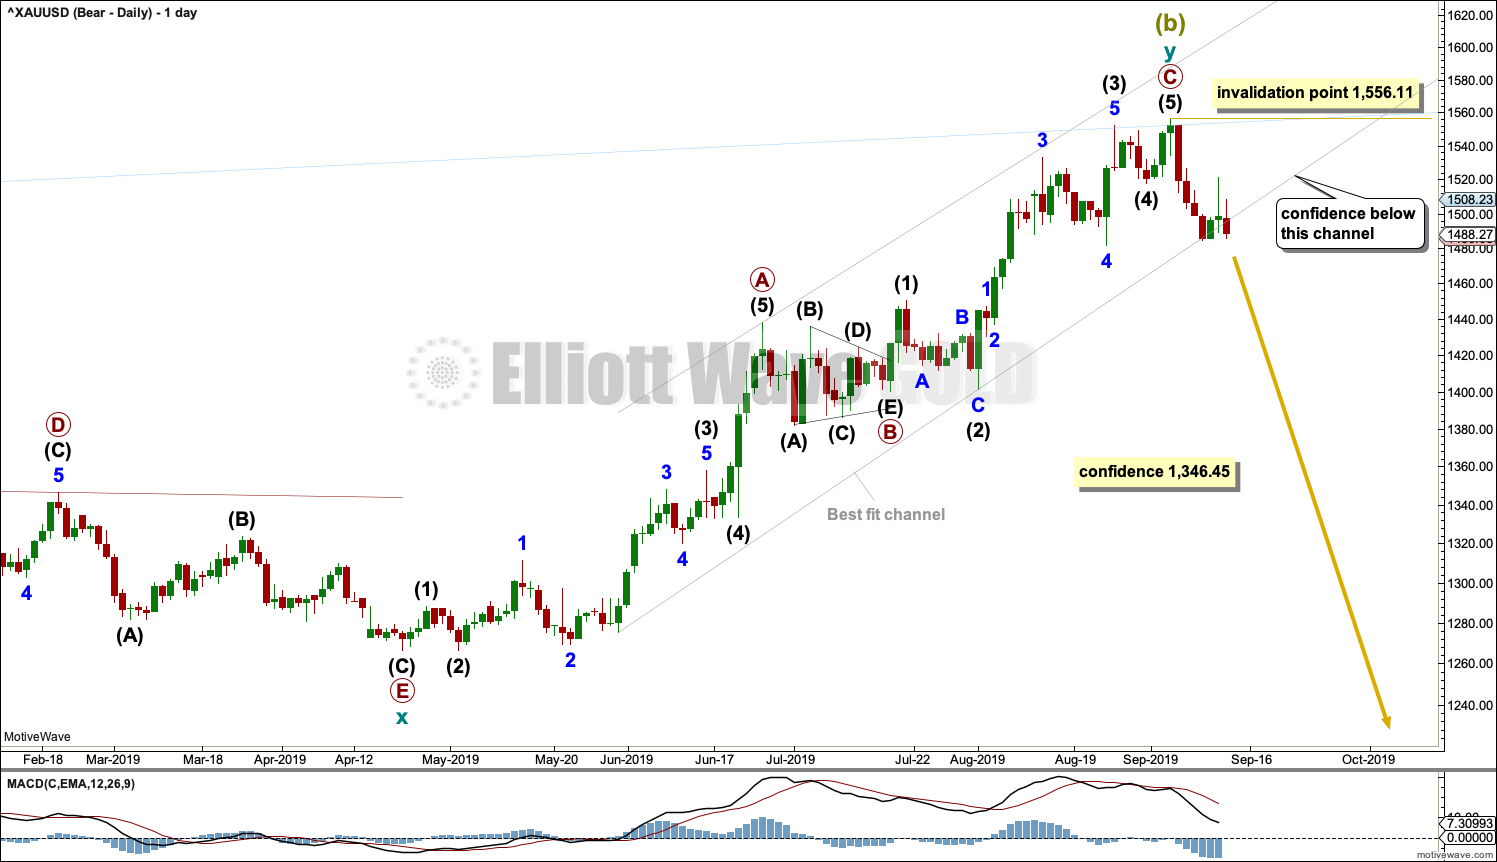
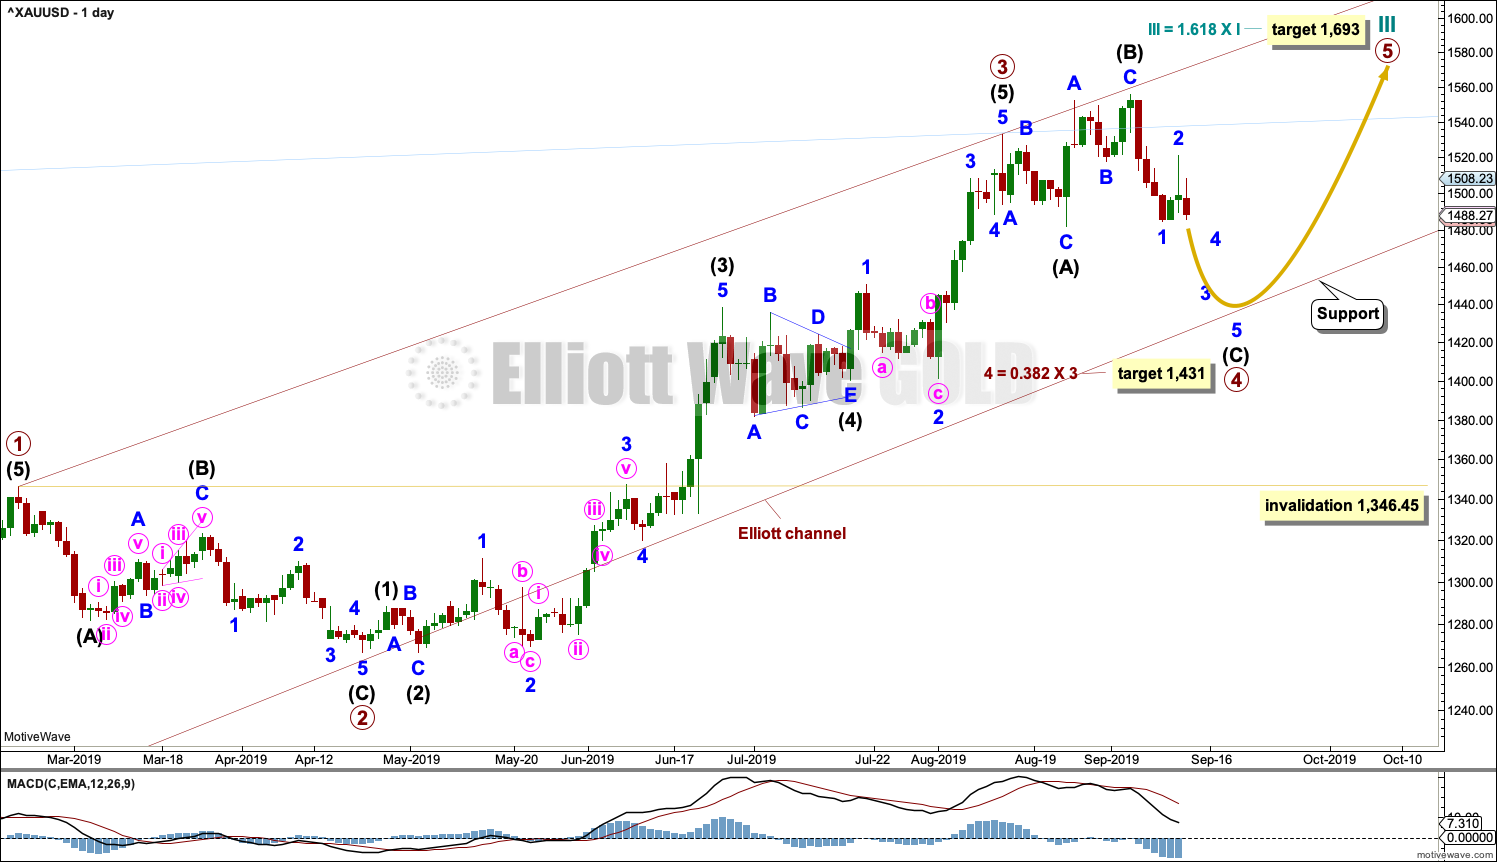
Within cycle wave y, the triangle that ended on the 17th of July may have been primary wave B. Primary wave C may have begun there. Primary wave C must subdivide as a five wave structure; it could be a complete impulse.
Within cycle wave y, there is no Fibonacci Ratio between primary waves A and C.
A breach of the best fit trend channel by downwards movement would be a very strong indication of a major trend change. At this stage, price has closed below the lower edge of the channel. A breach may be defined as a full daily candlestick below and not touching the channel, which may occur next week.
HOURLY CHART
Click chart to enlarge.
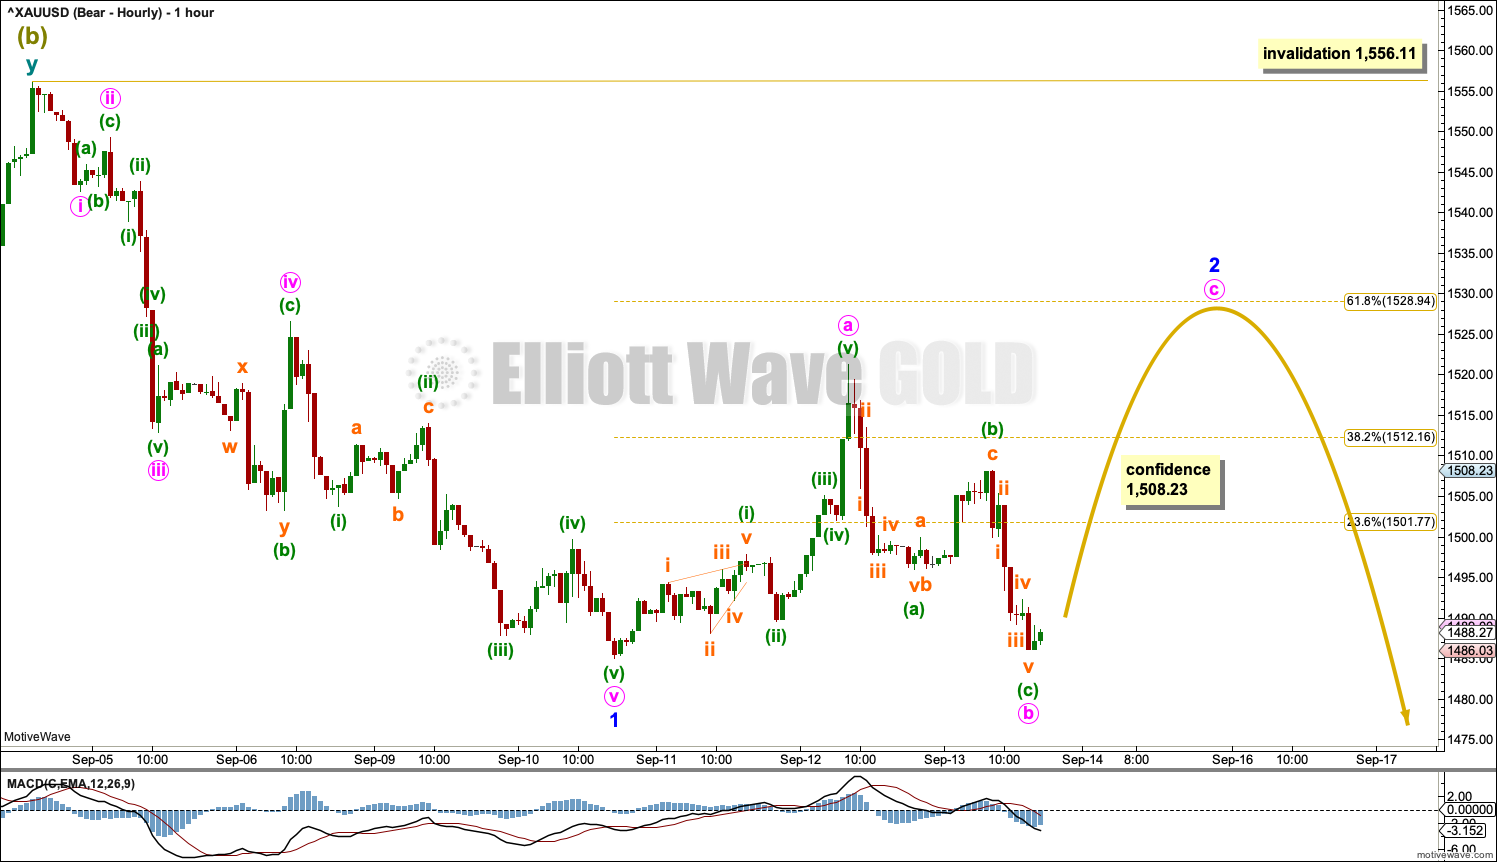
Minor wave 1 may be a complete impulse.
Fibonacci ratios within minor wave 1 are: minute wave iii is 1.23 longer than 2.618 the length of minute wave i, and minute wave v exhibits no Fibonacci Ratio to either of minute waves i or iii.
Minor wave 2 may be an incomplete zigzag. The most likely target for minor wave 2 would be the 0.618 Fibonacci Ratio of minor wave 1. It may however be deeper than that. The first second wave correction within a new trend for Gold tends to be very deep.
Minor wave 2 may not move beyond the start of minor wave 1 above 1,556.11.
It is also possible that minor wave 2 may be a complete double zigzag as labelled on the hourly chart for the bullish wave count. For the short term, both ways of labelling work for both wave counts.
If price makes a new low on Monday and exhibits any strength with support from volume or increasing momentum, then minor wave 2 would be labelled as complete at the high labelled here minute wave a, as per labelling on the hourly chart for the bullish wave count below.
A new high above 1,508.23 in the short term would invalidate labelling on the hourly chart for the bullish wave count and indicate the bounce is incomplete.
BULLISH ELLIOTT WAVE COUNT
WEEKLY CHART
Click chart to enlarge.
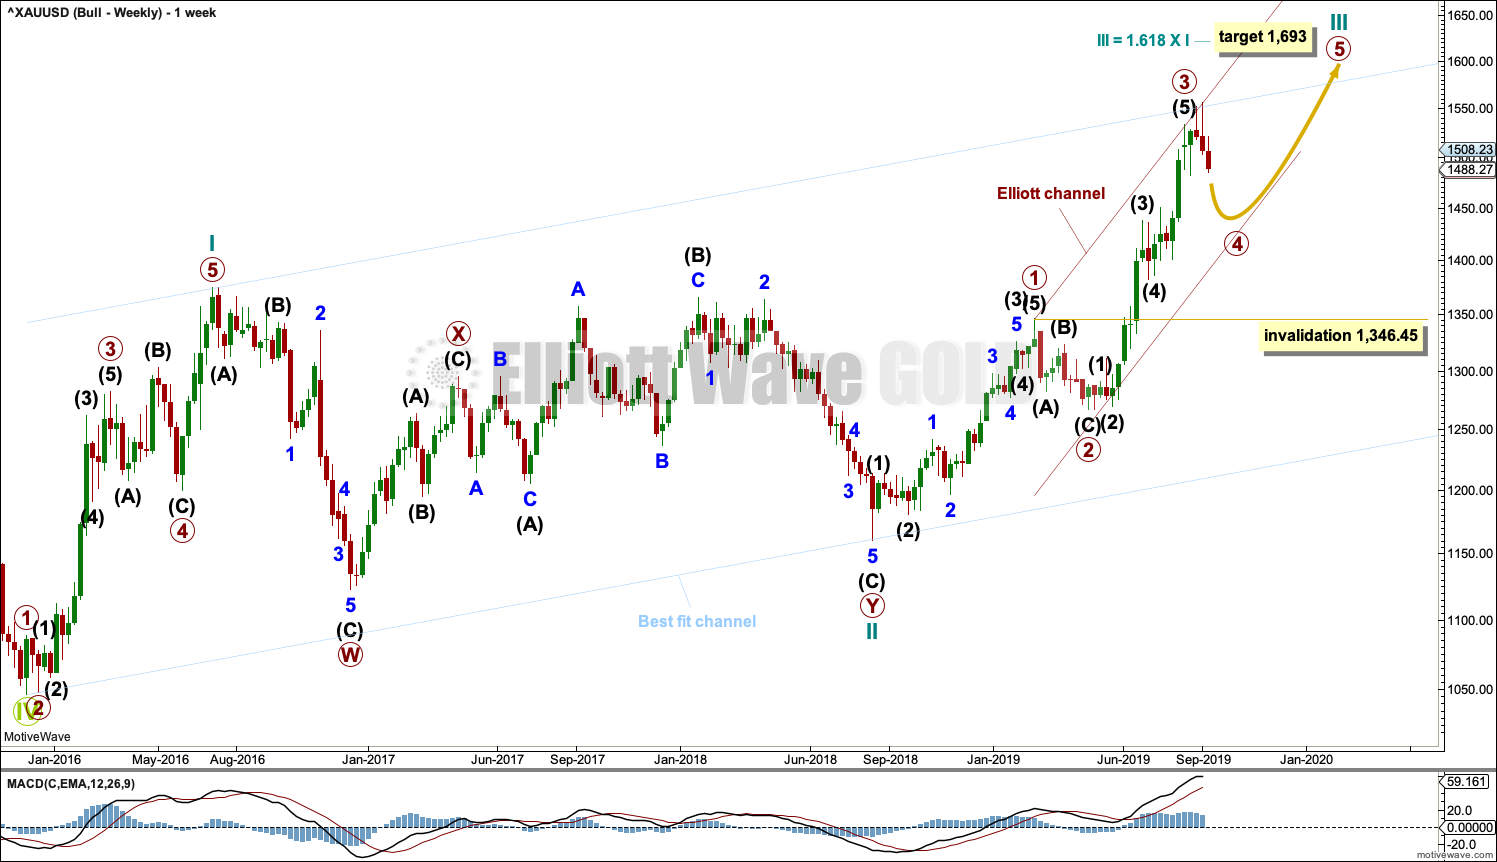
This wave count sees the the bear market complete at the last major low for Gold in November 2015.
If Gold is in a new bull market, then it should begin with a five wave structure upwards on the weekly chart. However, the biggest problem with this wave count is the structure labelled cycle wave I because this wave count must see it as a five wave structure, but it looks more like a three wave structure.
Commodities often exhibit swift strong fifth waves that force the fourth wave corrections coming just prior and just after to be more brief and shallow than their counterpart second waves. It is unusual for a commodity to exhibit a quick second wave and a more time consuming fourth wave, and this is how cycle wave I is labelled. This wave count still suffers from this very substantial problem, and for this reason the bearish wave count is still considered because it has a better fit in terms of Elliott wave structure.
Cycle wave II subdivides well as a double combination: zigzag – X – expanded flat.
Cycle wave III may have begun. Within cycle wave III, primary waves 1 and 2 may now be complete. Primary wave 3 has now moved above the end of primary wave 1 meeting a core Elliott wave rule. It has now moved far enough to allow room for primary wave 4 to unfold and remain above primary wave 1 price territory. Primary wave 4 may not move into primary wave 1 price territory below 1,346.45.
Cycle wave III so far for this wave count would have been underway now for 56 weeks. It is beginning to exhibit some support from volume and increasing ATR. This wave count now has some support from classic technical analysis.
The channel drawn about cycle wave III is an Elliott channel. Primary wave 4 may find support about the lower edge.
Add the wide best fit channel to weekly and daily charts.
DAILY CHART
Click chart to enlarge.
Primary wave 4 may be continuing as an expanded flat, which is a common corrective structure. This would see alternation in structure with the zigzag of primary wave 2.
Primary wave 2 lasted 43 sessions. Primary wave 4 may be expected to be more brief; Gold usually exhibits more brief fourth waves than their counterpart second waves. Primary wave 4 may end in a total Fibonacci 21 or 34 sessions. So far it has lasted 23 sessions. Primary wave 4 may now continue for a further 11 sessions to total a Fibonacci 34. Within primary wave 4, it would be extremely likely for intermediate wave (C) to move at least slightly below the end of intermediate wave (A) at 1,481.91 to avoid a truncation and a very rare running flat. It would be most likely that primary wave 4 is incomplete because there is not yet a new low below 1,481.91.
Primary wave 4 may not move into primary wave 1 price territory below 1,346.45.
HOURLY CHART
Click chart to enlarge.
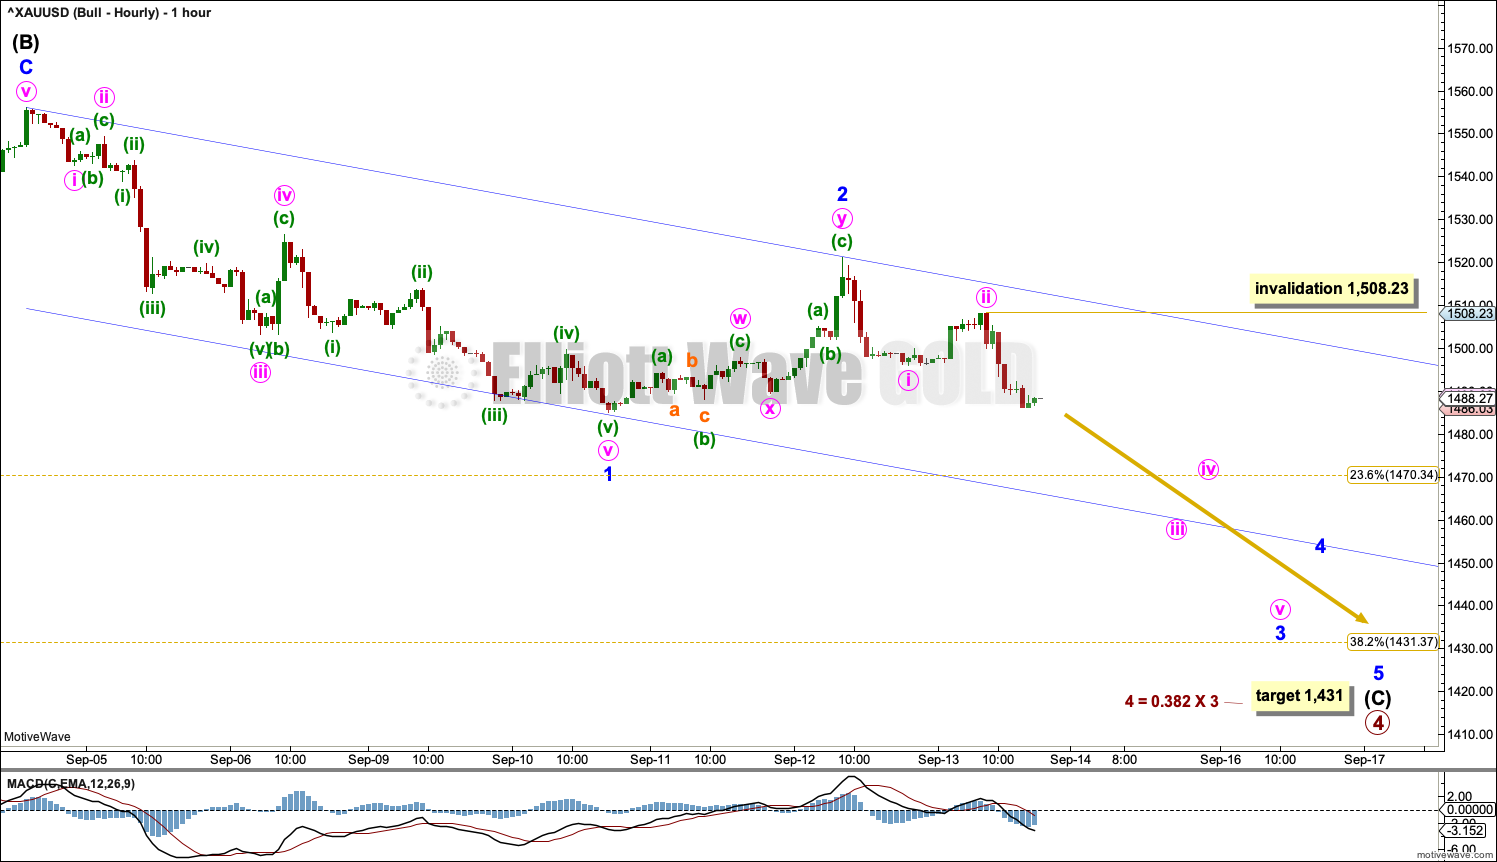
As soon as price makes a new low below the end of intermediate wave (A) at 1,481.91, then intermediate wave (C) would have avoided a truncation and a very rare running flat. At that stage, intermediate wave (C) may end at any time. It may also continue lower and last longer.
Within intermediate wave (C), minor waves 1 and 2 may be complete. Minor wave 3 may have begun. Minor wave 3 may only subdivide as an impulse. Within minor wave 3, minute waves i and ii may be complete. Within minute wave iii, no second wave correction may move beyond the start of its first wave above 1,508.23.
The target for intermediate wave (C) is moved lower to now allow room for the structure to complete. The next Fibonacci Ratio of primary wave 3 is used as the next target.
A new high above 1,508.23 would invalidate this labelling of intermediate wave (C). If that happens on Monday, then intermediate wave (C) would be relabelled in the same way as downwards movement is labelled on the bearish hourly chart.
TECHNICAL ANALYSIS
WEEKLY CHART
Click chart to enlarge. Chart courtesy of StockCharts.com.
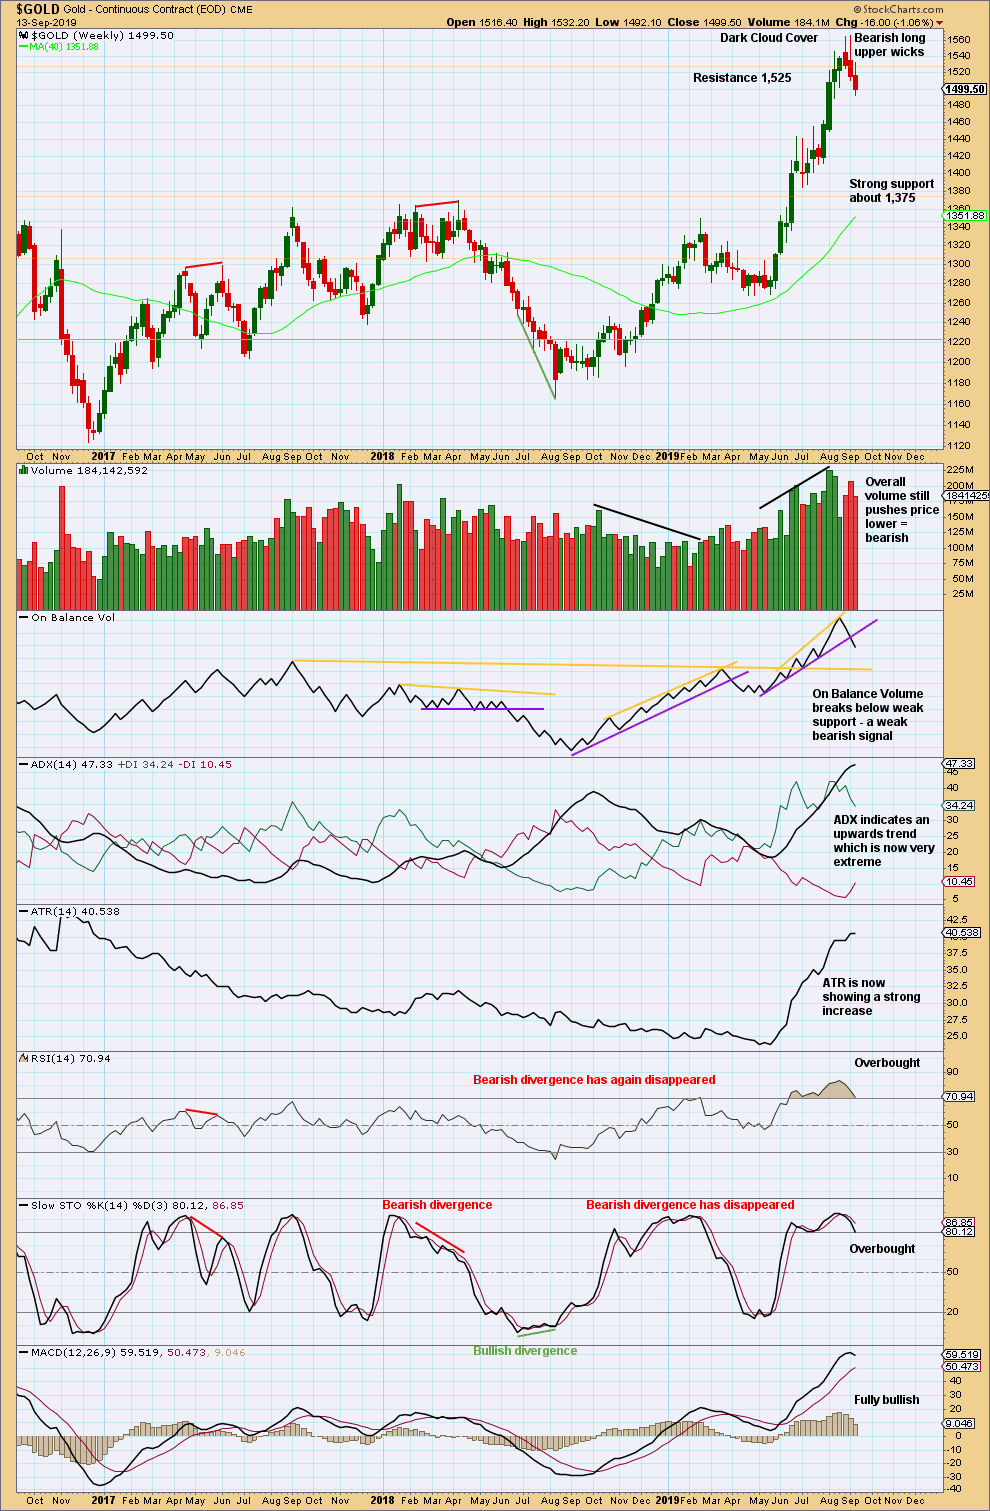
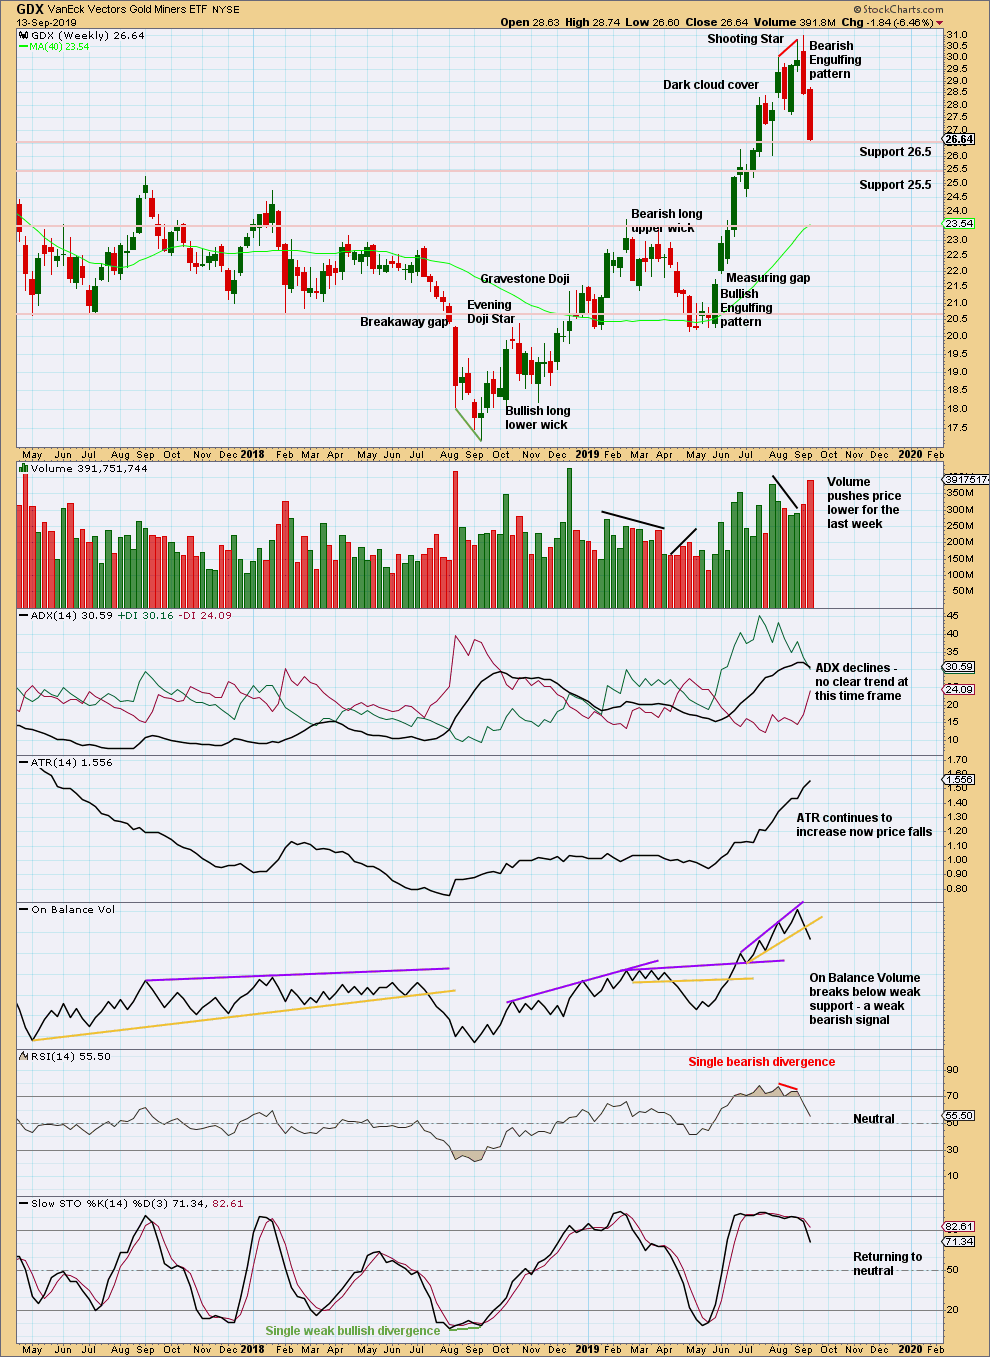
When trends reach very extreme, candlestick reversal patterns should be given weight. The Dark Cloud Cover bearish reversal pattern is given more bearish weight from the long upper wick.
The risk of a major high and a trend change or a large time consuming consolidation continuing here is very high. These two scenarios effectively follow the main bearish wave count (major trend change) or bullish wave count (a large time consuming consolidation).
This week a weak bearish signal from On Balance Volume adds confidence to this analysis.
DAILY CHART
Click chart to enlarge. Chart courtesy of StockCharts.com.
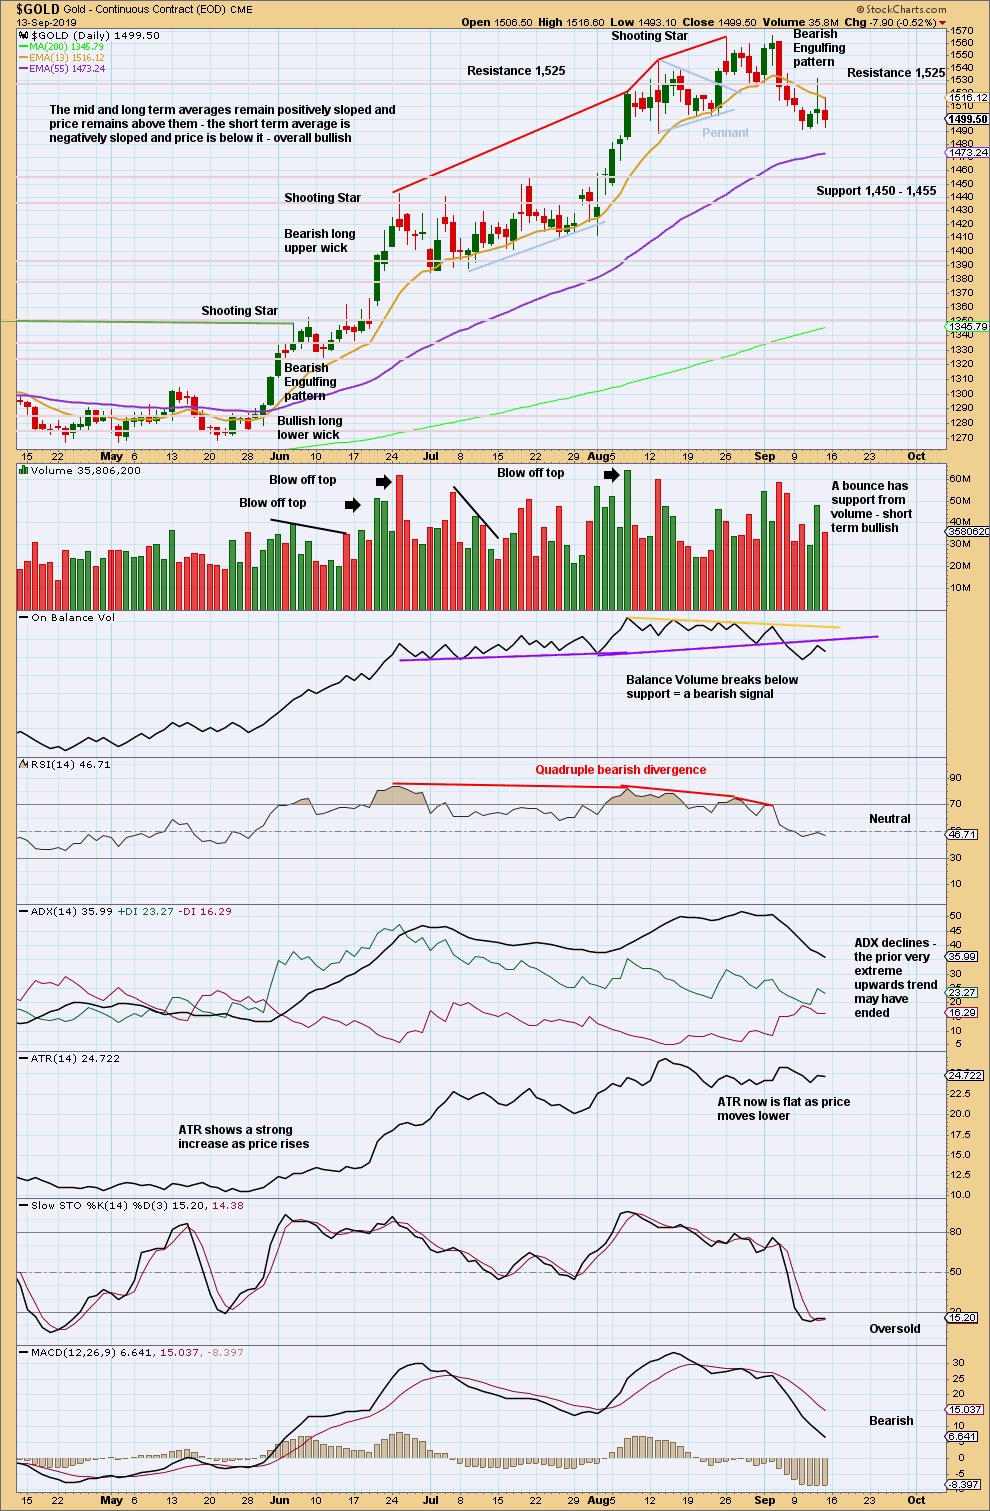
The Bearish Engulfing pattern is very strong. It fully engulfs the real bodies of the prior seven daily candlesticks. Coming after an upwards trend reached very extreme and indicators reached overbought then exhibited multiple bearish divergence with price, the probability here of either a major trend change to a new downwards trend, or a major consolidation to last weeks or months, is very high indeed.
The last swing low is at 1,488.90. A new low below this point would confirm a trend change.
Downwards movement of the last session looks a little weak. A small bounce may continue a little higher early next week before a downwards trend or swing continues.
GDX WEEKLY CHART
Click chart to enlarge. Chart courtesy of StockCharts.com.
A strong downwards week that has a strong push from volume this week is very bearish. Look for more downwards movement next week. Do not expect price to move in a straight line. Look for bounces and consolidations to possibly develop about identified areas of support.
GDX DAILY CHART
Click chart to enlarge. Chart courtesy of StockCharts.com.
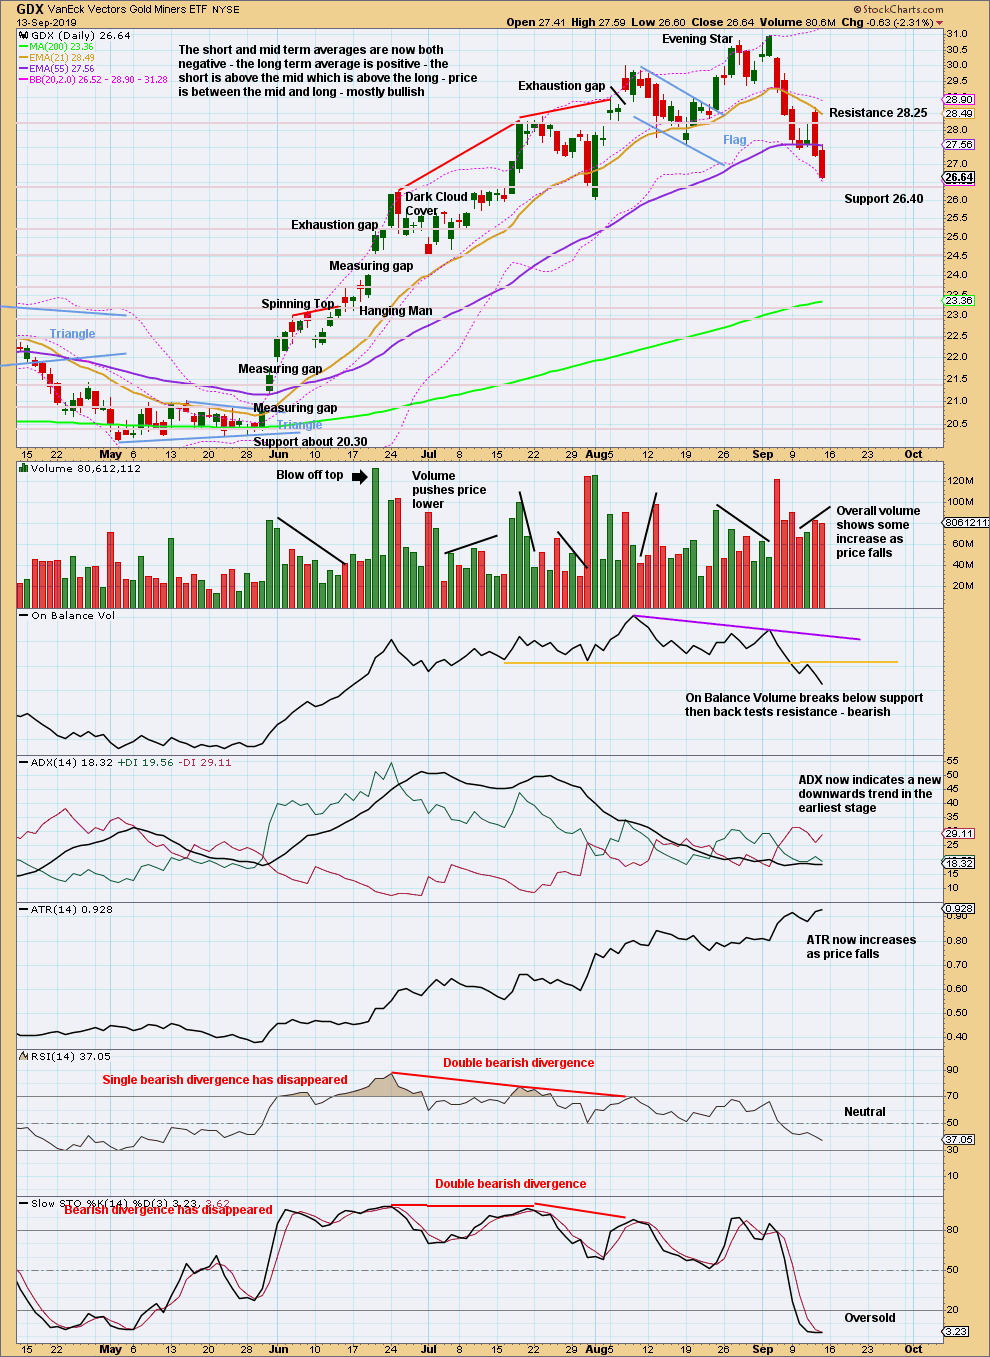
A new low below the prior swing low at 27.61 confirms a trend change. This comes with a bearish signal from On Balance Volume. Expect price to keep falling, interrupted at support levels, until proven otherwise.
Friday’s candlestick is fairly bearish. Expect downwards movement to begin next week.
Published @ 10:22 p.m. EST.
—
Careful risk management protects your trading account(s).
Follow my two Golden Rules:
1. Always trade with stops.
2. Risk only 1-5% of equity on any one trade.
—
New updates to this analysis are in bold.
Still two ways of labelling movement of the last couple of sessions, here’s one:
and here’s another
It would appear the bullish hourly chart is invalidated. That would make the new hourly target at about 1529 for bull and bear, if I read the analysis correctly.
Well, Minor 2 of the bullish chart could still be continuing. On the daily chart it’s got a nice ABC correction with today’s spike possible Minor 2.
ZH, kinda.
There isn’t really a bull and bear hourly – there are just 2 options, as longer term they both lead to the same direction – which is down.
1529 is the most likely target, but it might not meet it.
For me, I wouldn’t chase this last bit higher now, as it could turn at any point, and not come back – the trend is your friend – I’m waiting for the turn now to go short. Chasing the last bits of a move before it turns is a very risky business.