
To begin the week a bounce was expected to continue upwards to about 1,529. Upwards movement for Monday has reached 1,525.91.
Summary: The bounce may continue up to about 1,529 before the downwards trend resumes.
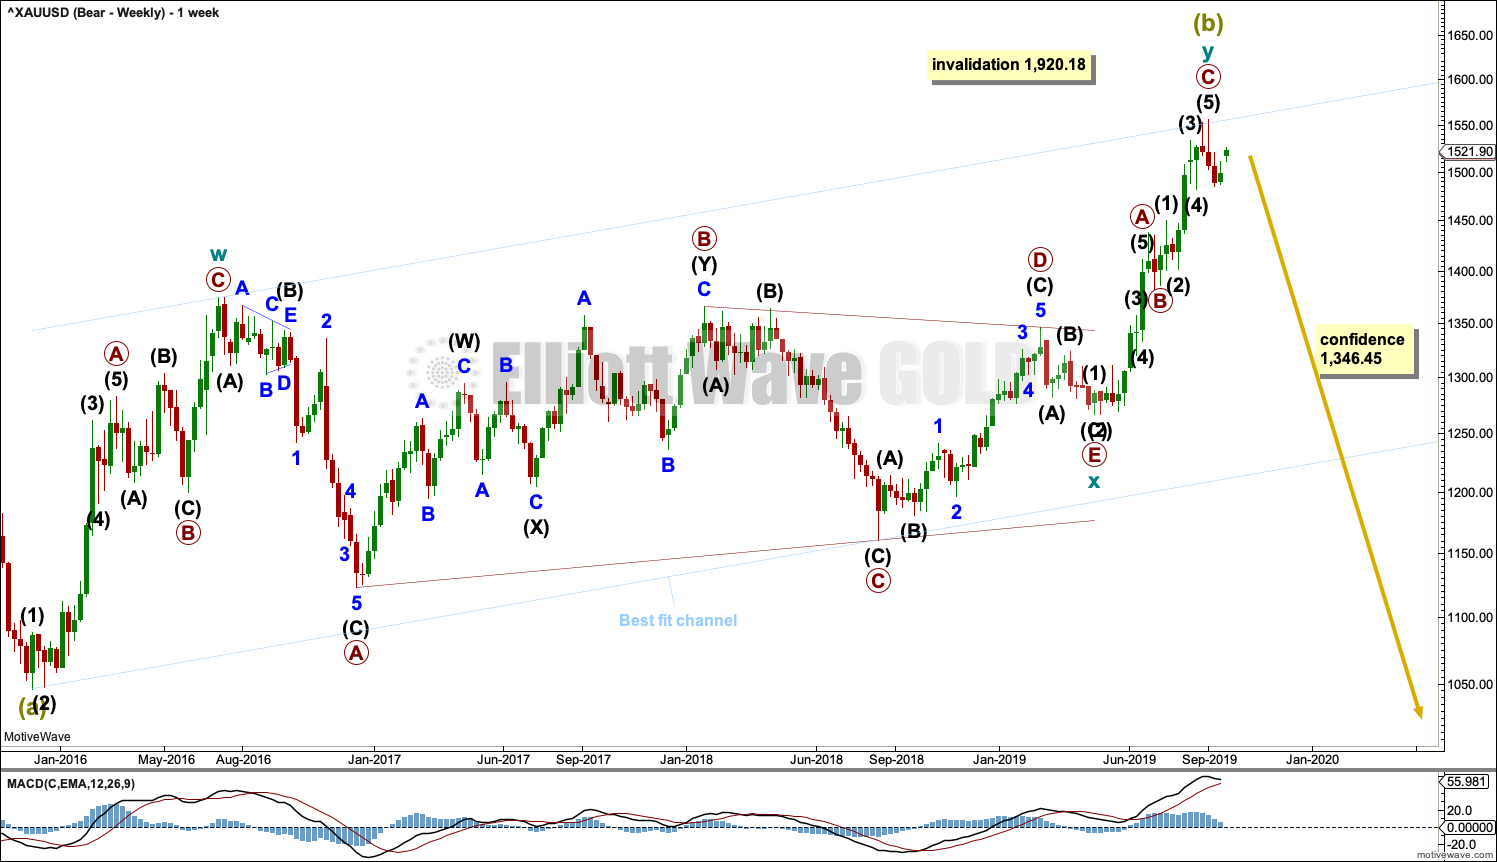
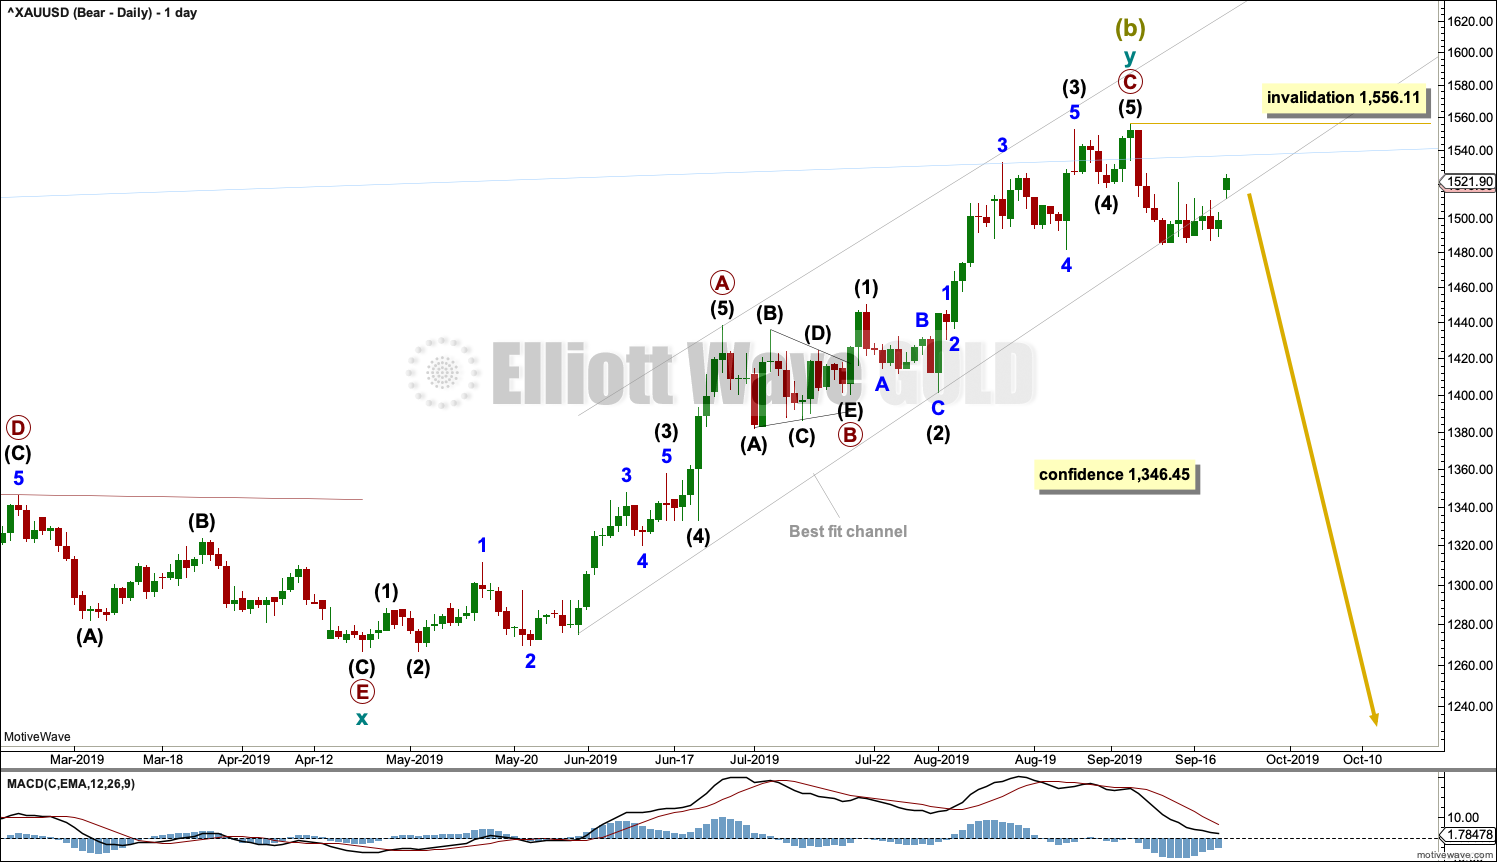
The bearish Elliott wave count expects a new downwards trend to last one to several years has begun. Confidence in this view may be had if price makes a new low by any amount at any time frame below 1,346.45.
The bullish Elliott wave count expects a primary degree fourth wave is unfolding, forming a large consolidation to end in possibly 5 more sessions. The eventual area of support for the consolidation is expected to be about 1,431.
Grand SuperCycle analysis is here.
Monthly charts were last published here with video here.
BEARISH ELLIOTT WAVE COUNT
WEEKLY CHART
Click chart to enlarge.
It is possible that Super Cycle wave (b) is complete as a double zigzag.
The first zigzag in the double is labelled cycle wave w. The double is joined by a three in the opposite direction, a triangle labelled cycle wave x. The second zigzag in the double is labelled cycle wave y.
The purpose of the second zigzag in a double is to deepen the correction. Cycle wave y has achieved this purpose.
A new low below 1,346.45 would add strong confidence to this wave count. At that stage, the bullish Elliott wave count would be invalidated.
A wide best fit channel is added in light blue. This channel contains all of Super Cycle wave (b) and may provide resistance and support. Copy this channel over to daily charts.
DAILY CHART
Click chart to enlarge.
Within cycle wave y, the triangle that ended on the 17th of July may have been primary wave B. Primary wave C may have begun there. Primary wave C must subdivide as a five wave structure; it could be a complete impulse.
Within cycle wave y, there is no Fibonacci Ratio between primary waves A and C.
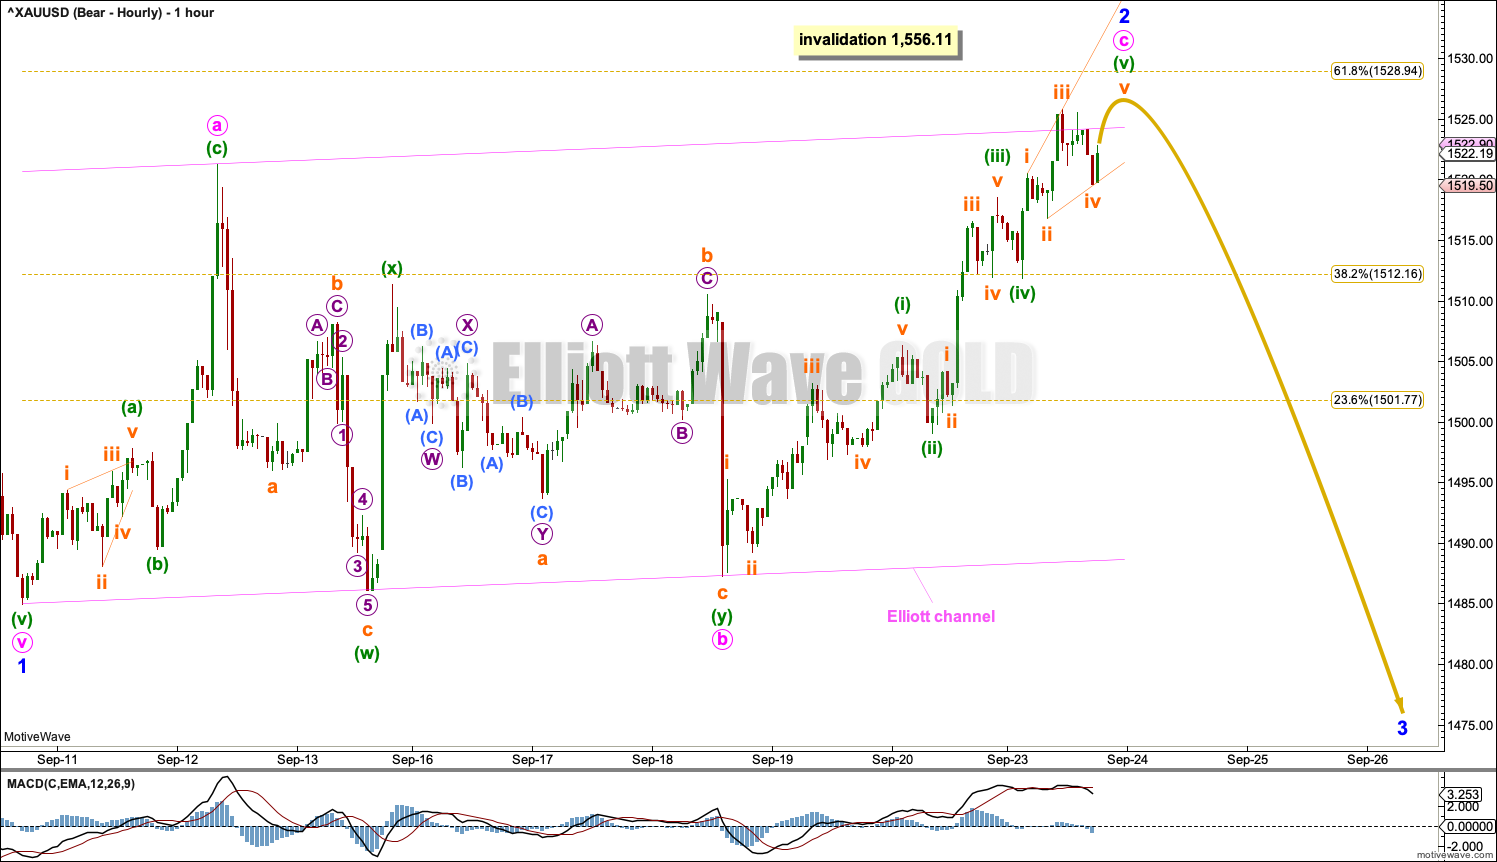
HOURLY CHART
Click chart to enlarge.
Minor wave 2 may now be almost complete. This first hourly chart considers minor wave 2 as a regular flat correction.
Both minute waves a and b within the regular flat subdivide as threes. Minute wave b is a 0.94 length of minute wave a. Regular flats often fit within parallel channels. Minute wave c may find resistance at the upper edge of the Elliott channel. It is common for C waves of regular flats to have small overshoots of the channel at their ends. This one so far looks typical.
When minor wave 2 may be complete, then a downwards breakout below support would be expected as minor wave 3 begins.
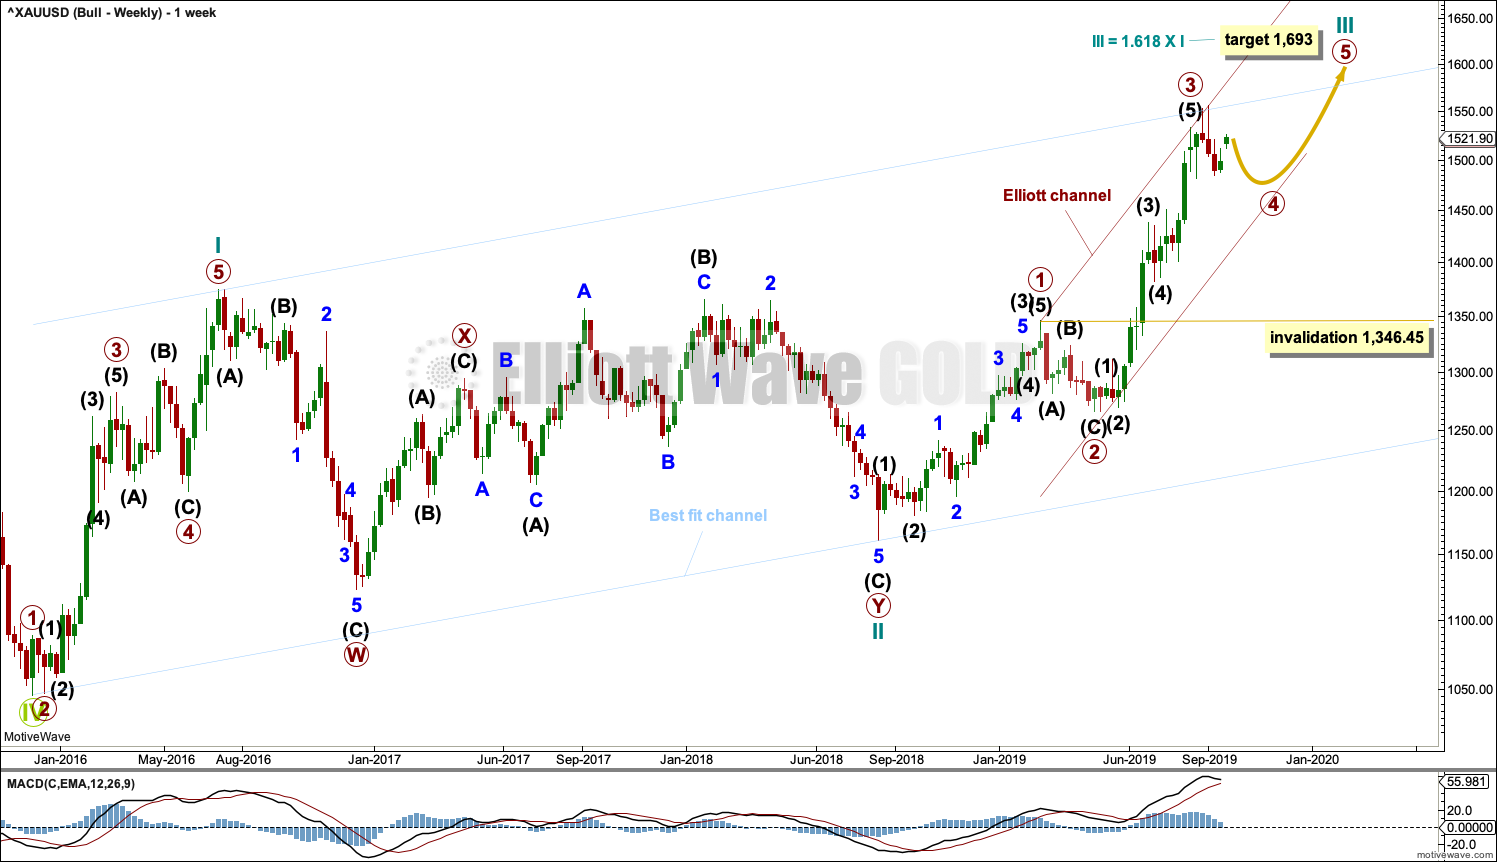
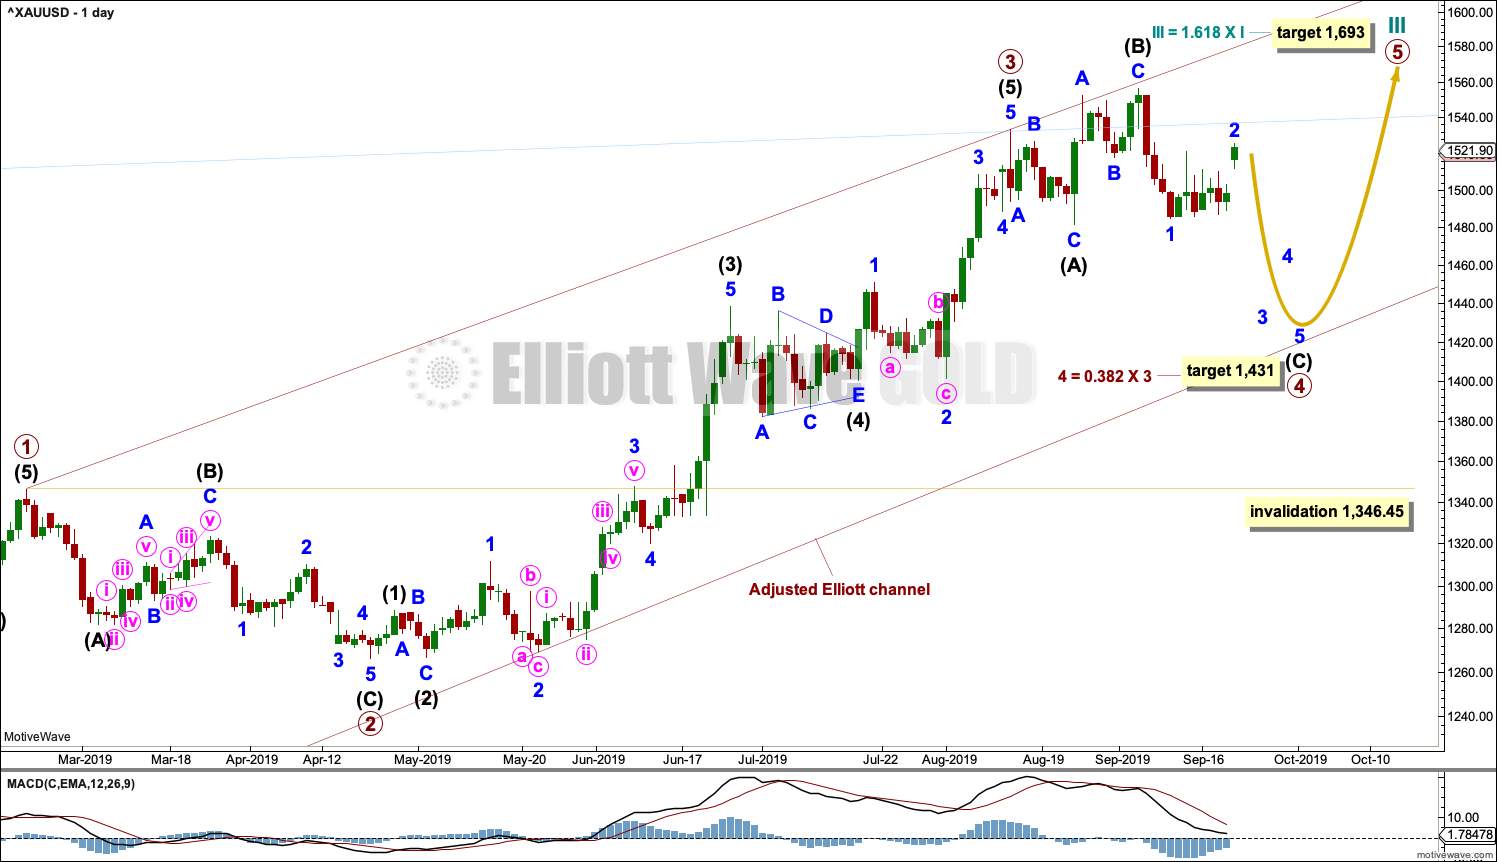
BULLISH ELLIOTT WAVE COUNT
WEEKLY CHART
Click chart to enlarge.
This wave count sees the the bear market complete at the last major low for Gold in November 2015.
If Gold is in a new bull market, then it should begin with a five wave structure upwards on the weekly chart. However, the biggest problem with this wave count is the structure labelled cycle wave I because this wave count must see it as a five wave structure, but it looks more like a three wave structure.
Commodities often exhibit swift strong fifth waves that force the fourth wave corrections coming just prior and just after to be more brief and shallow than their counterpart second waves. It is unusual for a commodity to exhibit a quick second wave and a more time consuming fourth wave, and this is how cycle wave I is labelled. This wave count still suffers from this very substantial problem, and for this reason the bearish wave count is still considered because it has a better fit in terms of Elliott wave structure.
Cycle wave II subdivides well as a double combination: zigzag – X – expanded flat.
Cycle wave III may have begun. Within cycle wave III, primary waves 1 and 2 may now be complete. Primary wave 3 has now moved above the end of primary wave 1 meeting a core Elliott wave rule. It has now moved far enough to allow room for primary wave 4 to unfold and remain above primary wave 1 price territory. Primary wave 4 may not move into primary wave 1 price territory below 1,346.45.
Cycle wave III so far for this wave count would have been underway now for 58 weeks. It is beginning to exhibit some support from volume and increasing ATR. This wave count now has some support from classic technical analysis.
The channel drawn about cycle wave III is an Elliott channel. Primary wave 4 may find support about the lower edge.
Add the wide best fit channel to weekly and daily charts.
DAILY CHART
Click chart to enlarge.
Primary wave 4 may be continuing as an expanded flat, which is a common corrective structure. This would see alternation in structure with the zigzag of primary wave 2.
Primary wave 2 lasted 43 sessions. Primary wave 4 may be expected to be more brief; Gold usually exhibits more brief fourth waves than their counterpart second waves. Primary wave 4 may end in a total Fibonacci 21 or 34 sessions. So far it has lasted 29 sessions. Primary wave 4 may now continue for a further 5 sessions to total a Fibonacci 34, although it may now require longer than that to complete the structure. Within primary wave 4, it would be extremely likely for intermediate wave (C) to move at least slightly below the end of intermediate wave (A) at 1,481.91 to avoid a truncation and a very rare running flat. It would be most likely that primary wave 4 is incomplete because there is not yet a new low below 1,481.91.
Primary wave 4 may not move into primary wave 1 price territory below 1,346.45.
HOURLY CHART
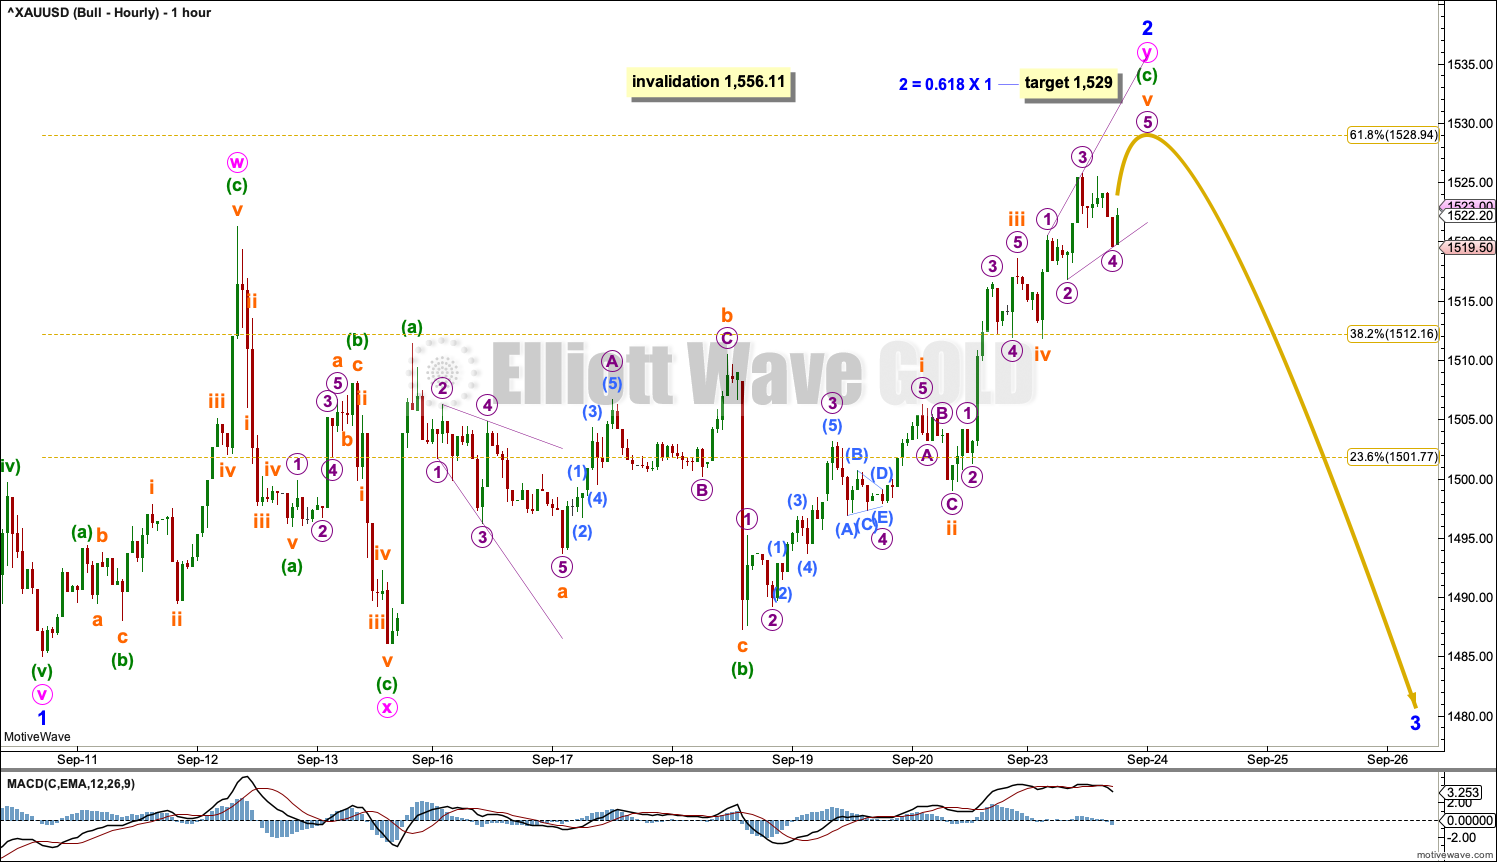
Click chart to enlarge.
Minor wave 2 may be a double zigzag or double combination. These are fairly common structures. The second structure in the double may be either a zigzag or a flat correction. Minute wave y may bring minor wave 2 closer to the 0.618 Fibonacci Ratio of minor wave 1.
Minor wave 2 may not move beyond the start of minor wave 1 above 1,556.11.
As soon as price makes a new low below the end of intermediate wave (A) at 1,481.91, then intermediate wave (C) would have avoided a truncation and a very rare running flat. At that stage, intermediate wave (C) may end at any time. It may also continue lower and last longer.
TECHNICAL ANALYSIS
WEEKLY CHART
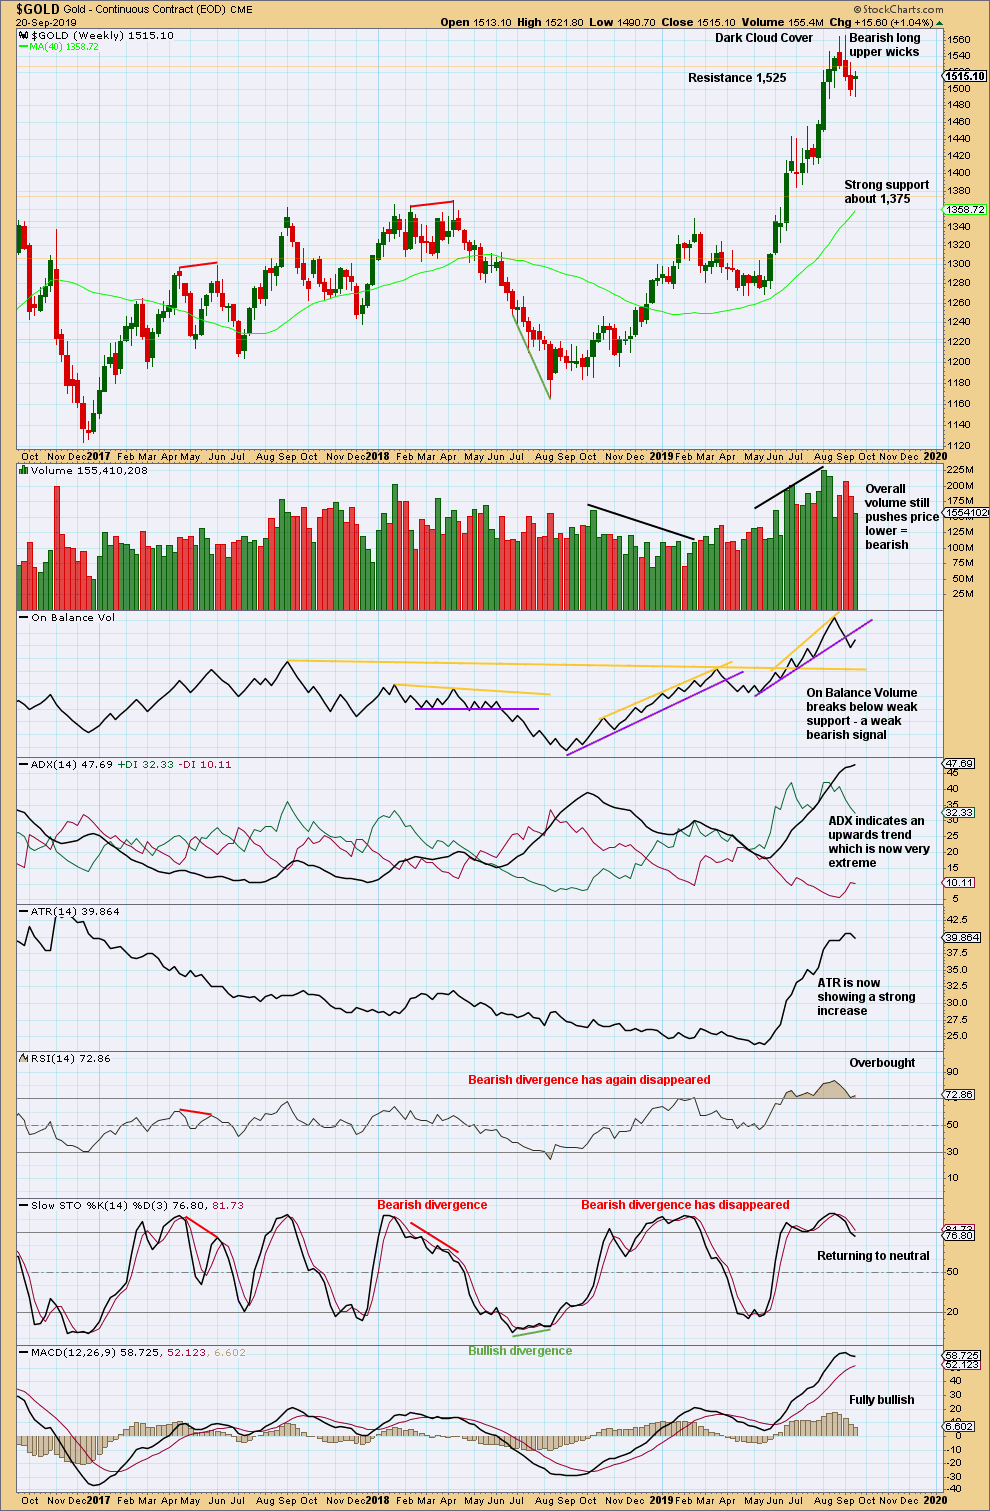
Click chart to enlarge. Chart courtesy of StockCharts.com.
When trends reach very extreme, candlestick reversal patterns should be given weight. The Dark Cloud Cover bearish reversal pattern is given more bearish weight from the long upper wick.
The risk of a major high and a trend change or a large time consuming consolidation continuing here is very high. These two scenarios effectively follow the main bearish wave count (major trend change) or bullish wave count (a large time consuming consolidation).
A weak bearish signal from On Balance Volume adds confidence to this analysis.
Last week completes a downwards week, but the candlestick has closed green and the balance of volume is upwards. Upwards movement within the week may lack support from volume as volume declines for the week; but to judge the short-term volume profile, it would be best to look inside the week at daily volume bars.
DAILY CHART
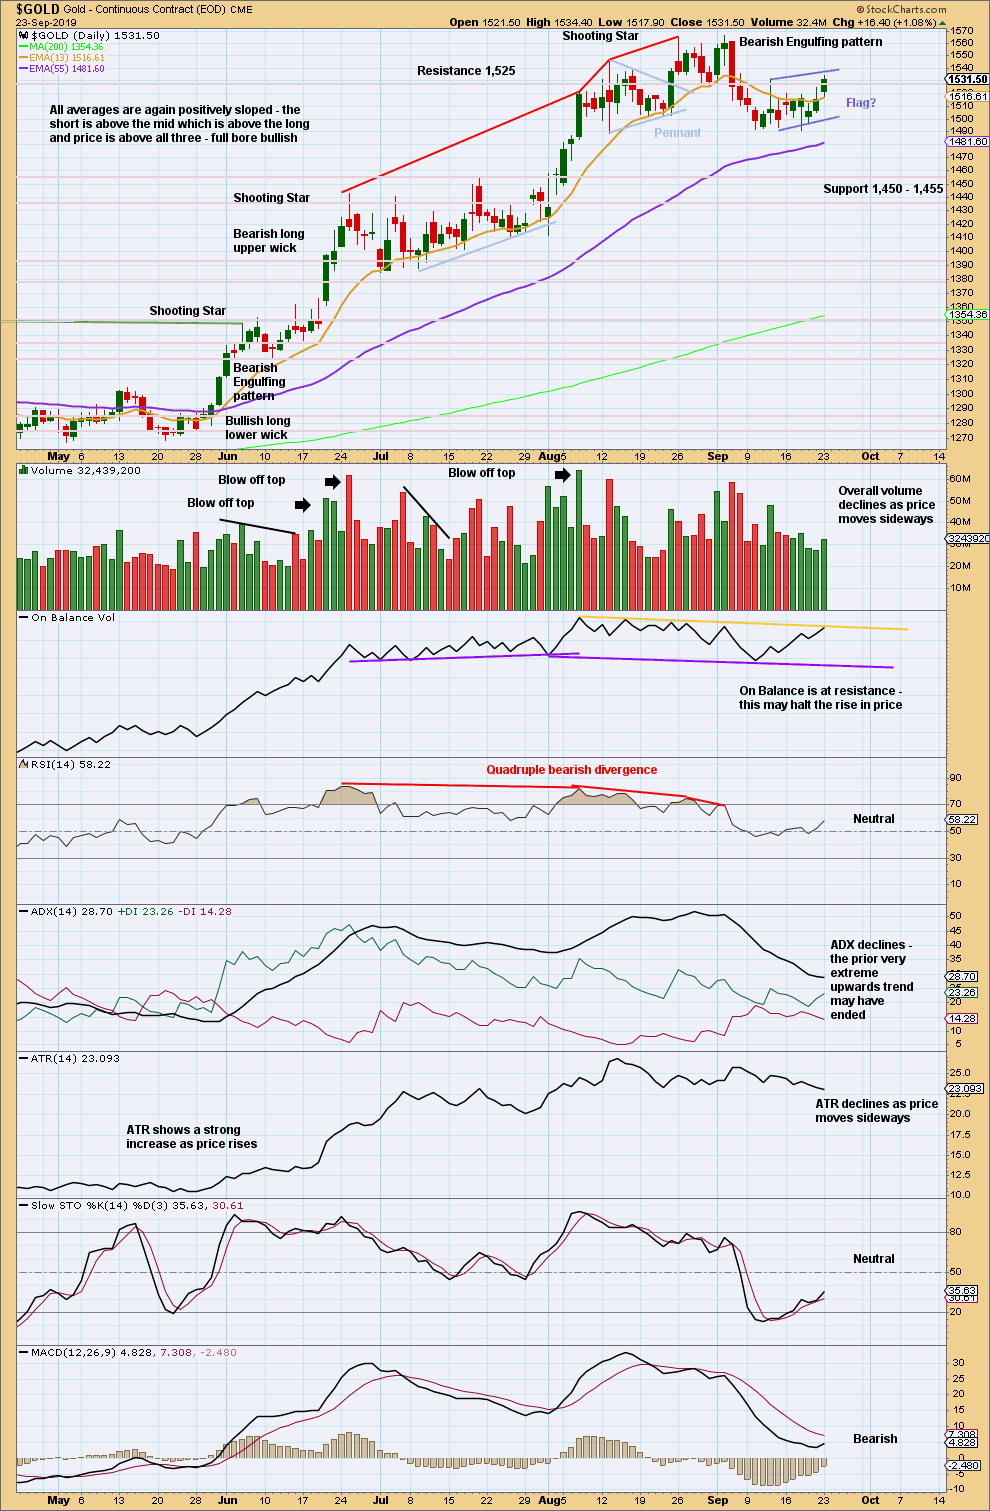
Click chart to enlarge. Chart courtesy of StockCharts.com.
The Bearish Engulfing pattern is very strong. It fully engulfs the real bodies of the prior seven daily candlesticks. Coming after an upwards trend reached very extreme and indicators reached overbought then exhibited multiple bearish divergence with price, the probability here of either a major trend change to a new downwards trend, or a major consolidation to last weeks or months, is very high indeed.
The last swing low is at 1,488.90. A new low below this point would confirm a trend change.
A small flag may be forming. This would be a continuation pattern, so a downwards breakout would be expected. A target calculated from the flag pole would be about 1,426.
Volume overall is still declining as price moves sideways; but, some increase in volume for this last session suggests the bounce is not over yet.
GDX WEEKLY CHART
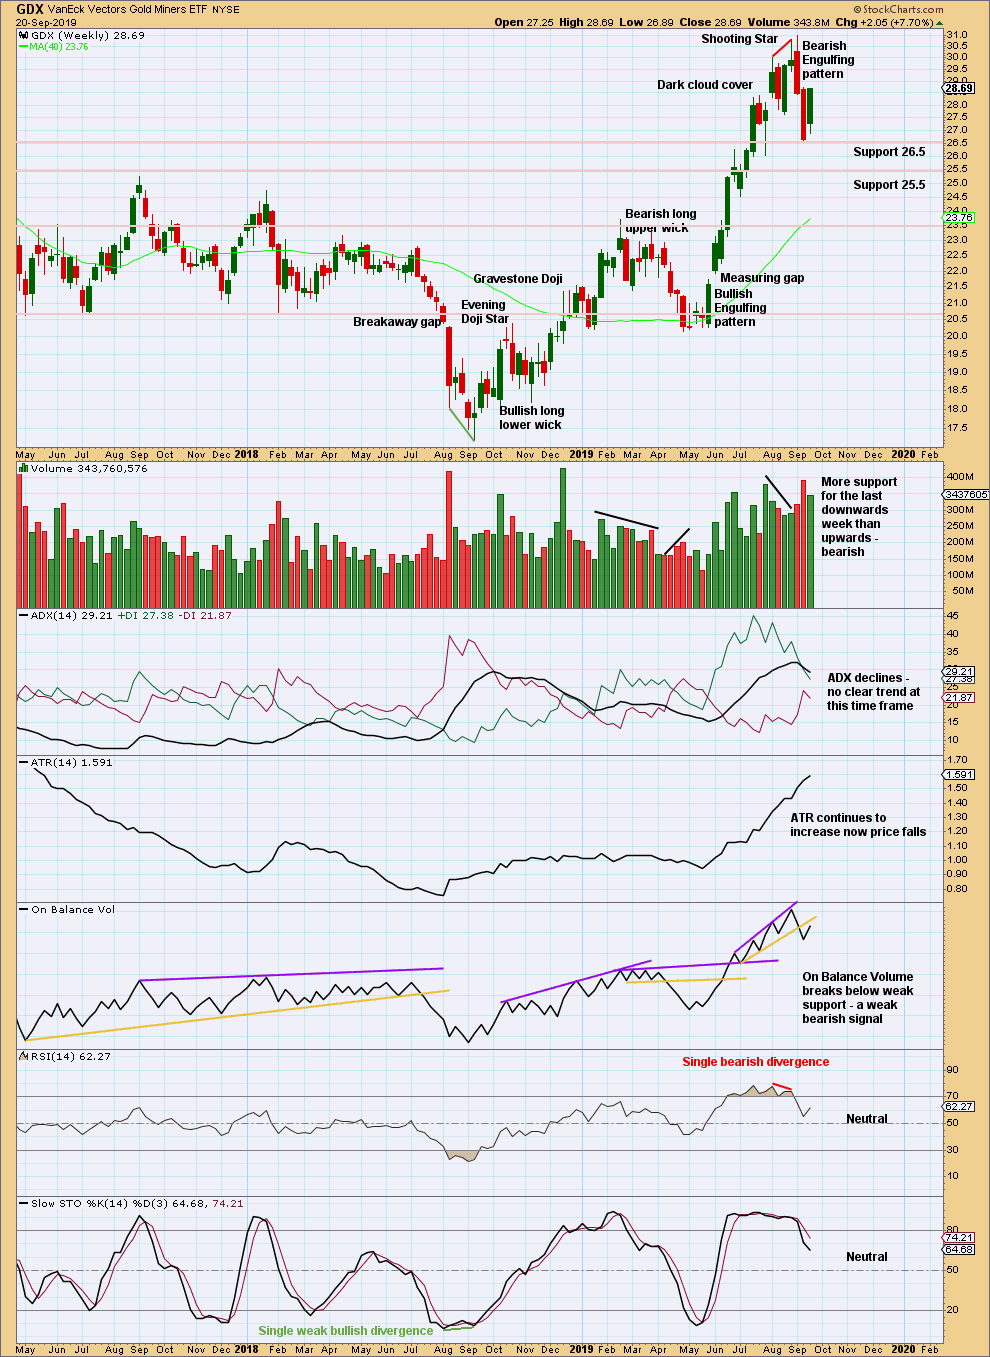
Click chart to enlarge. Chart courtesy of StockCharts.com.
A bounce up from support has unfolded last week. Look inside the week to judge the short-term volume profile.
GDX DAILY CHART
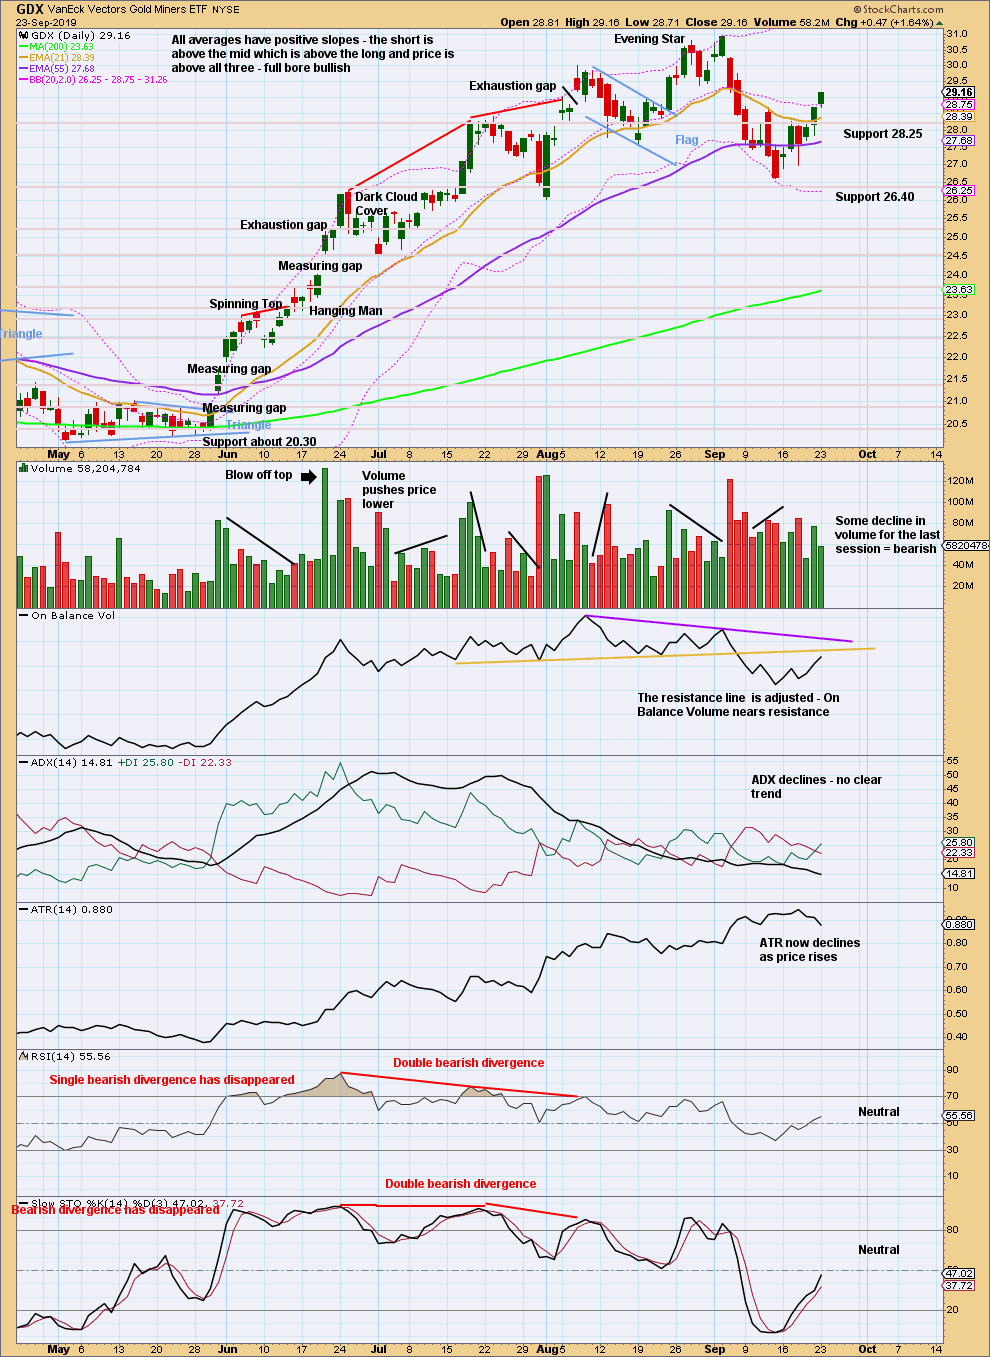
Click chart to enlarge. Chart courtesy of StockCharts.com.
Upwards movement looks weak so far with volume and ATR declines. This bounce may be limited but not over yet. A shaven head today suggests more upwards movement tomorrow.
Published @ 07:46 p.m. EST.
—
Careful risk management protects your trading account(s).
Follow my two Golden Rules:
1. Always trade with stops.
2. Risk only 1-5% of equity on any one trade.
—
New updates to this analysis are in bold.
Updated hourly chart
The structure is complete, but I’m concerned the last completed hourly candlestick has such a long wick. That’s bullish.
The bounce may not be over yet.
The volatility in gold at this potential near-term top is a bit encouraging.
I’ll often look for wild swings near inflection points to confirm a shift is coming.
If this turns out to be near-term top…very nice call/analysis Lara.
GDX looks much more clear as a top I think
Lara – what’s the invalidation price for this bounce? over the .78 fib?
apologies, I see it is at 1556.11
I was looking for down silver day and gold popping to 1529 cash. We got it.
I’ve sold my longs and am short via put options on GC.
I’m sill squarely in bullish camp, so looking for quick 1-2 week down move to re-buy futures.
GLTA
One of the golden rule of PM sector has been through the century that when Gold to silver ratio goes down (inverse Silver to gold ratio rises) nominal prices for Gold and Silver follows up with silver out performing gold.
Recently SGR has broken upward from a long consolidation since 2011 top. A big clue that metal prices will continue higher for years to come.
Per Elliott wave counts the bullish wave has low threshold to be discarded at $1345 eesh.
But Bearish count has very high threshold : $1923 last top in 2011. So if gold bullish count is the one then expect bearish count to be with us for a long time.
That’s the way I see it.
Attached chart of SGR shows the break out. It is bullish.
Additional read on GSR:
What should the gold/silver ratio be?
https://tsi-blog.com/2017/05/what-should-the-goldsilver-ratio-be/