
The preferred bearish Elliott wave count expected a bounce for the short term up to a target at 1,492. So far some upwards movement for the session has reached 1,485.43.
Summary: For the very short term, this bounce may continue a little higher to test resistance at the lower edge of the pink Elliott channel drawn on daily and hourly charts. The target remains about 1,492. Thereafter, the downwards trend may resume.
The next short-term target may now be at 1,420. A classic analysis target using the flag pattern is at 1,426.
The bearish Elliott wave count expects a new downwards trend to last one to several years has begun. Confidence in this view may be had if price makes a new low by any amount at any time frame below 1,346.45.
The bullish Elliott wave count expects a primary degree fourth wave is unfolding, forming a large consolidation to end in possibly 5 more sessions. The eventual area of support for the consolidation is expected to be about 1,431.
Grand SuperCycle analysis is here.
Monthly charts were last published here with video here.
BEARISH ELLIOTT WAVE COUNT
WEEKLY CHART
Click chart to enlarge.
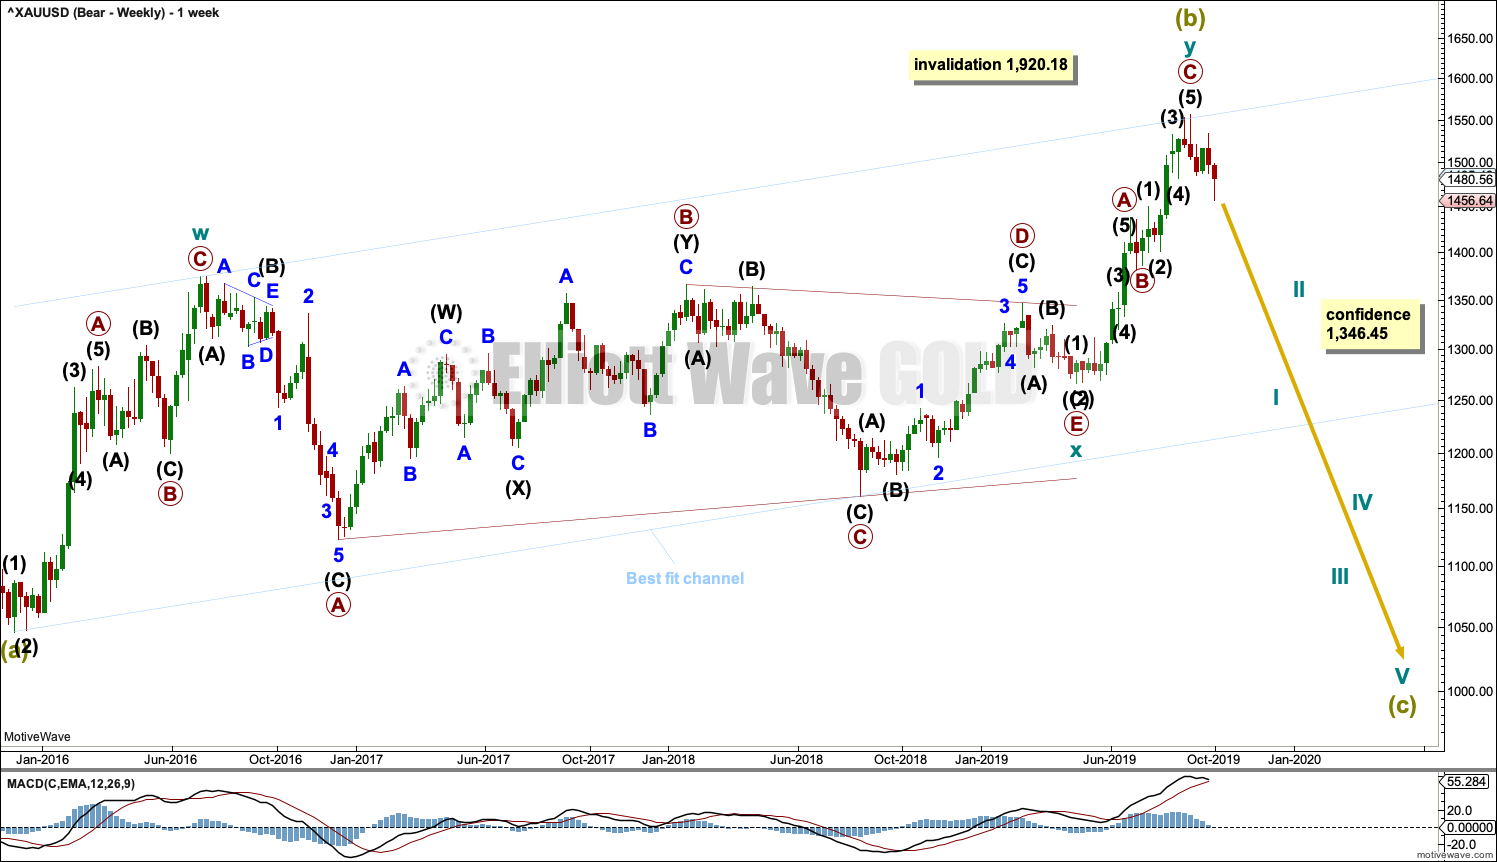
It is possible that Super Cycle wave (b) is complete as a double zigzag.
The first zigzag in the double is labelled cycle wave w. The double is joined by a three in the opposite direction, a triangle labelled cycle wave x. The second zigzag in the double is labelled cycle wave y.
The purpose of the second zigzag in a double is to deepen the correction. Cycle wave y has achieved this purpose.
A new low below 1,346.45 would add strong confidence to this wave count. At that stage, the bullish Elliott wave count would be invalidated.
A wide best fit channel is added in light blue. This channel contains all of Super Cycle wave (b) and may provide resistance and support. Copy this channel over to daily charts.
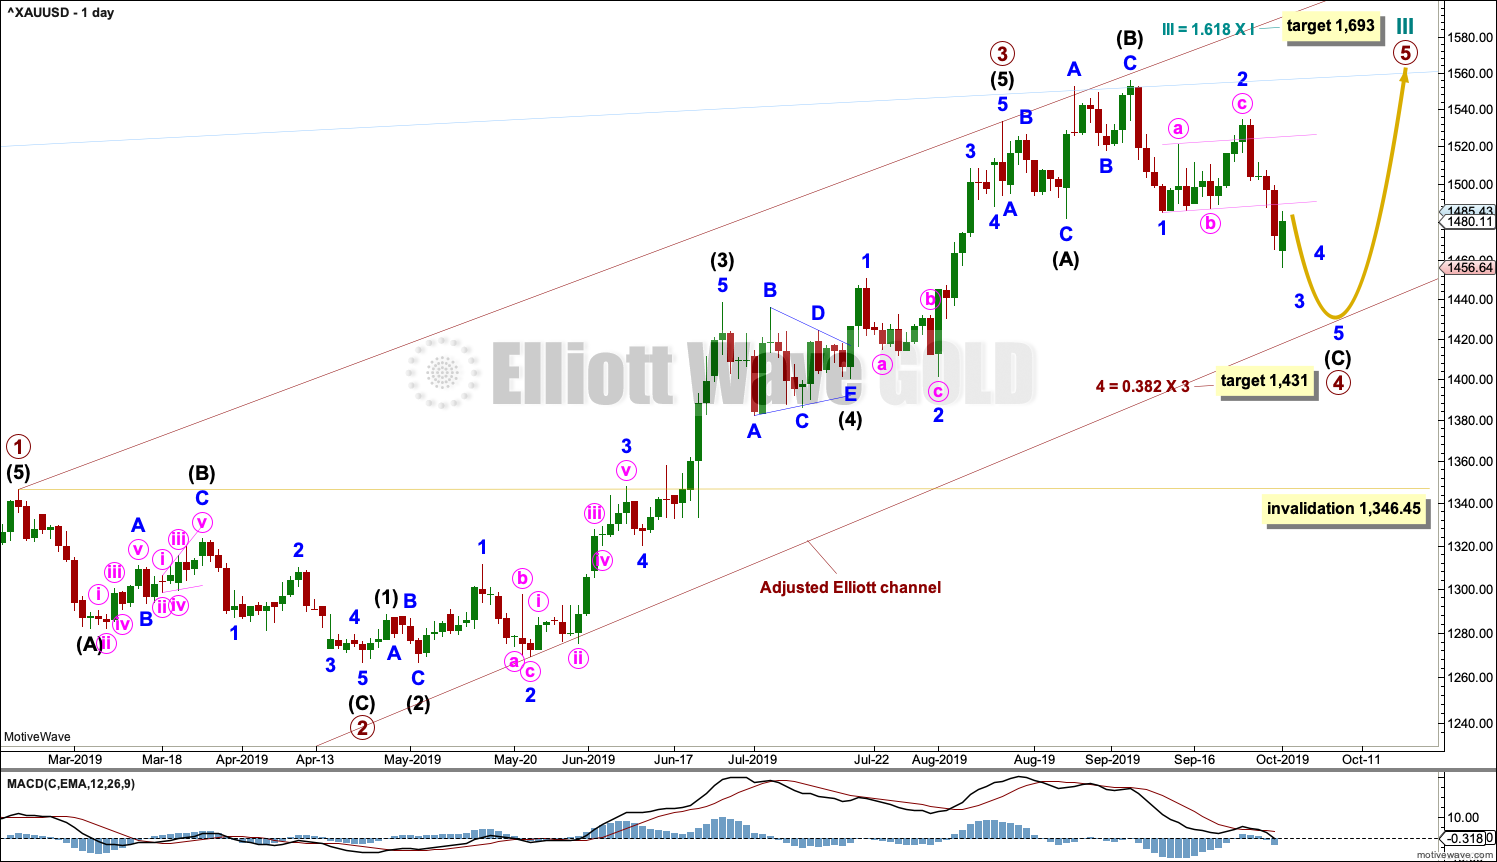
DAILY CHART
Click chart to enlarge.
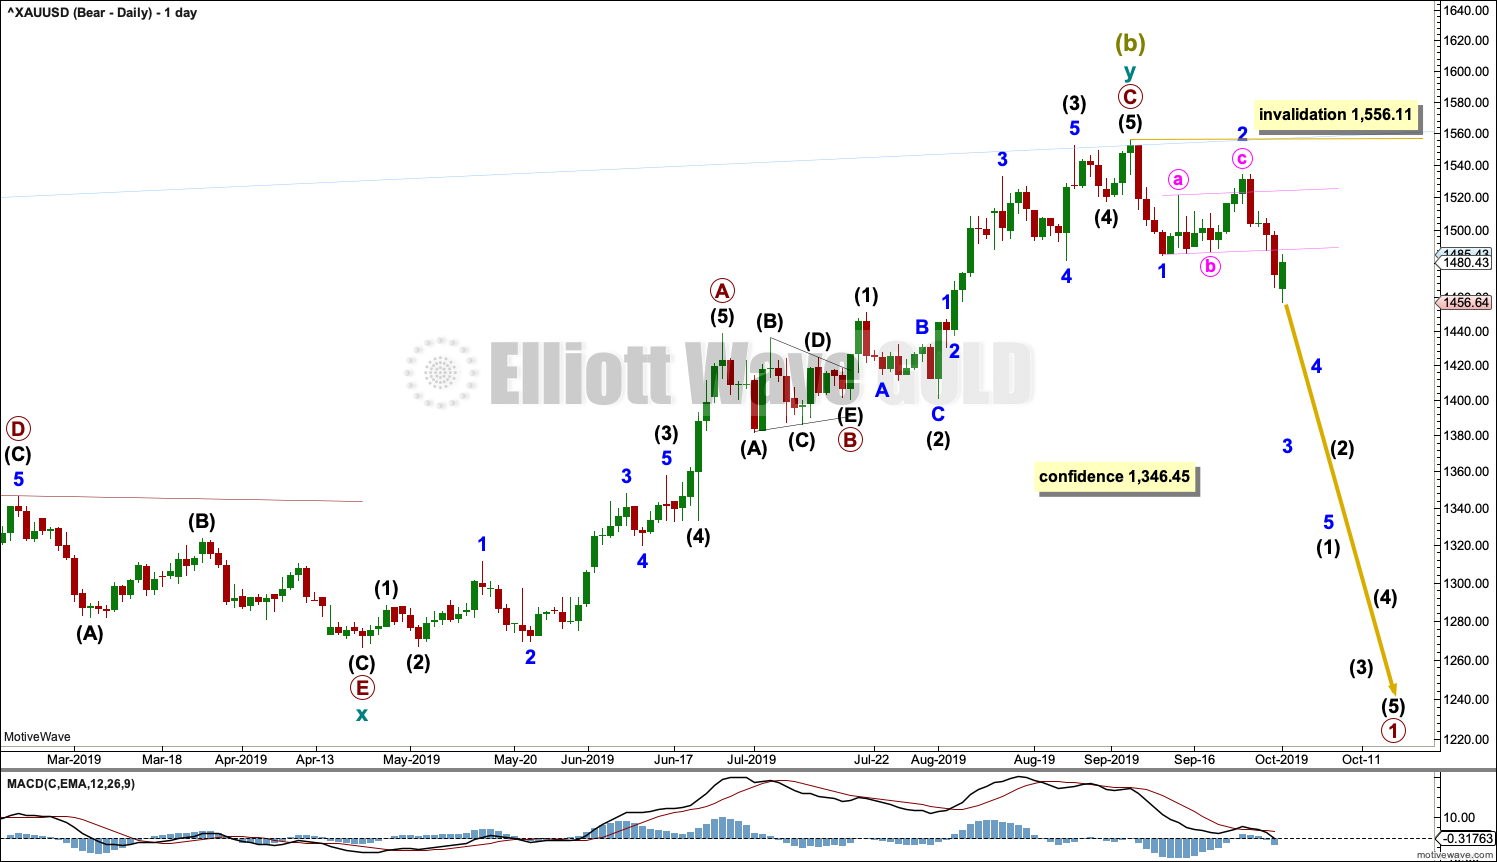
Within cycle wave y, the triangle that ended on the 17th of July may have been primary wave B. Primary wave C may have begun there. Primary wave C must subdivide as a five wave structure; it could be a complete impulse.
Within cycle wave y, there is no Fibonacci Ratio between primary waves A and C.
Draw a small channel about minor wave 2 using Elliott’s technique for a correction: draw the first trend line from the start of minute wave a to the end of minute wave b, then place a parallel copy on the end of minute wave a. A breach of this channel is a strong indication that minor wave 2 should be over and minor wave 3 should be underway. The lower edge of this channel may now provide resistance for bounces along the way down.
HOURLY CHART
Click chart to enlarge.
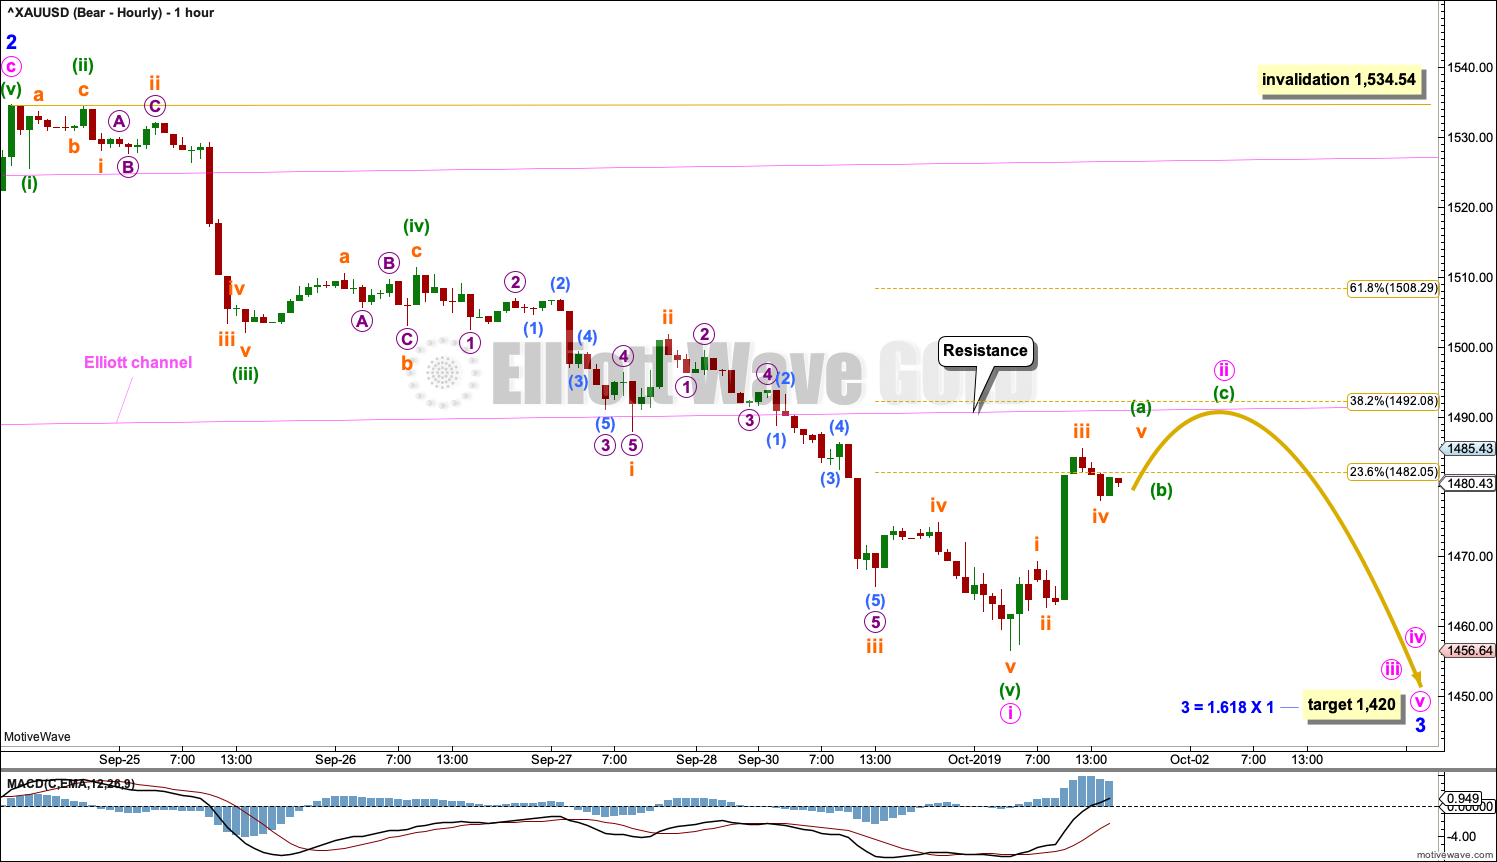
Both hourly charts see minor 3 now underway.
For both wave counts, minor wave 3 may only subdivide as an impulse. Within the impulse, minute wave i may be complete. A bounce for minute wave ii may be relatively brief and shallow. Minute wave ii may not move beyond the start of minute wave i above 1,534.54.
Minute wave ii may find resistance at the lower edge of the Elliott channel, which is copied over from the daily chart.
Minute wave ii would most likely subdivide as a zigzag. Although it is possible to label it complete at today’s high, it looks more likely to continue higher to better test resistance and reach the 0.382 Fibonacci Ratio at 1,492.08.
When minute wave ii is complete, then a third wave down at two degrees should begin. This should exhibit an increase in downwards momentum.
BULLISH ELLIOTT WAVE COUNT
WEEKLY CHART
Click chart to enlarge.
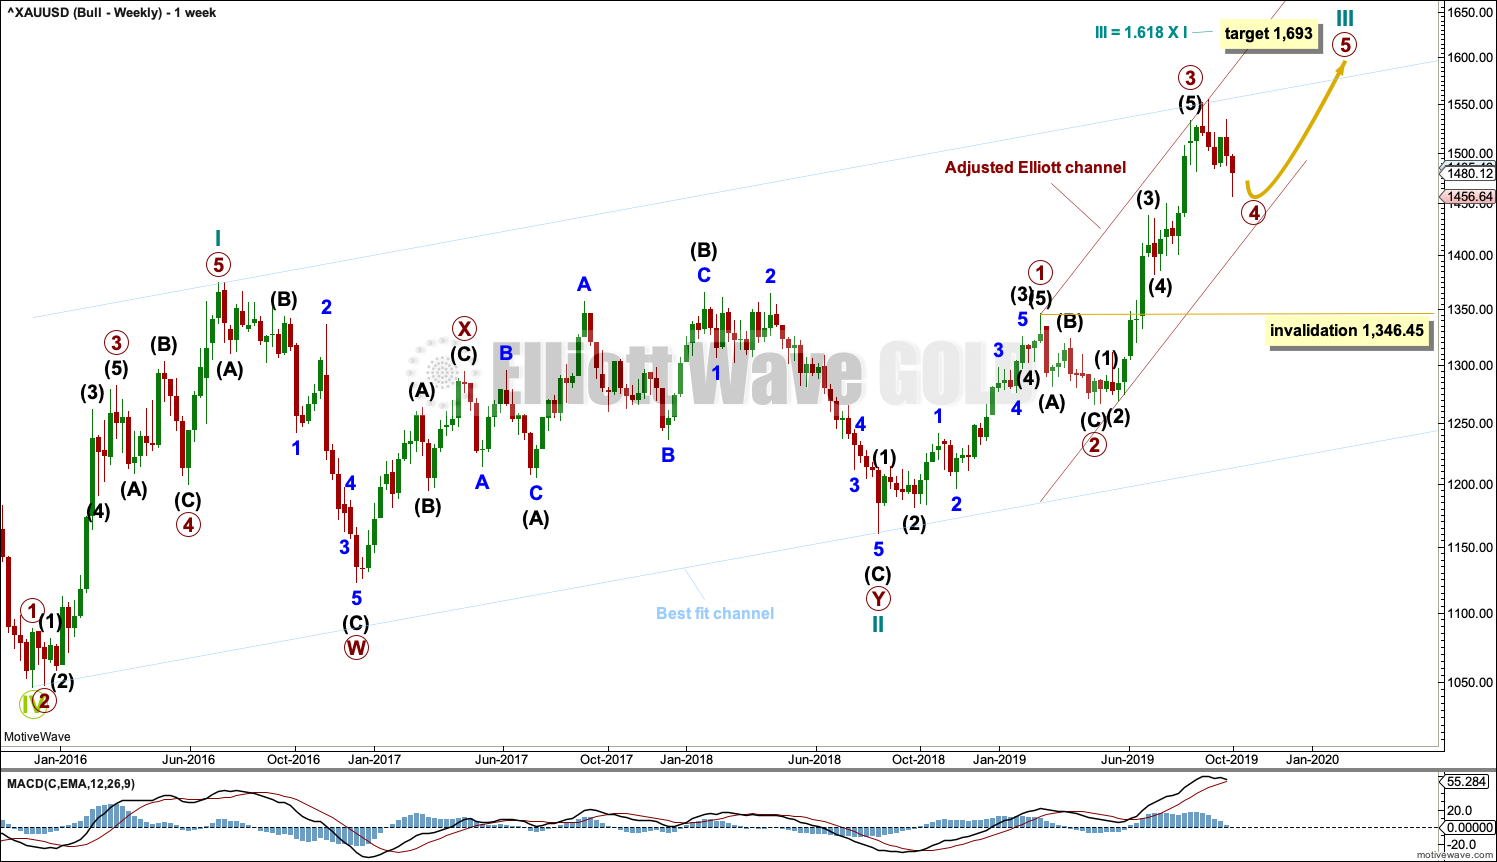
This wave count sees the the bear market complete at the last major low for Gold in November 2015.
If Gold is in a new bull market, then it should begin with a five wave structure upwards on the weekly chart. However, the biggest problem with this wave count is the structure labelled cycle wave I because this wave count must see it as a five wave structure, but it looks more like a three wave structure.
Commodities often exhibit swift strong fifth waves that force the fourth wave corrections coming just prior and just after to be more brief and shallow than their counterpart second waves. It is unusual for a commodity to exhibit a quick second wave and a more time consuming fourth wave, and this is how cycle wave I is labelled. This wave count still suffers from this very substantial problem, and for this reason the bearish wave count is still considered because it has a better fit in terms of Elliott wave structure.
Cycle wave II subdivides well as a double combination: zigzag – X – expanded flat.
Cycle wave III may have begun. Within cycle wave III, primary waves 1 and 2 may now be complete. Primary wave 3 has now moved above the end of primary wave 1 meeting a core Elliott wave rule. It has now moved far enough to allow room for primary wave 4 to unfold and remain above primary wave 1 price territory. Primary wave 4 may not move into primary wave 1 price territory below 1,346.45.
Cycle wave III so far for this wave count would have been underway now for 59 weeks. It is beginning to exhibit some support from volume and increasing ATR. This wave count now has some support from classic technical analysis.
The channel drawn about cycle wave III is an adjusted Elliott channel. The lower edge is pulled lower. Primary wave 4 may find support about the lower edge.
Add the wide best fit channel to weekly and daily charts.
DAILY CHART
Click chart to enlarge.
Primary wave 4 may be continuing as an expanded flat, which is a common corrective structure. This would see alternation in structure with the zigzag of primary wave 2.
Primary wave 2 lasted 43 sessions. Primary wave 4 may be expected to be more brief; Gold usually exhibits more brief fourth waves than their counterpart second waves. Primary wave 4 may not exhibit a Fibonacci number in duration. It may be about even in duration with primary wave 2. So far primary wave 4 has lasted 35 sessions.
Within primary wave 4, intermediate wave (C) has now moved below the end of intermediate wave (A) at 1,481.91 avoiding a truncation and a very rare running flat.
Primary wave 4 may not move into primary wave 1 price territory below 1,346.45.
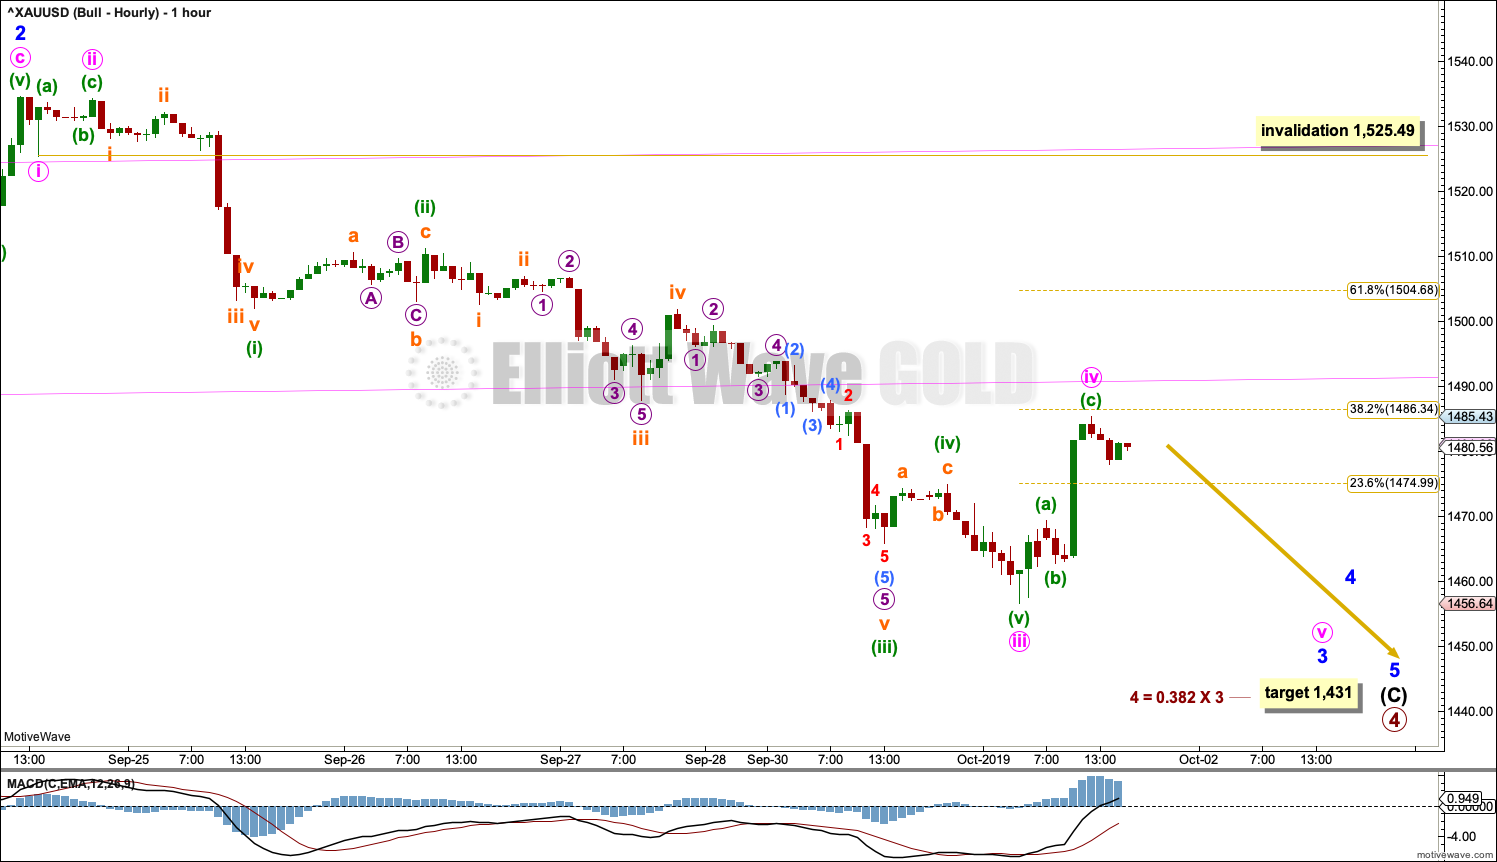
HOURLY CHART
Click chart to enlarge.
Intermediate wave (C) must complete as a five wave structure. This structure should look reasonably like a five on the daily chart. While minor wave 4 may be more brief than minor wave 2, it should still last at least one or two sessions.
This bounce is now back within minor wave 1 price territory, which has its low at 1,484.99. This bounce may not be minor wave 4 because it may not overlap minor wave 1 price territory. The degree of labelling for this bounce is moved down one degree. Minor wave 3 may be incomplete.
When minor wave 3 may again be complete for this wave count, then a bounce for minor wave 4 should unfold and remain below minor wave 1 price territory at 1,484.99.
The final target for intermediate wave (C) to complete remains the same. The structure is incomplete. It needs to continue overall lower.
TECHNICAL ANALYSIS
WEEKLY CHART
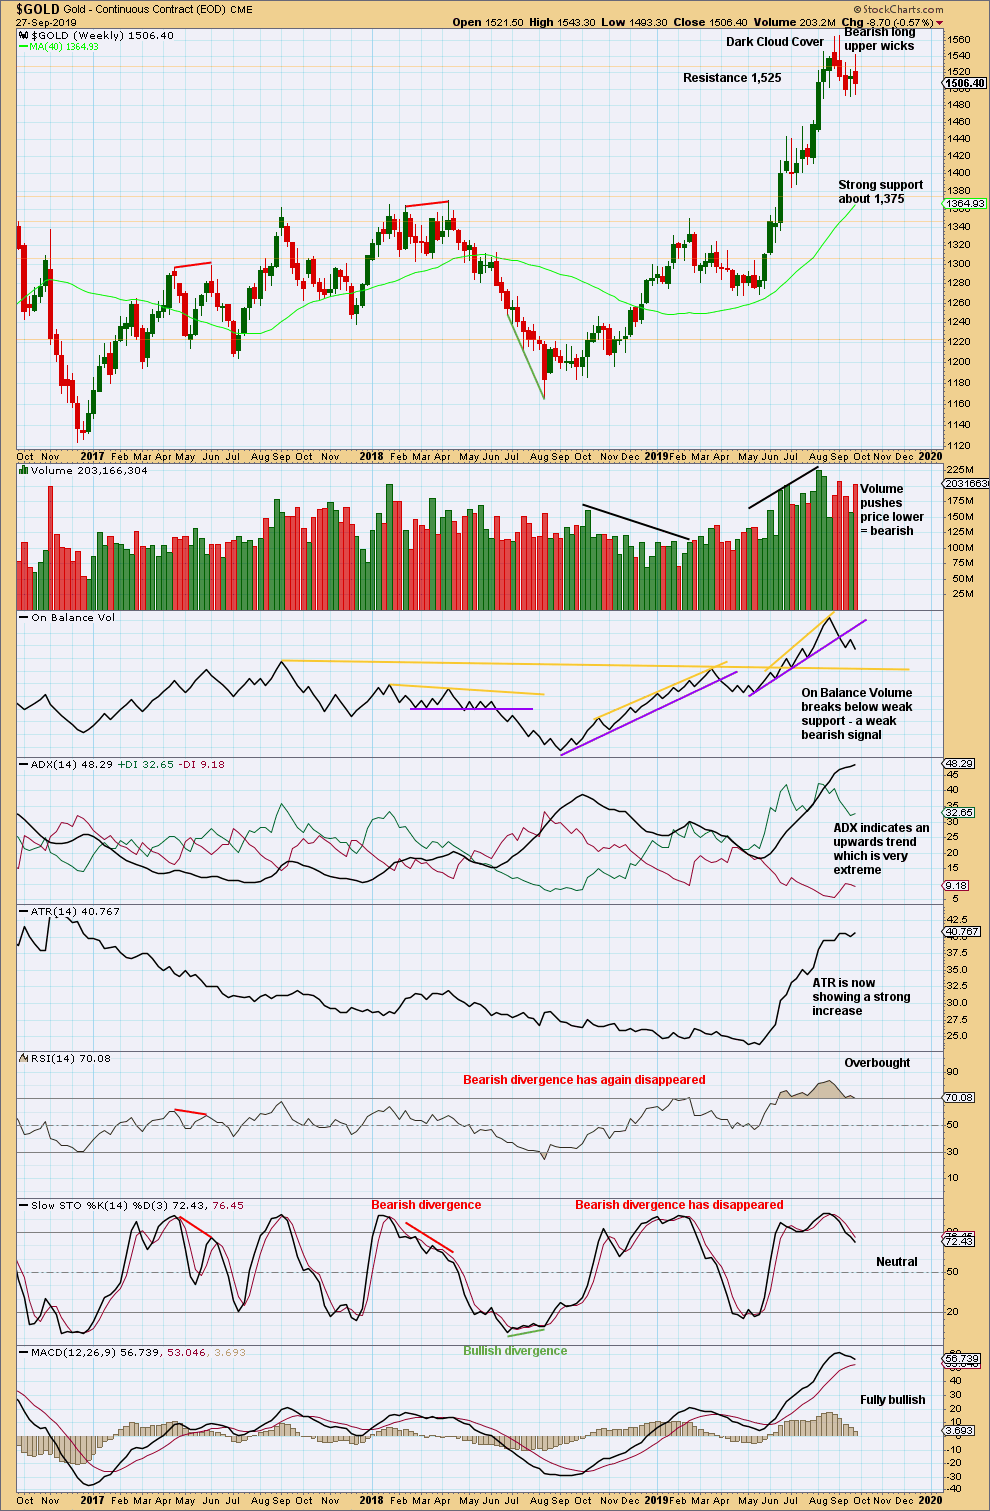
Click chart to enlarge. Chart courtesy of StockCharts.com.
When trends reach very extreme, candlestick reversal patterns should be given weight. The Dark Cloud Cover bearish reversal pattern is given more bearish weight from the long upper wick.
The risk of a major high and a trend change or a large time consuming consolidation continuing here is very high. These two scenarios effectively follow the main bearish wave count (major trend change) or bullish wave count (a large time consuming consolidation).
A weak bearish signal from On Balance Volume adds confidence to this analysis.
Last week completes an upwards week with a higher high and a higher low, but the candlestick has closed red and the balance of volume is down. Volume is pushing price lower. The longer upper wick on this weekly candlestick is also bearish.
DAILY CHART
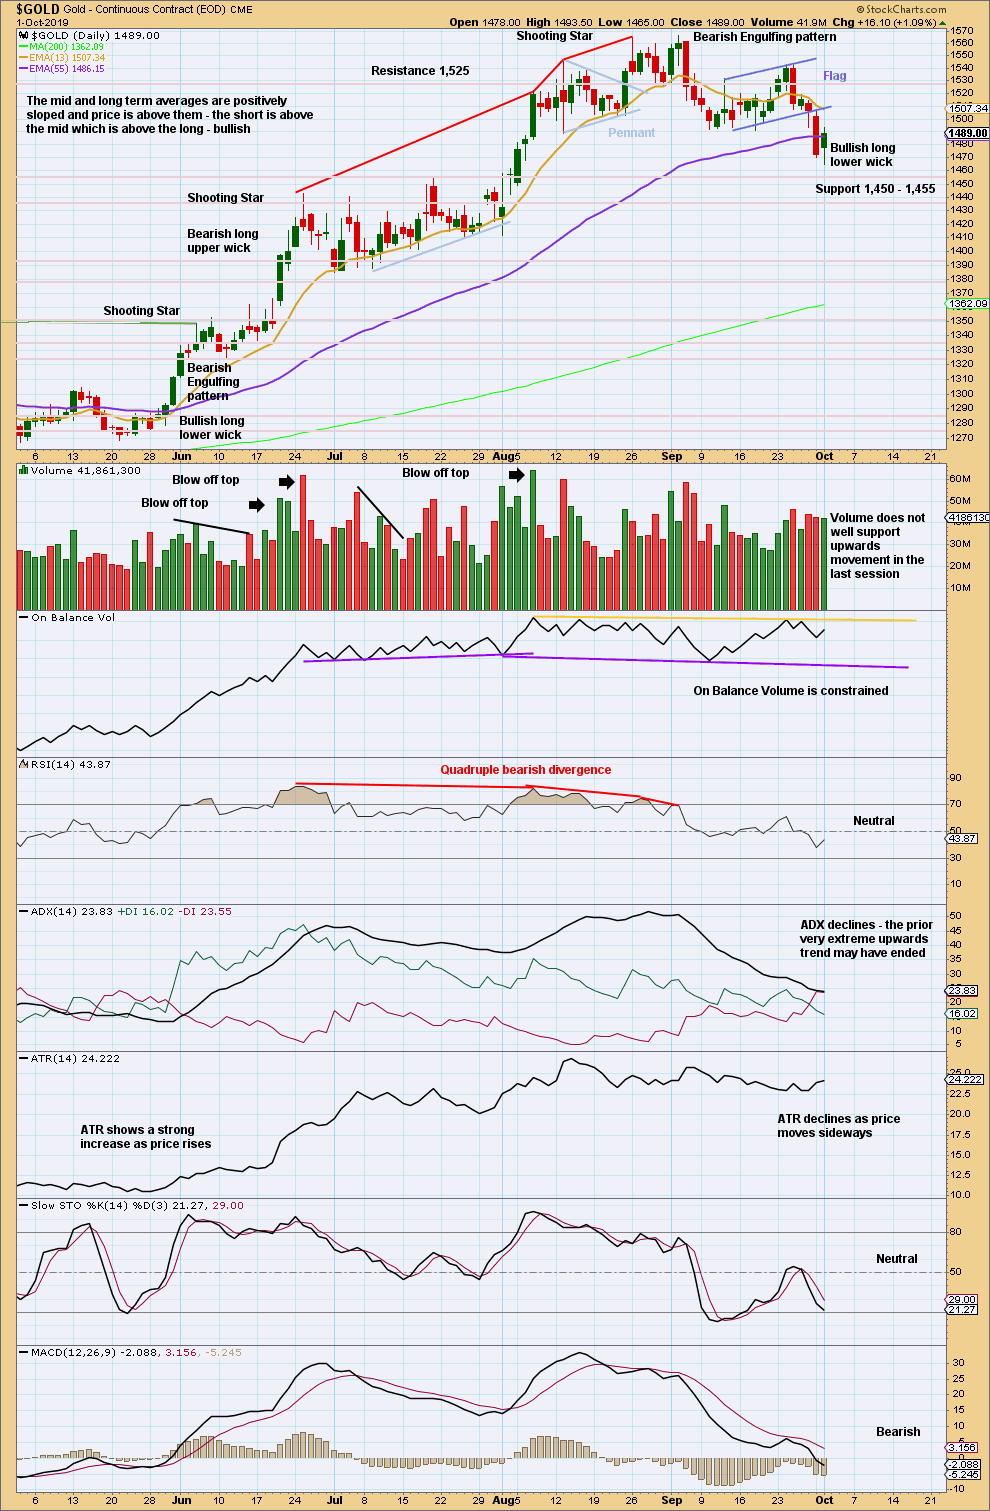
Click chart to enlarge. Chart courtesy of StockCharts.com.
A target calculated from the flag pole would be about 1,426.
There has been a downwards breakout from the flag pattern. Next support identified is about 1,455 – 1,450.
A bullish long lower wick suggests a little more upwards movement for the short term, which should be a short lived counter trend movement. Volume does not well support it.
GDX WEEKLY CHART
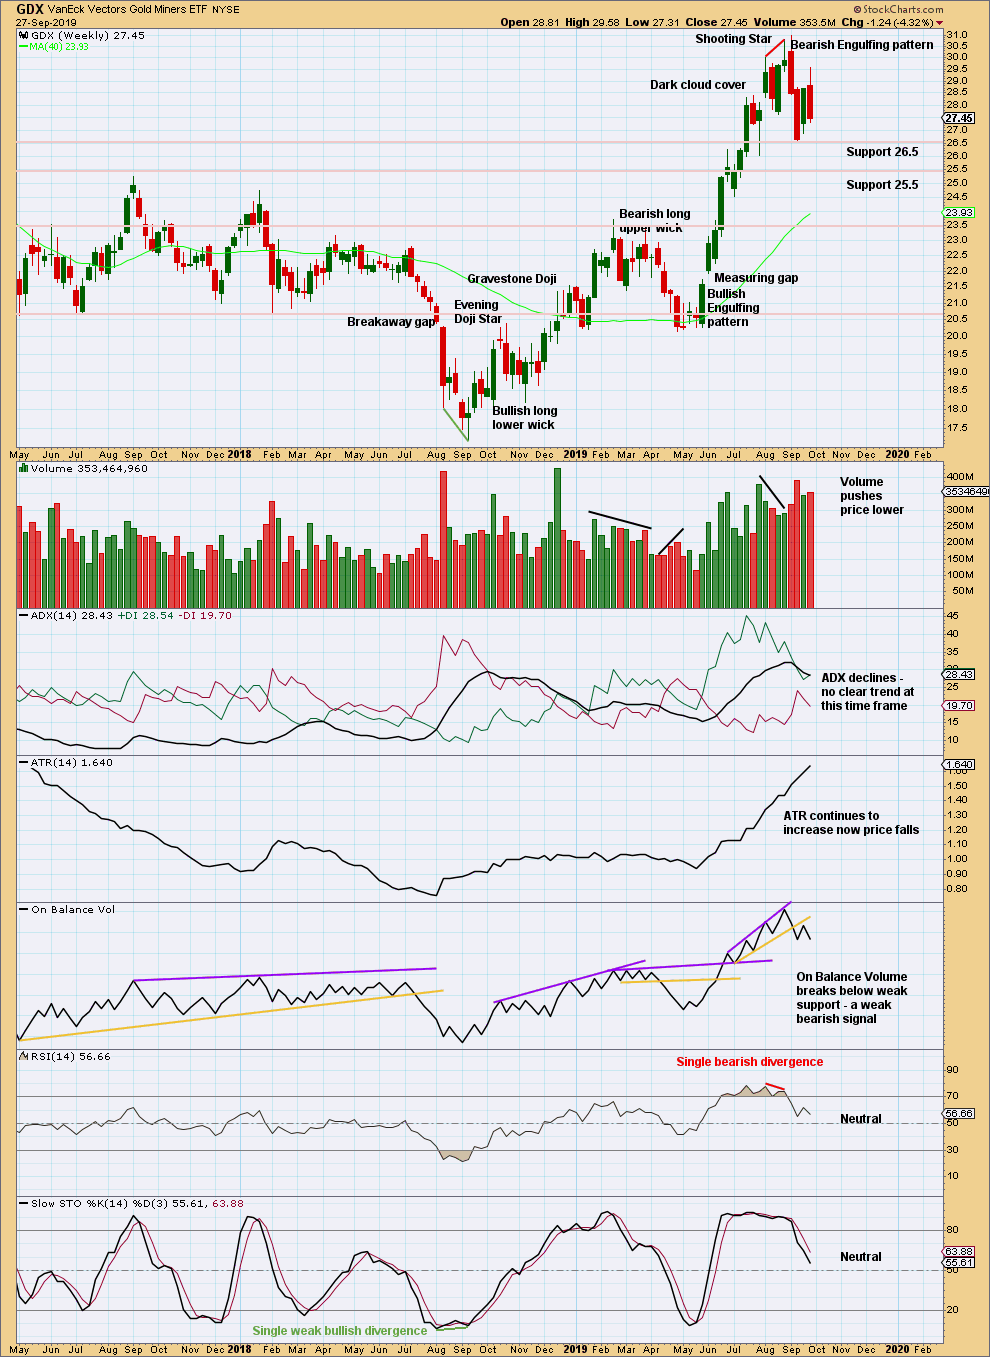
Click chart to enlarge. Chart courtesy of StockCharts.com.
Last week saw price move higher with a higher high and a higher low, but the candlestick is red and the balance of volume is down. The longer upper wick is also bearish.
GDX DAILY CHART
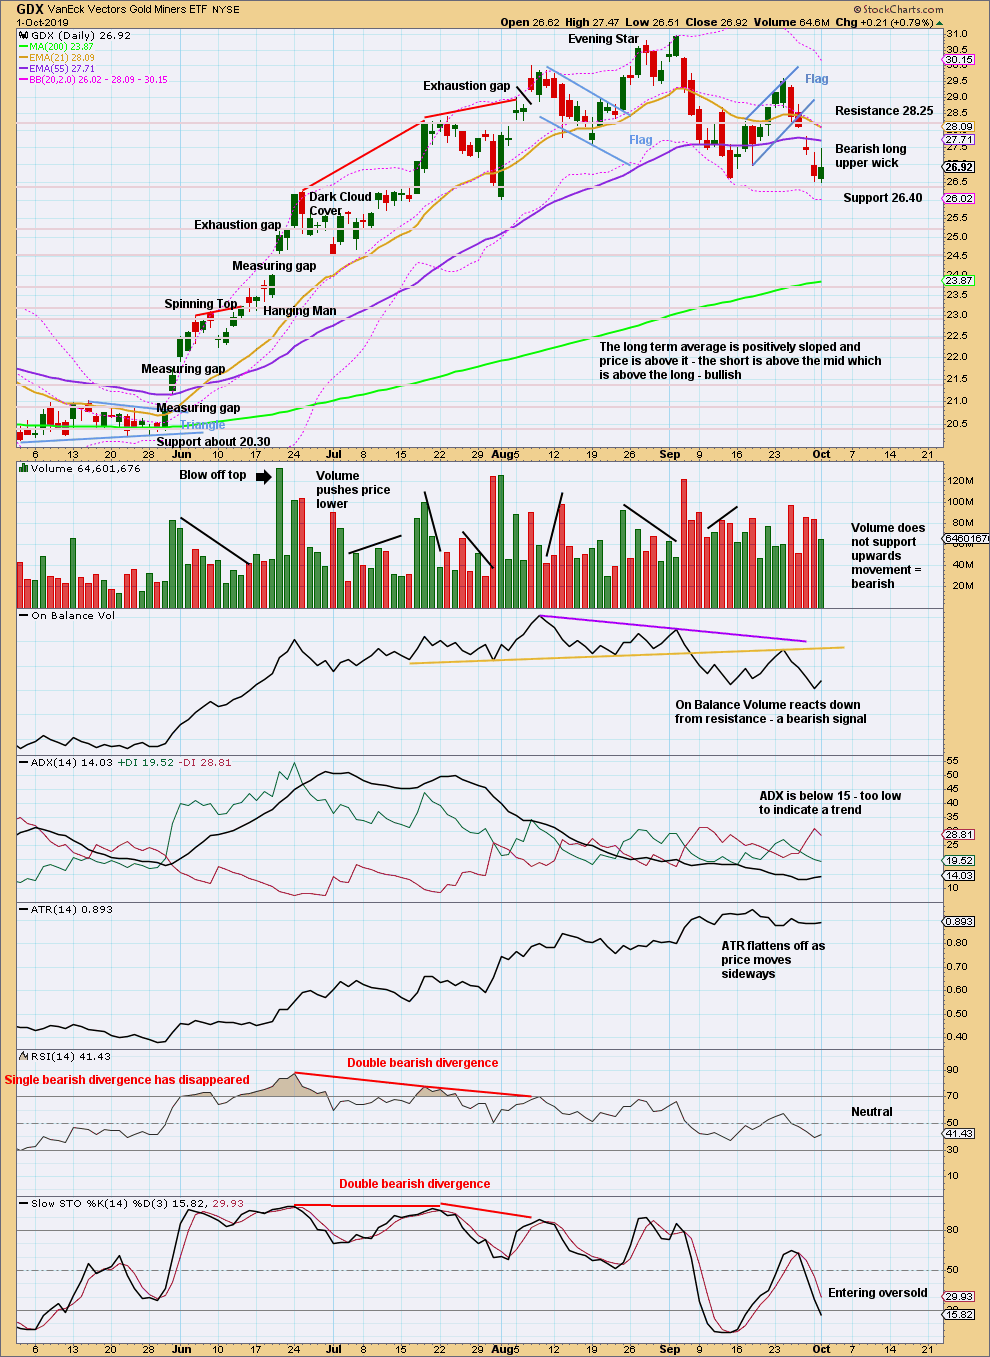
Click chart to enlarge. Chart courtesy of StockCharts.com.
A target would be at 23.87. The breakaway gap for Friday’s open should offer resistance now at 28.09.
Published @ 05:40 p.m. EST.
—
Careful risk management protects your trading account(s).
Follow my two Golden Rules:
1. Always trade with stops.
2. Risk only 1-5% of equity on any one trade.
—
New updates to this analysis are in bold.
This charts with the main fibs.
Decision time.
Coming right into the .618 at 1513.4 not looking for price to go much higher, pushing up to the 0.786 at 1526.5, then perhaps it’s a 5 wave up from the 1465.5.
I’ve placed a channel from that low, as long as price stays within that channel, then i’ll run it until it breaks the lower channel, that would be my short entry point as long as price is under the 0.618.
updated hourly chart for the bear count:
there is now a very nice double zigzag complete, falling a little short of the 0.618 Fibonacci Ratio
when resistance at the lower edge of the Elliott channel was overcome, then the next target was the 0.618 Fibonacci Ratio.
for this count the next move down should be a third wave at two degrees, it should exhibit strength and momentum.
Lara, I’m short both silver and gold currently. Regarding silver – it seems that the proposed wave 4 is awfully sharp and deep at this point. It is following Gold step by step, although in a more exaggerated fashion. Could it be that Silver is done with it’s C wave? I have this current count – is that possible? Many thanks, Robert
No, because then on the weekly chart cycle wave c of Super Cycle wave (b) would be substantially truncated, by 1.434. That’s just way too much to be acceptable.
Silver needs to see cycle wave c move above 21.062 now to avoid a truncation.
For Silver, this is the count. Primary 5 looks to have now begun. It may be time consuming with deep corrections.
Gold and Silver are not reliably correlated, and this may now be a time when they diverge. If you go back and look at their major highs and lows, you can find plenty of instances where they do not turn together.
I am aware that right now my counts for Gold and Silver diverge and this is going to make many members rather uncomfortable. Either one of my counts is wrong, which is entirely possible, or these two markets are not going to have their turns together, which is also possible. I’ll keep looking for alternate wave counts that can resolve this problem.
Gold has now retraced nearly $50 and nearly 61.8% of i of C.
I would expect the move down from here should be brutal, especially in the bearish scenario. If bullish, then the move down should find tremendous support around $1450 (where the last big breakout occurred).
I’m trying to map a scenario where gold has already made a bottom in the bullish scenario…if $1500 holds for at least 3 days, then I think the bottom is in.
I’m currently short via holding GC puts at 1460.
NFPR this Friday has the ability to pull this down brutally.
I also went short too early, but holding for now hoping it’ll be sharp reversal soon.
Getting over the neckline on the H+S is worrying me on GOLD, hopefully Lara will give some soothing analysis once she comes on today. That was supposed to act as strong resistance, but they got through quite easily. Maybe it’s all a bull trap but so far it’s gone farther than I thought – Silver too. 🙁
Having said that, if wave 3 is next it will be a doozy. 🙂
I have once again exited my long position in SI.
I’ve re-purchased GC put options in expectation of a 3rd wave down at two degrees.
I generally want to be bullish, but the set-up has a high probability of another move down…especially if 1500 can’t be retaken and held on the upside.
GLTA
I was wondering if there was any chance the low Monday was the bullish low? Seems like it was close to an earlier target.
I’m short and in profit at the moment. But the positive divergence on the daily chart worries me. (Stochastics)