
Again, downwards movement fits the main Elliott wave count best. Also, at the end of the week, volume supports the main Elliott wave count.
All three Elliott wave counts remain valid
Summary: A new low below 1,456.64 would provide confidence that the downward trend has resumed. The short-term target may be at 1,420. The main Elliott wave count still expects downwards movement next week.
A new high above 1,534.62 would add confidence to a more bullish outlook at least for the short term. The target would then be at 1,572, 1,652 or 1,693.
For the bigger picture, the bearish Elliott wave count expects a new downwards trend to last one to several years has begun already, or may begin after one more high. Confidence in this view may be had if price makes a new low by any amount at any time frame below 1,346.45.
The bullish Elliott wave count expects a primary degree fourth wave has completed and the upwards trend has resumed.
Grand SuperCycle analysis is here.
Monthly charts were last published here with video here.
BEARISH ELLIOTT WAVE COUNT
WEEKLY CHART
Click chart to enlarge.
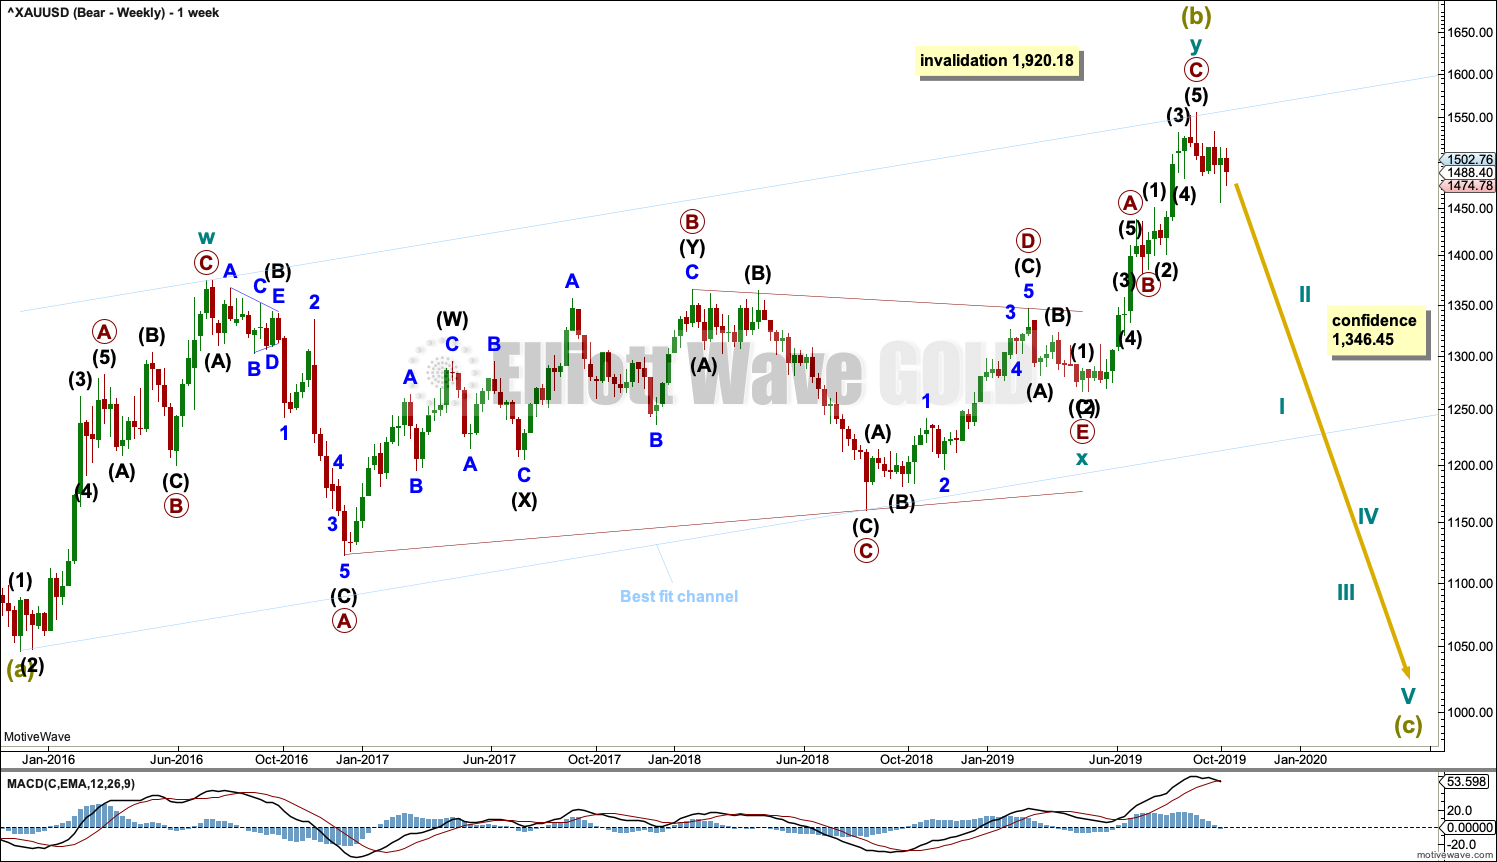
It is possible that Super Cycle wave (b) is complete as a double zigzag.
The first zigzag in the double is labelled cycle wave w. The double is joined by a three in the opposite direction, a triangle labelled cycle wave x. The second zigzag in the double is labelled cycle wave y.
The purpose of the second zigzag in a double is to deepen the correction. Cycle wave y has achieved this purpose.
A new low below 1,346.45 would add strong confidence to this wave count. At that stage, the bullish Elliott wave count would be invalidated.
A wide best fit channel is added in light blue. This channel contains all of Super Cycle wave (b) and may provide resistance and support. Copy this channel over to daily charts.
DAILY CHART
Click chart to enlarge.
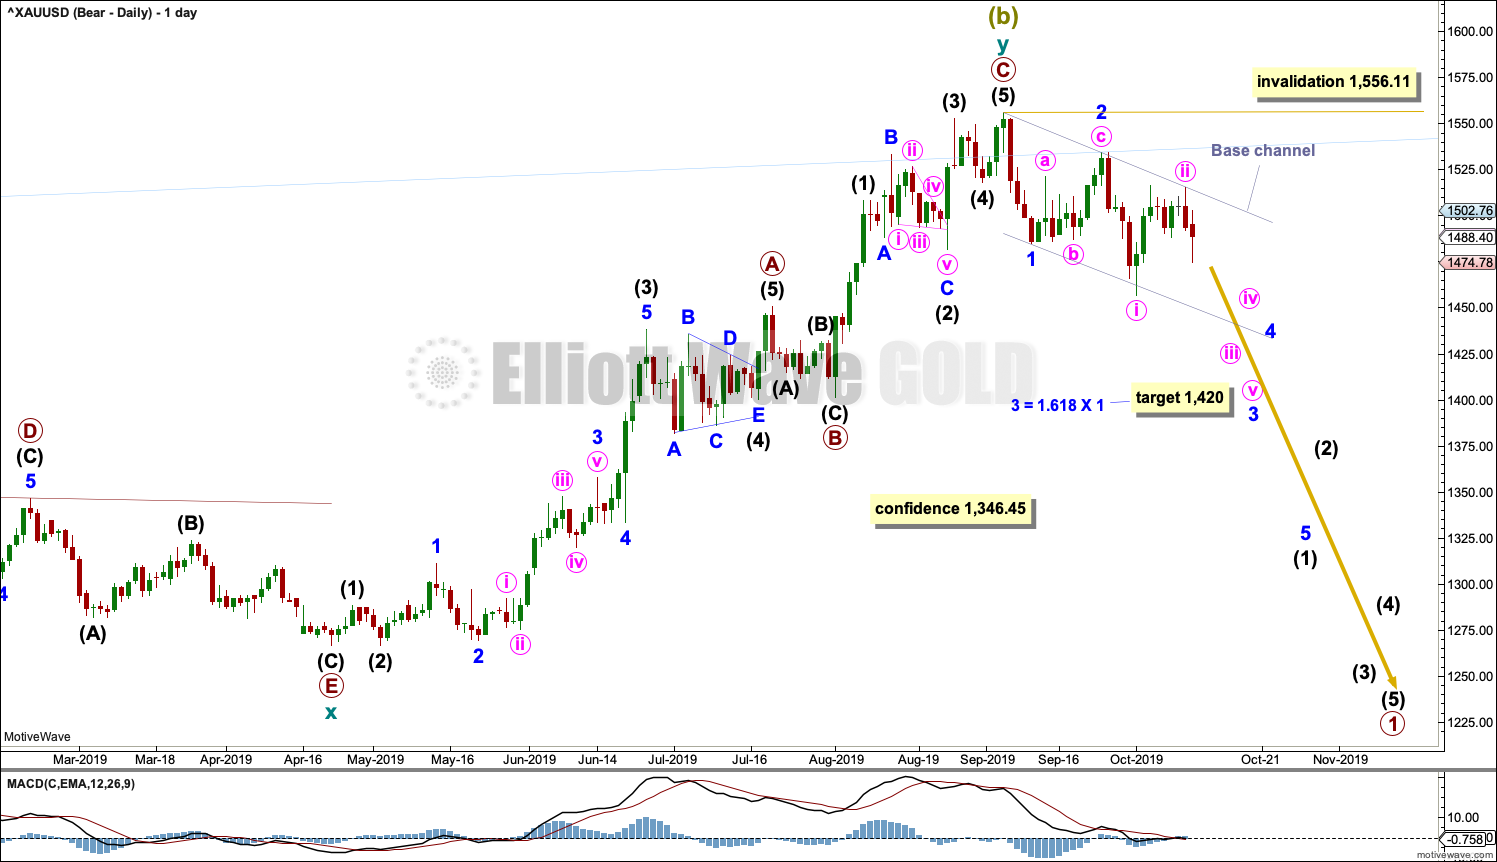
Cycle wave y may be a complete zigzag. Within both of primary waves A and C, there is good proportion between intermediate waves (2) and (4). Within both of primary waves A and C, there is good alternation in structure of intermediate waves (2) and (4).
Within cycle wave y, there is no Fibonacci Ratio between primary waves A and C.
Draw a base channel on daily and hourly charts about minor waves 1 and 2. Draw the first trend line from the start of minor wave 1 to the end of minor wave 2, then place a parallel copy on the end of minor wave 1. The upper edge of this channel is where price has found resistance this week. Along the way down, minor wave 3 should exhibit enough power to break below support at the lower edge of the base channel.
Gold usually fits within base channels at the start of new movements but not always. Occasionally second wave corrections can be deep and time consuming and can breach base channels.
HOURLY CHART
Click chart to enlarge.
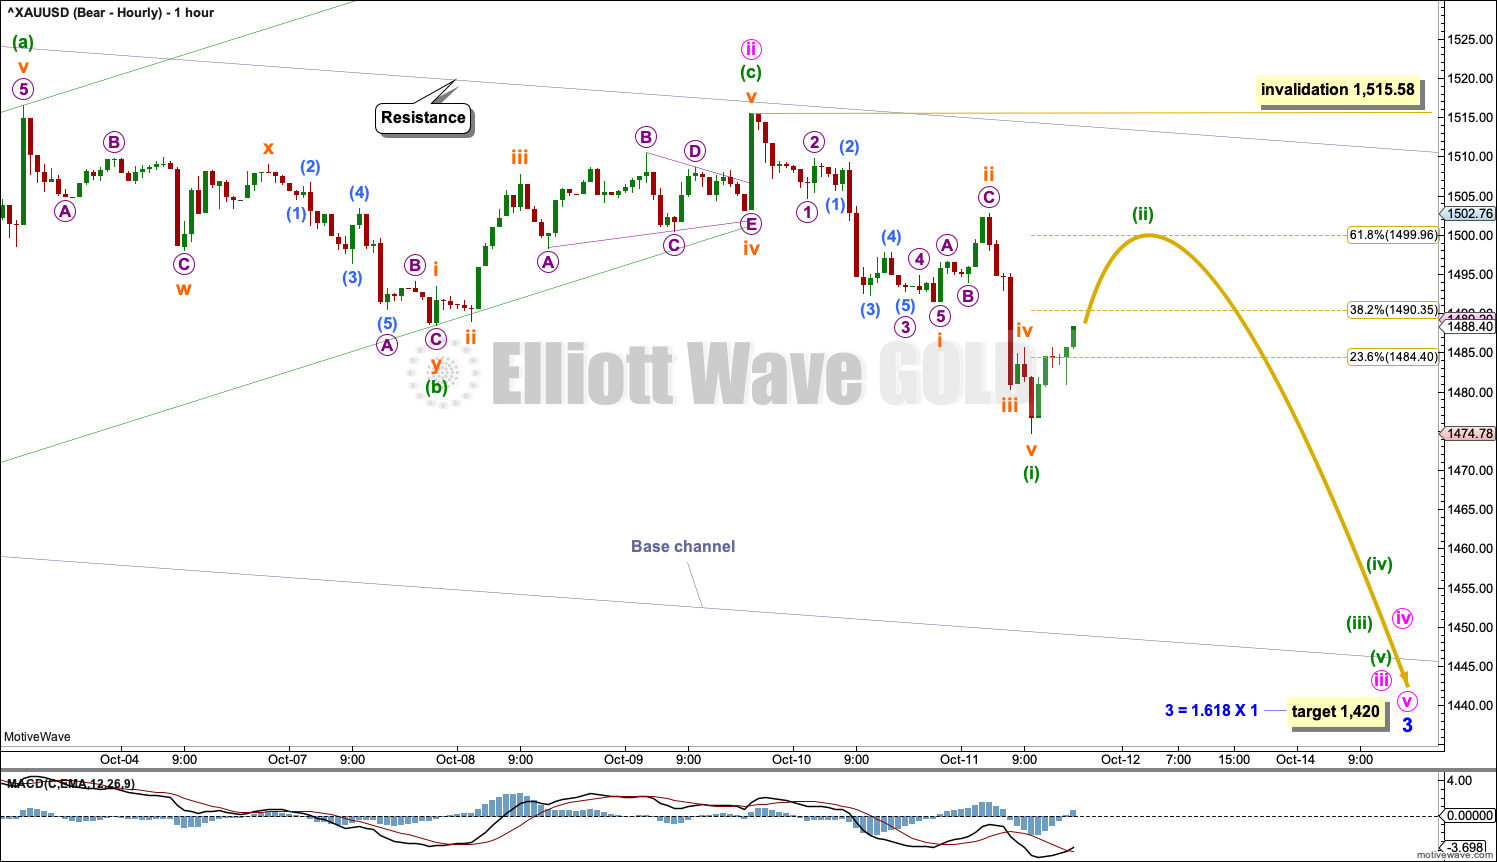
It looks like minute wave ii may now be a complete zigzag. Minuette wave (c) has moved very slightly above the end of minuette wave (a), so a truncation is avoided. Upwards movement ended almost perfectly at the upper edge of the base channel.
There may now be two overlapping first and second waves complete from the high on 4th of September. This wave count now expects to see an increase in downwards momentum. Some increase in volume pushing price lower supports this wave count.
Minor wave 3 may only subdivide as an impulse. Within minor wave 3, no second wave correction may move beyond the start of its first wave above 1,556.11.
Minuette wave (ii) may end about the 0.618 Fibonacci Ratio of minuette wave (i).
ALTERNATE DAILY CHART
Click chart to enlarge.
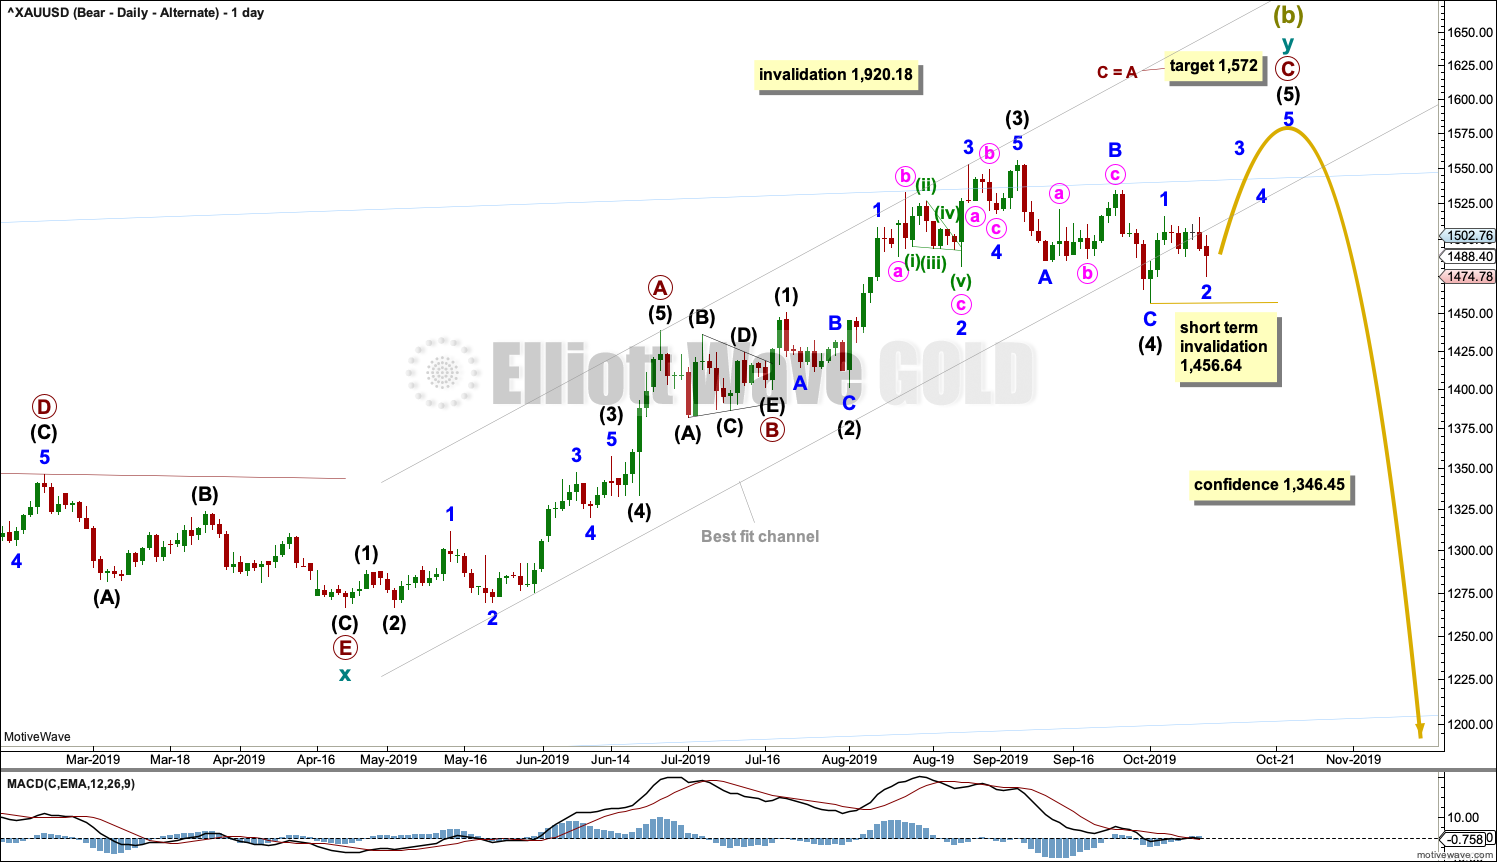
This wave count exactly follows the expected pathway for Silver. If your own analysis suggests these markets should move together (although the correlation co-efficient shows they do not always do so), then this may be your preferred Elliott wave count.
It is possible that the double zigzag for Super Cycle wave (b) may be incomplete and may yet require one more high. A target is calculated for primary wave C to reach the most common Fibonacci Ratio of equality in length with primary wave A.
Within primary wave C, intermediate wave (3) fits very well as an impulse: There is no overlap between minor waves 4 and 2; minor wave 3 is not the shortest actionary wave; minor wave 5 is not truncated; and minor wave 4 exhibits alternation with minor wave 2 as an expanded flat and minor wave 4 as a zigzag. Minor wave 3 is 4.47 longer than 0.618 the length of minor wave 1, and minor wave 5 is 2.83 short of 0.382 the length of minor wave 1. Minor wave 4 is more brief than minor wave 2, which is normal for this market.
Intermediate wave (4) is longer in duration than intermediate wave (2), but the difference is reasonable enough to be acceptable.
Within intermediate wave (5), no second wave correction may move beyond the start of its first wave below 1,456.64.
BULLISH ELLIOTT WAVE COUNT
WEEKLY CHART
Click chart to enlarge.
This wave count sees the the bear market complete at the last major low for Gold in November 2015.
If Gold is in a new bull market, then it should begin with a five wave structure upwards on the weekly chart. However, the biggest problem with this wave count is the structure labelled cycle wave I because this wave count must see it as a five wave structure, but it looks more like a three wave structure.
Commodities often exhibit swift strong fifth waves that force the fourth wave corrections coming just prior and just after to be more brief and shallow than their counterpart second waves. It is unusual for a commodity to exhibit a quick second wave and a more time consuming fourth wave, and this is how cycle wave I is labelled. This wave count still suffers from this very substantial problem, and for this reason the bearish wave count is still considered because it has a better fit in terms of Elliott wave structure.
Cycle wave II subdivides well as a double combination: zigzag – X – expanded flat.
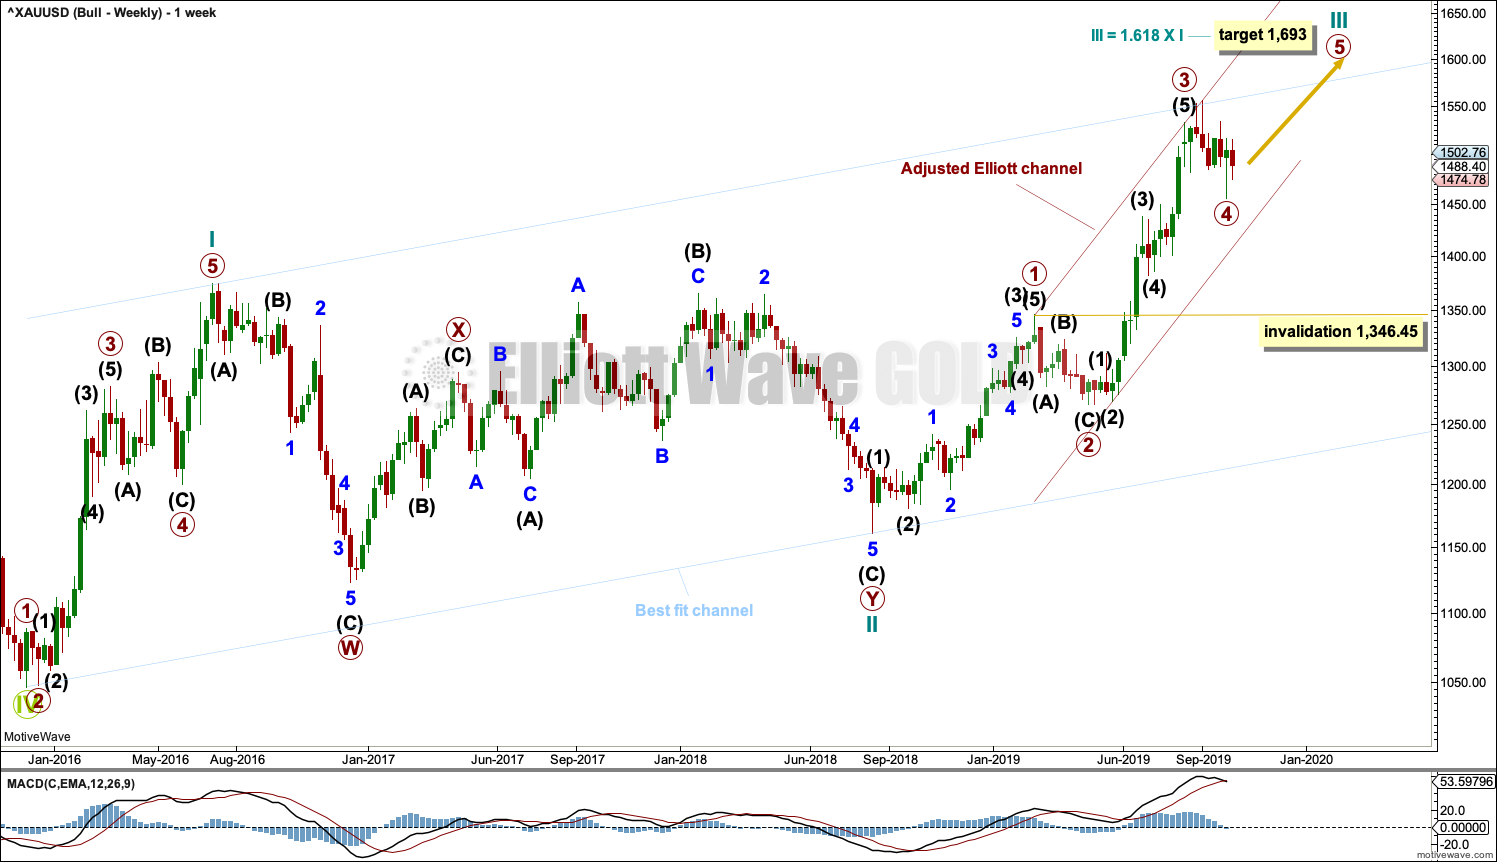
Cycle wave III may have begun. Within cycle wave III, primary waves 1 and 2 may now be complete. Primary wave 3 has now moved above the end of primary wave 1 meeting a core Elliott wave rule. It has now moved far enough to allow room for primary wave 4 to unfold and remain above primary wave 1 price territory. Primary wave 4 may not move into primary wave 1 price territory below 1,346.45.
Cycle wave III so far for this wave count would have been underway now for 60 weeks. It is beginning to exhibit some support from volume and increasing ATR. This wave count now has some support from classic technical analysis.
The channel drawn about cycle wave III is an adjusted Elliott channel. The lower edge is pulled lower.
Add the wide best fit channel to weekly and daily charts.
DAILY CHART

Click chart to enlarge.
Primary wave 4 is labelled as possibly complete. The structure still fits as a flat correction, but it may be complete as a regular flat. Within the flat, intermediate wave (B) may fit as a double combination: flat – X – zigzag. Intermediate wave (C) has moved below the end of intermediate wave (A) avoiding a truncation and a very rare running flat.
Primary wave 2 lasted 43 sessions. Primary wave 4 may have been over in 35 sessions, one longer than a Fibonacci 34.
It is also possible that primary wave 4 may be incomplete and may continue lower. Primary wave 4 may not move into primary wave 1 price territory below 1,346.45.
HOURLY CHART
Click chart to enlarge.
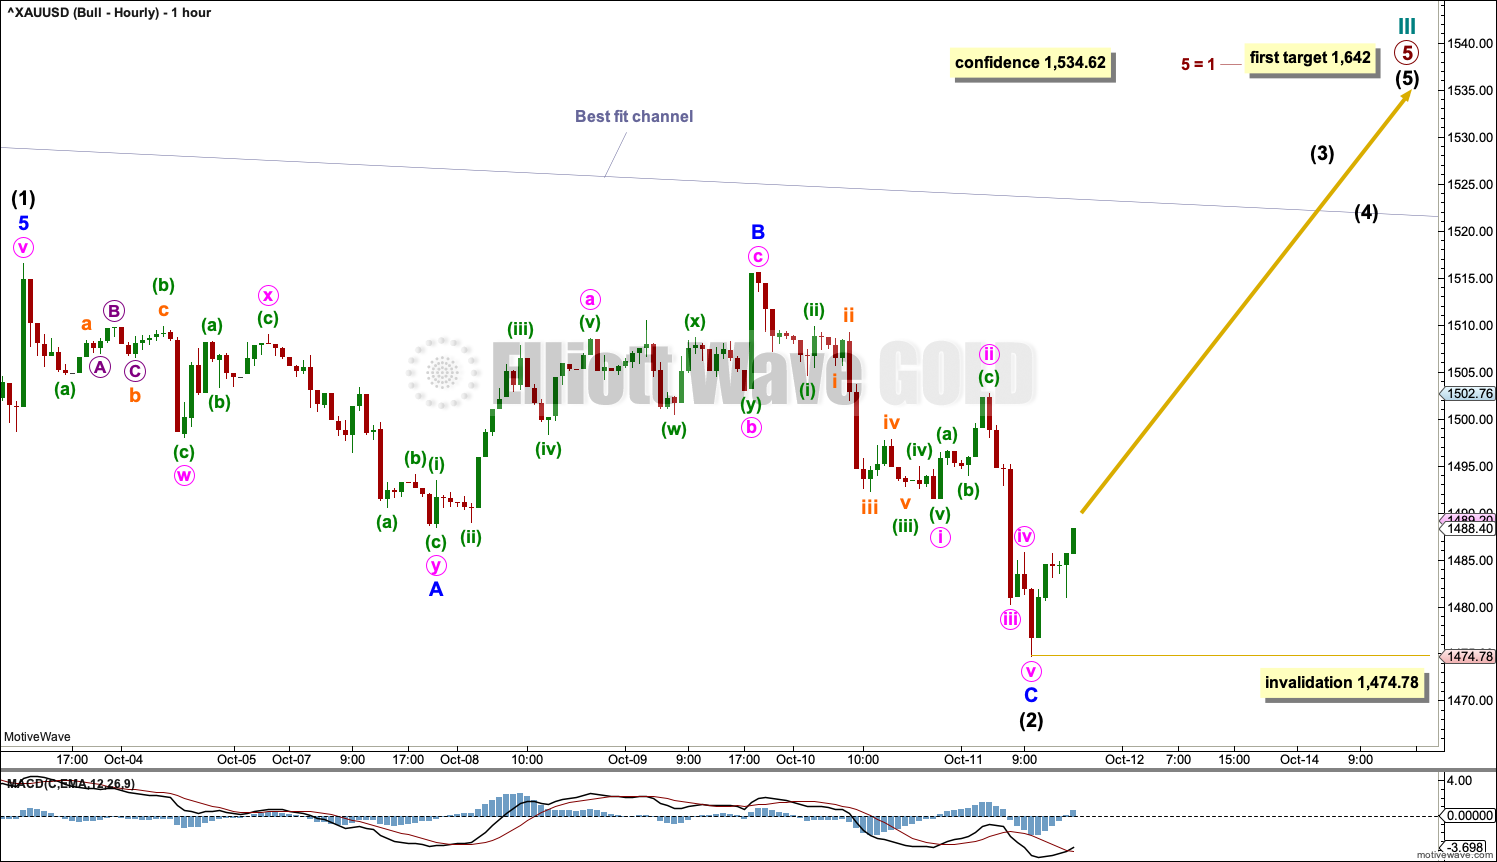
Primary wave 4 may be complete and primary wave 5 upwards may be underway. Primary wave 5 may subdivide either as an impulse or an ending diagonal. An impulse is much more likely.
Within the impulse, intermediate waves (1) and (2) may be complete.
Intermediate wave (3) may have begun. Within intermediate wave (3), no second wave correction may move beyond the start of its first wave below 1,474.78.
TECHNICAL ANALYSIS
WEEKLY CHART
Click chart to enlarge. Chart courtesy of StockCharts.com.
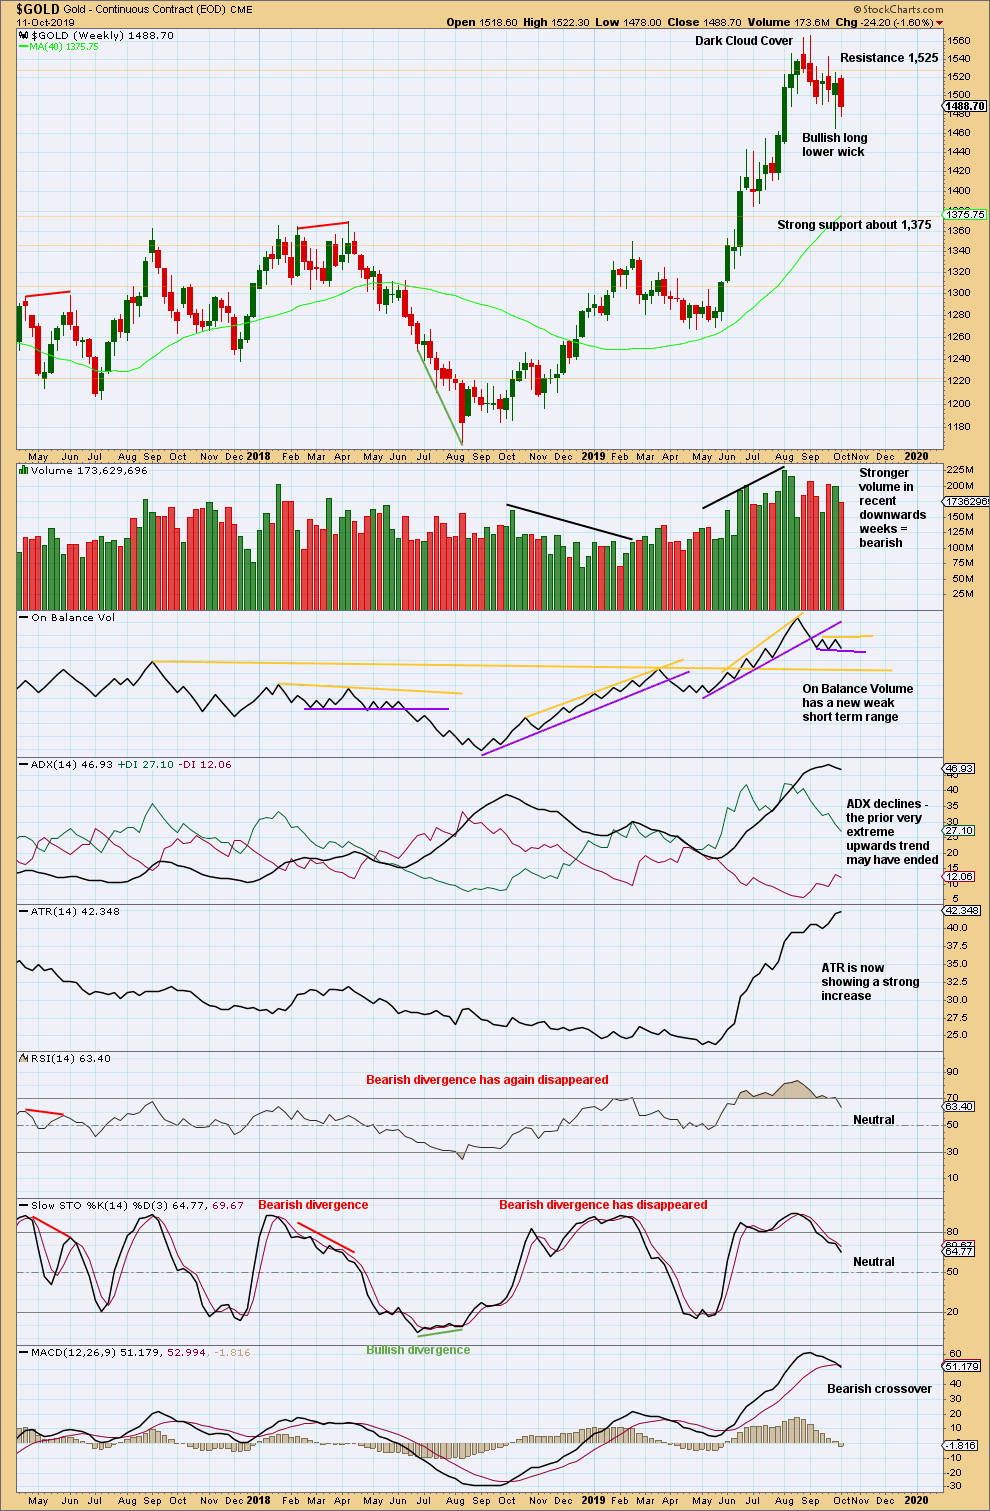
When trends reach very extreme, candlestick reversal patterns should be given weight. The Dark Cloud Cover bearish reversal pattern is given more bearish weight from the long upper wick.
This pullback has brought RSI and Stochastics down from overbought and ADX down from very extreme. It looks like a high may be in place for Gold, but it is also possible that one final high may yet be seen before a major trend change.
DAILY CHART
Click chart to enlarge. Chart courtesy of StockCharts.com.
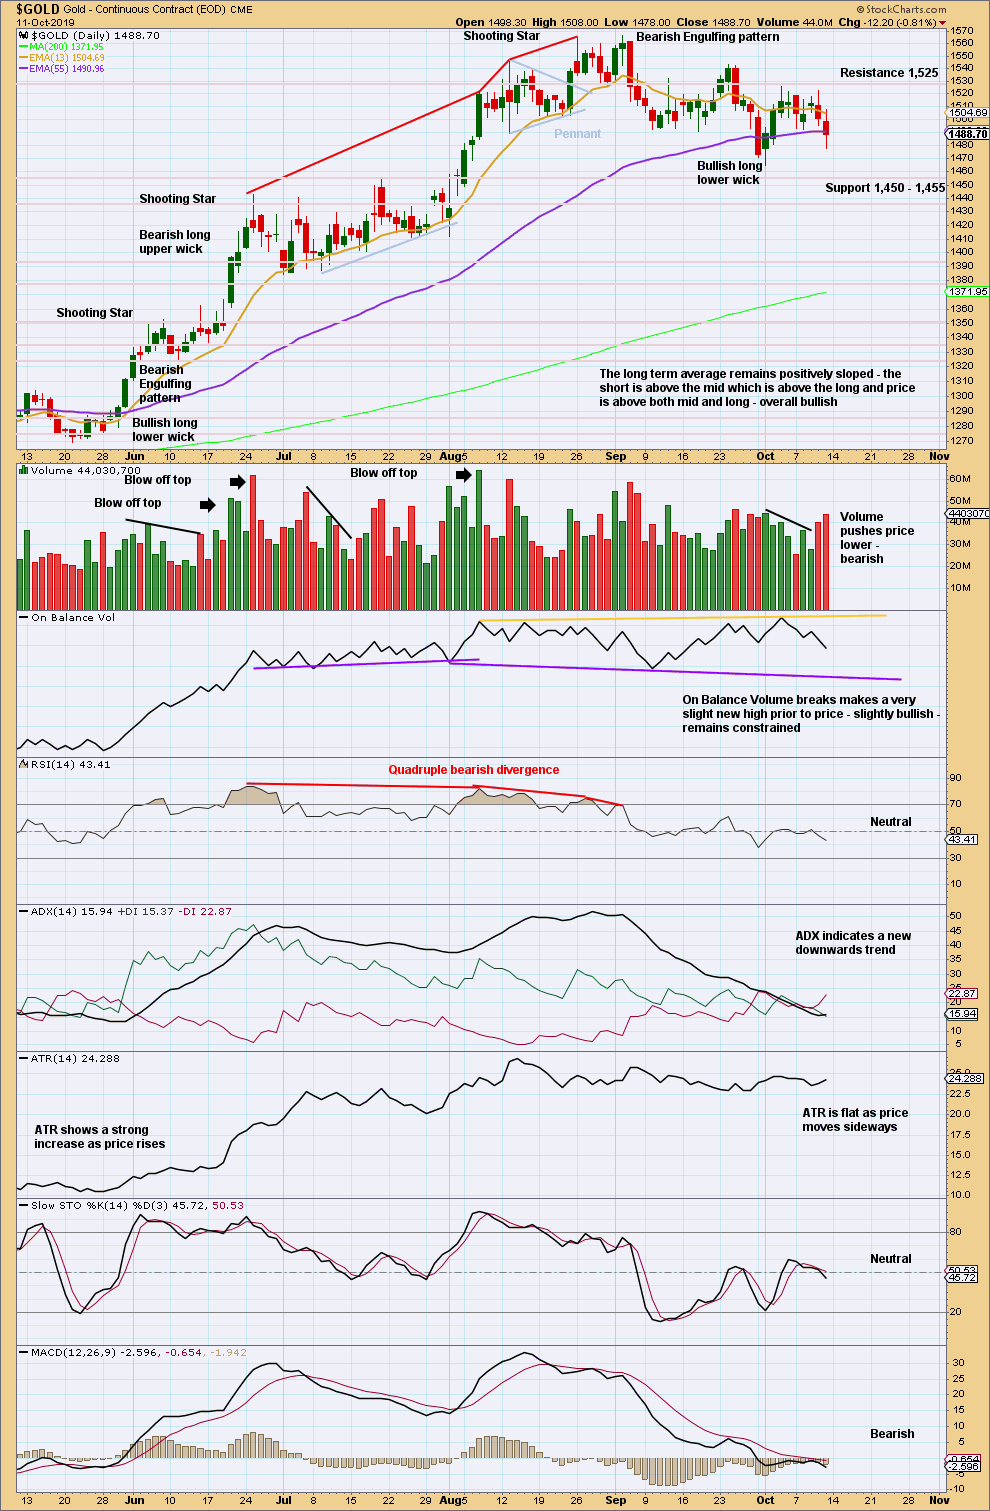
Since the last high on the 4th of September, there has been a new swing low (on the 30th of September) and now a series of (so far) two lower swing lows and two lower swing highs. In conjunction with a very strong Bearish Engulfing pattern on the 5th of September and the prior upwards trend reaching very extreme, it looks like Gold may have had a trend change.
Price is range bound at the moment. A new low below 1,465 may be a downwards breakout. A new high above 1,543.30 may be an upwards breakout.
Some support from volume pushing price lower supports the view that a downwards breakout may be imminent.
GDX WEEKLY CHART
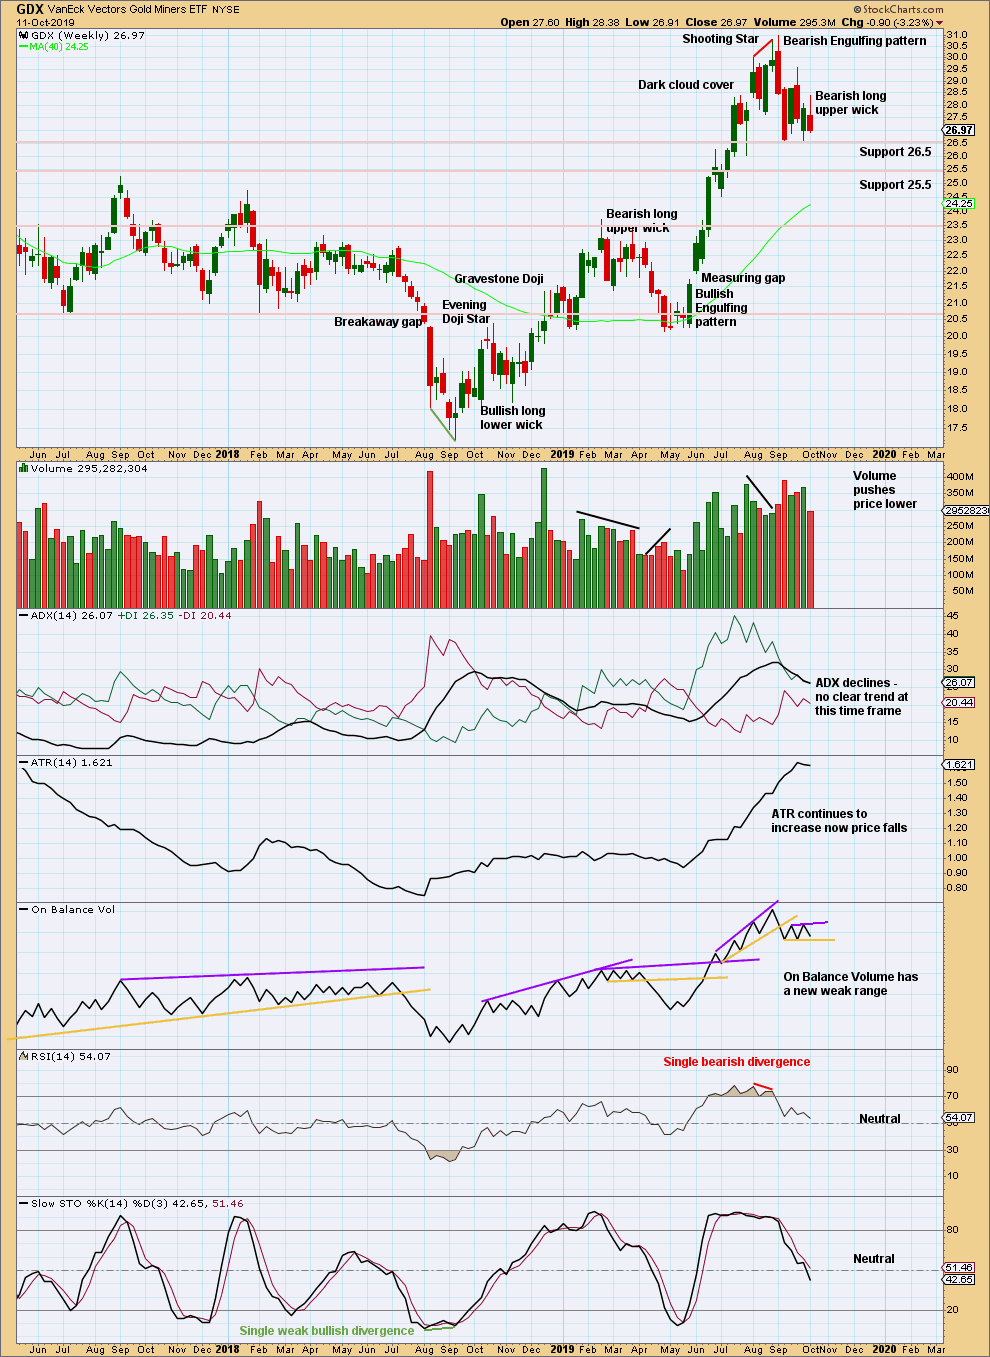
Click chart to enlarge. Chart courtesy of StockCharts.com.
This weekly candlestick is bearish.
GDX DAILY CHART
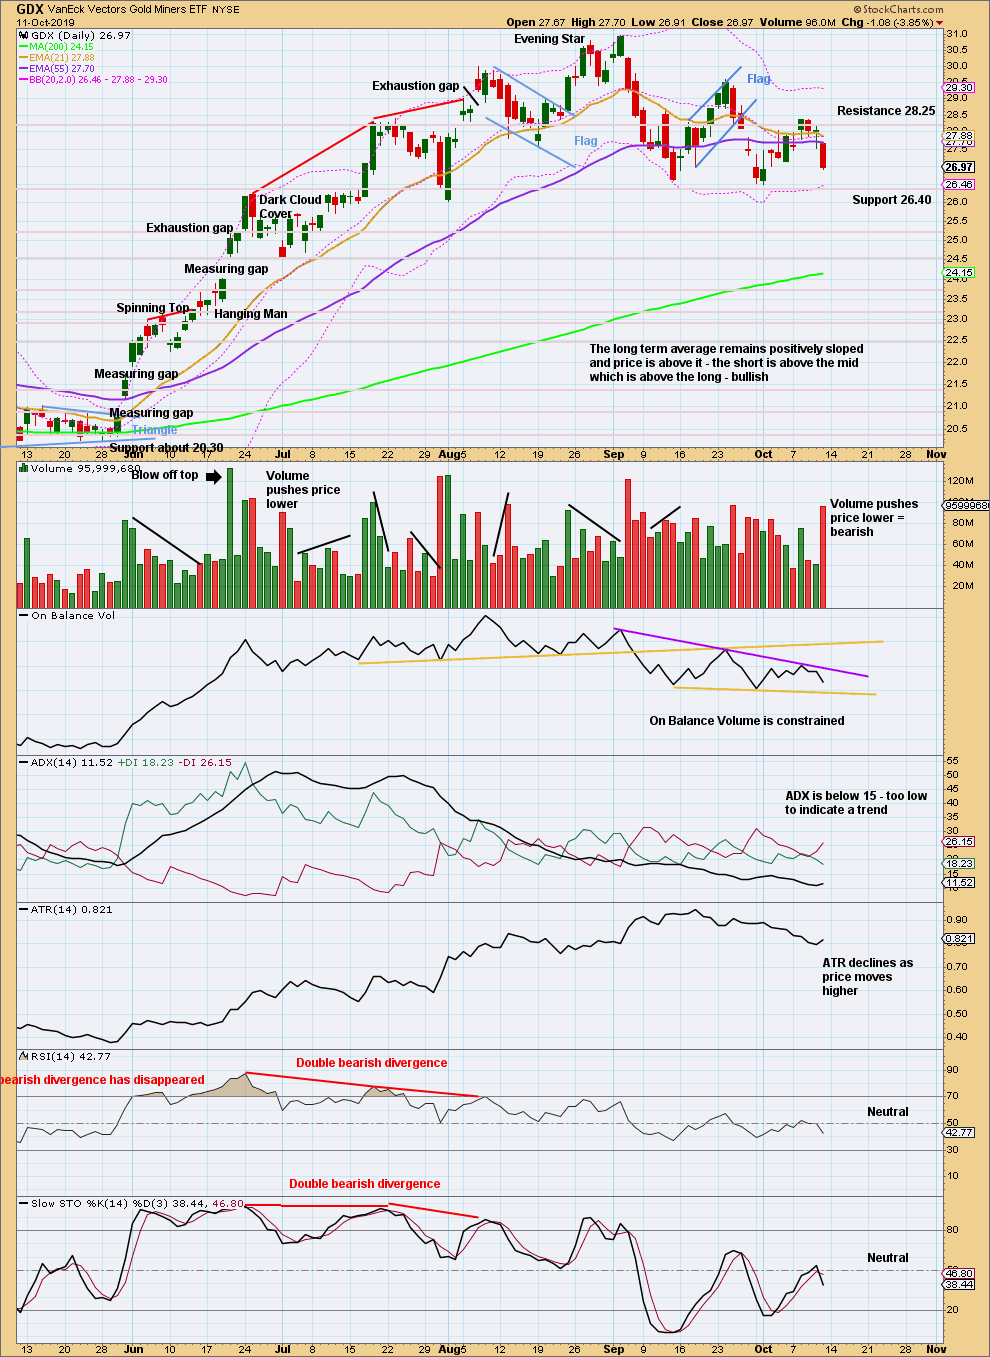
Click chart to enlarge. Chart courtesy of StockCharts.com.
Overall, it still looks most likely that a high is in place for GDX. Look for downwards movement to find support at identified horizontal support lines.
Published @ 10:20 p.m. EST.
—
Careful risk management protects your trading account(s).
Follow my two Golden Rules:
1. Always trade with stops.
2. Risk only 1-5% of equity on any one trade.
—
New updates to this analysis are in bold.
Lara, thanks for reminder on possible similarities between gold and silver charts–silver is a great 2nd opinion I have neglected lately.
Gold spiked through the .5 fib and I took a short there. Is it unusual for gold to only get to to .5? I see most of the retracements you notate are .618 but I’ve been told that .5 is also quite typical.
https://www.tradingview.com/x/xkfgXOTr/
Thank you – have we got any insight to when Gold and Silver will take their separate paths, if they are to do so?
if they do take separate paths then it’s now
silver should be moving to new highs above early September highs, while gold should not
hourly bear chart updated:
with the USA on holiday for Columbus Day today the markets should be expected to be quiet
Hi Lara
Wrong attachment.
Thanks
oops! so sorry
here it is
hourly bull update
A-B-C of a zigzag subdivides 5-3-5, which is exactly the same as 1-2-3 of an impulse
sell signal on gold this AM? seems to be following the bear hourly chart very well.
they both look okay
charts above