
Price remains range bound. The ascending triangle remains valid.
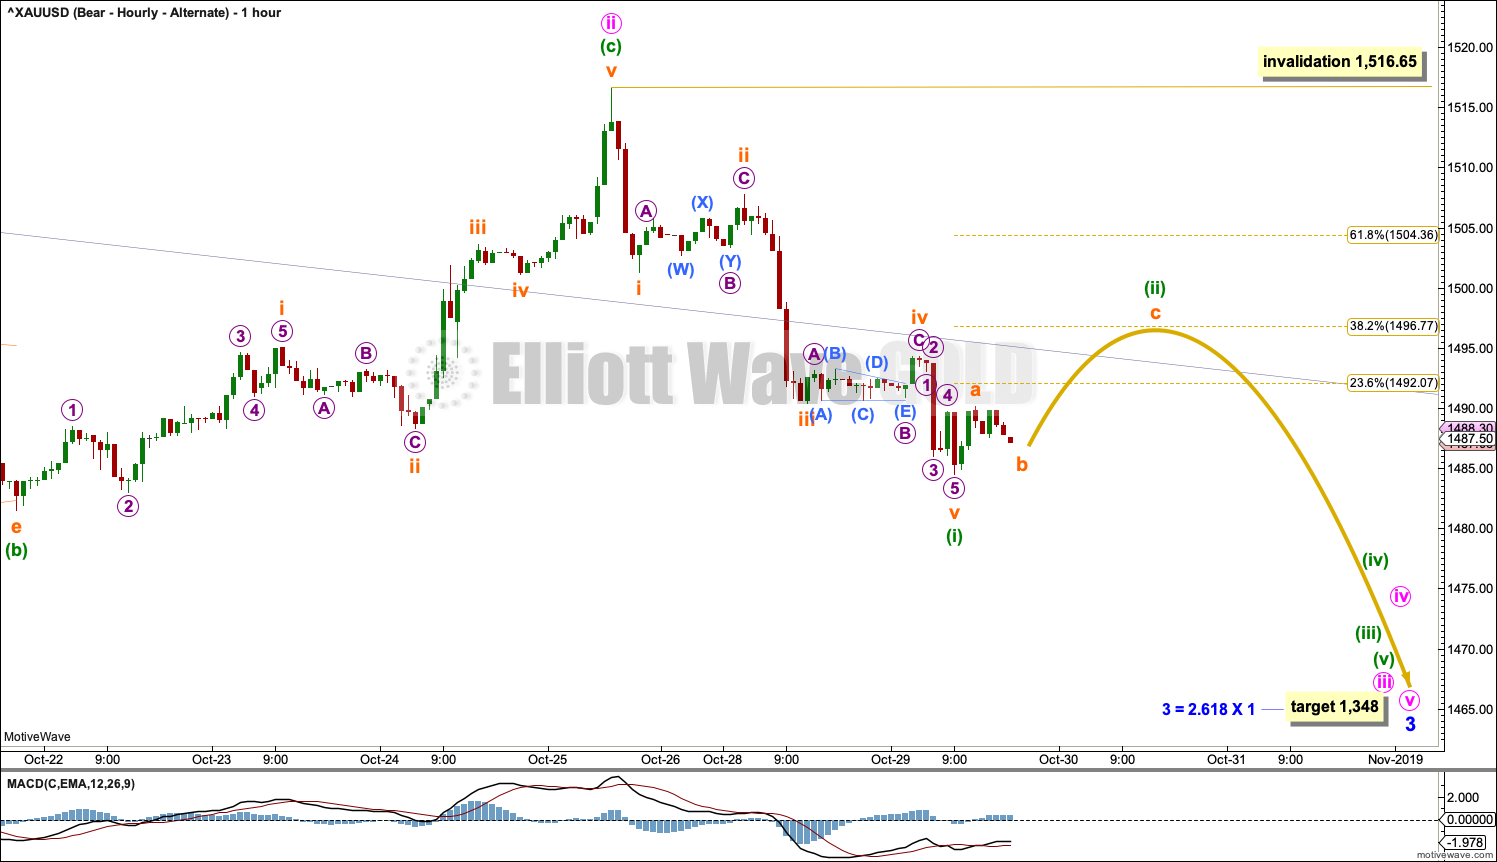
Summary: For the very short term, a new low below 1,481.55 would add confidence in a more bearish outlook. The target would be at 1,348.
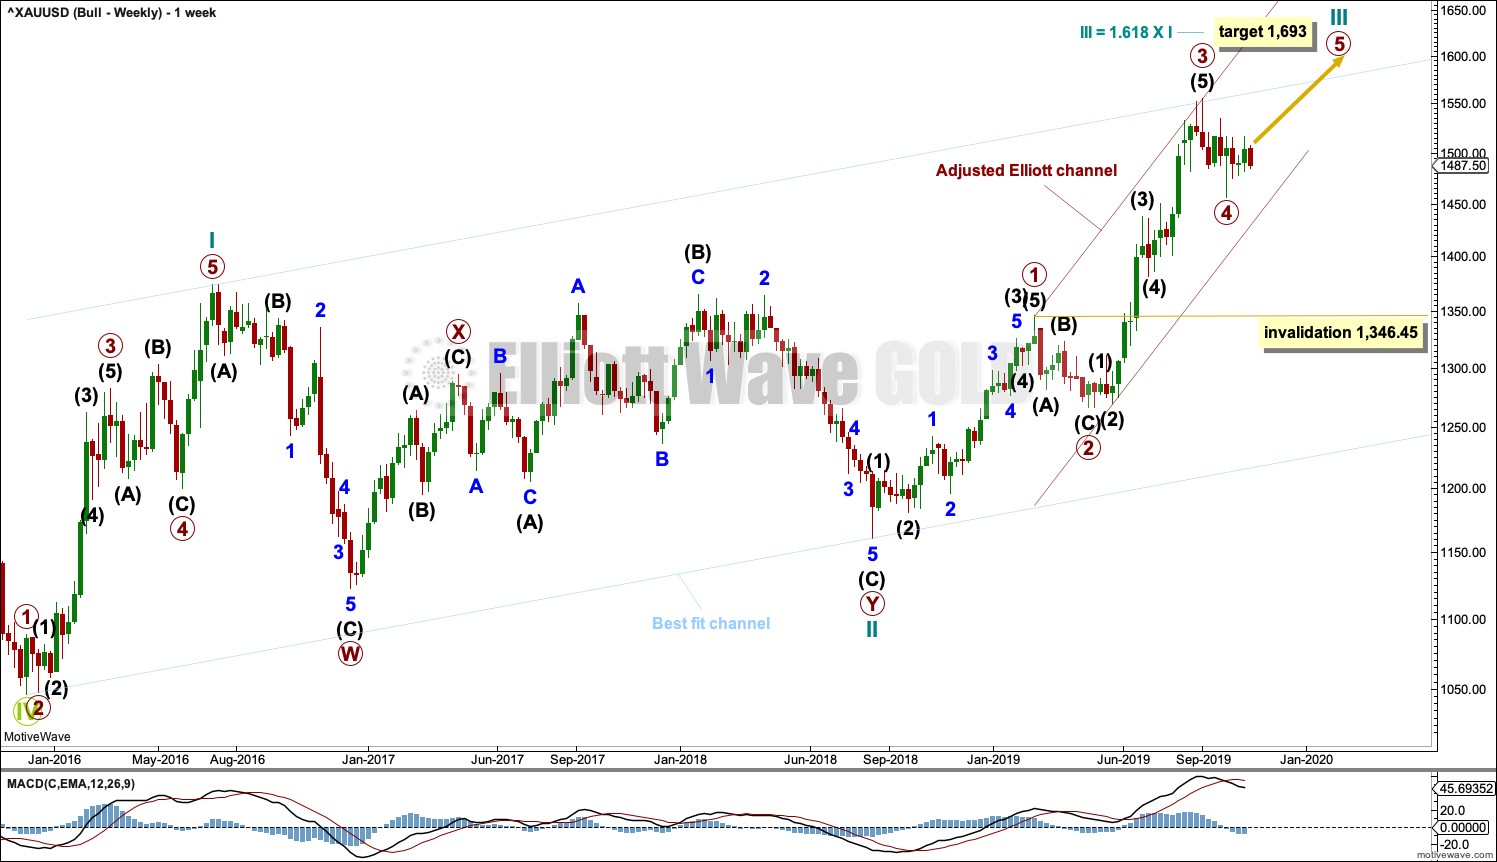
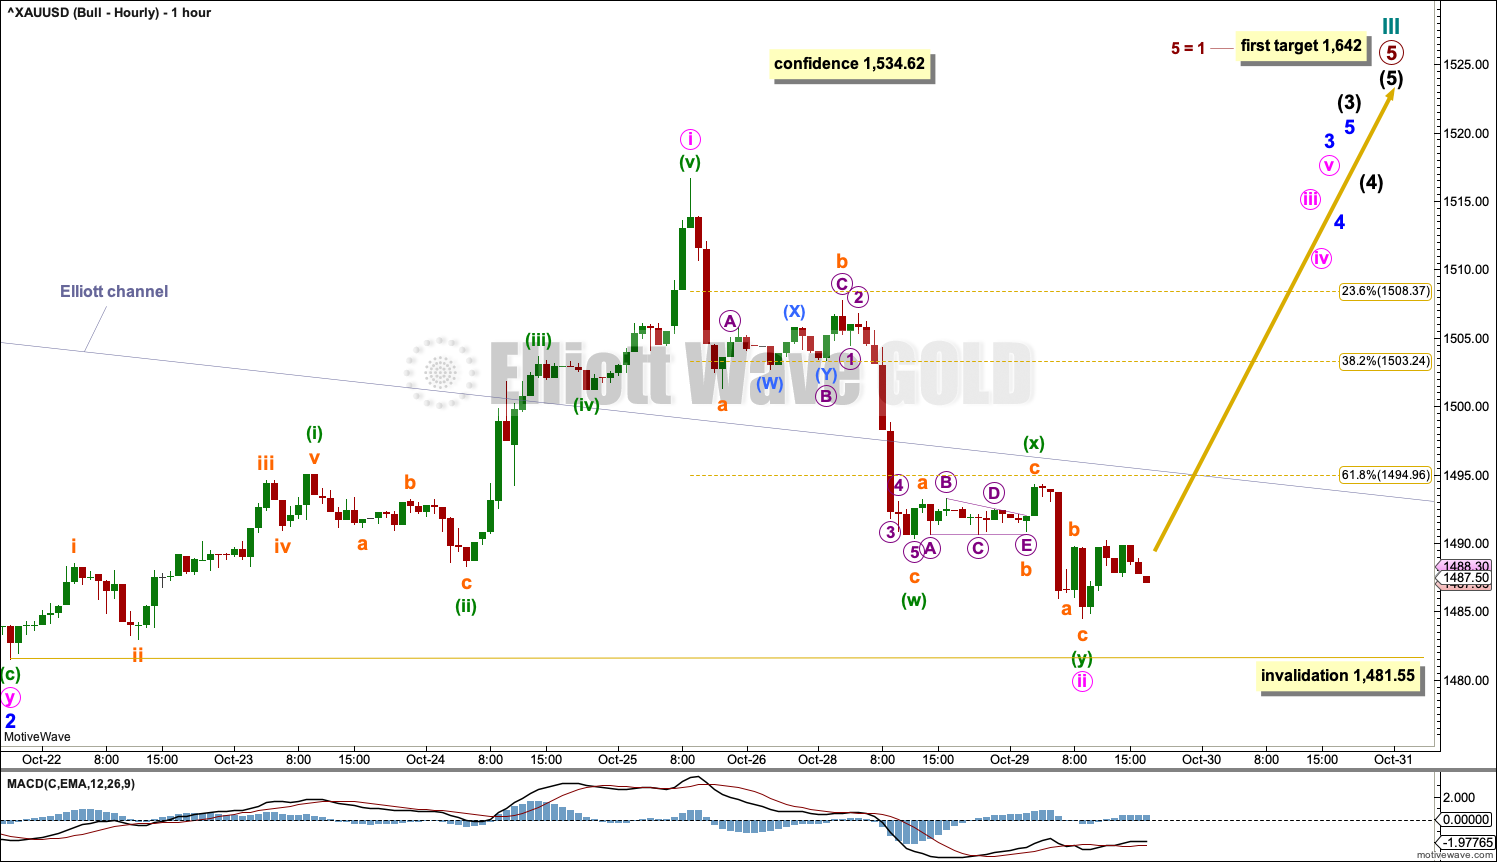
For the very short term, a new high above 1,516.65 would add some confidence in a more bullish outlook. The target would then be at 1,567, 1,652 or 1,693.
With channels on both main and alternate bearish Elliott wave counts now breached, they may now be of about even probability. A breakout is required for confidence in either.
For the bigger picture, the bearish Elliott wave count expects a new downwards trend to last one to several years may begin after one more high. The alternate bearish wave count looks at the possibility that a major high is already in. Confidence in this view may be had if price makes a new low by any amount at any time frame below 1,346.45.
The bullish Elliott wave count expects a primary degree fourth wave has completed and the upwards trend has resumed.
Grand SuperCycle analysis is here.
Monthly charts were last published here.
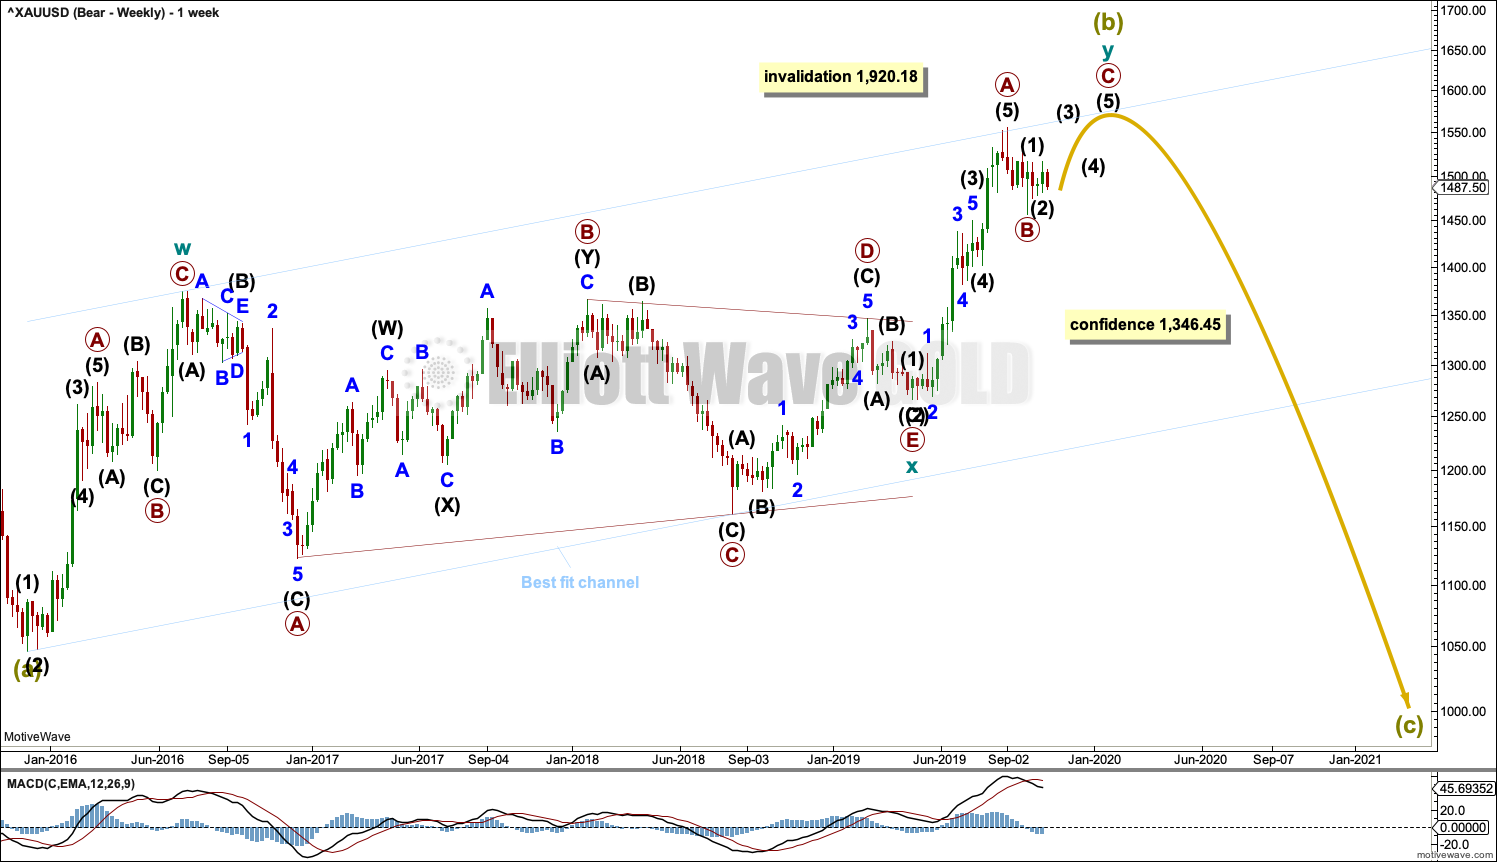
BEARISH ELLIOTT WAVE COUNT
WEEKLY CHART
Click chart to enlarge.
It is possible that Super Cycle wave (b) is nearly complete as a double zigzag.
The first zigzag in the double is labelled cycle wave w. The double is joined by a three in the opposite direction, a triangle labelled cycle wave x. The second zigzag in the double is labelled cycle wave y.
The purpose of the second zigzag in a double is to deepen the correction. Cycle wave y has achieved this purpose.
A new low below 1,346.45 would add strong confidence to this wave count. At that stage, the bullish Elliott wave count would be invalidated.
A wide best fit channel is added in light blue. This channel contains all of Super Cycle wave (b) and may provide resistance and support. Copy this channel over to daily charts.
DAILY CHART
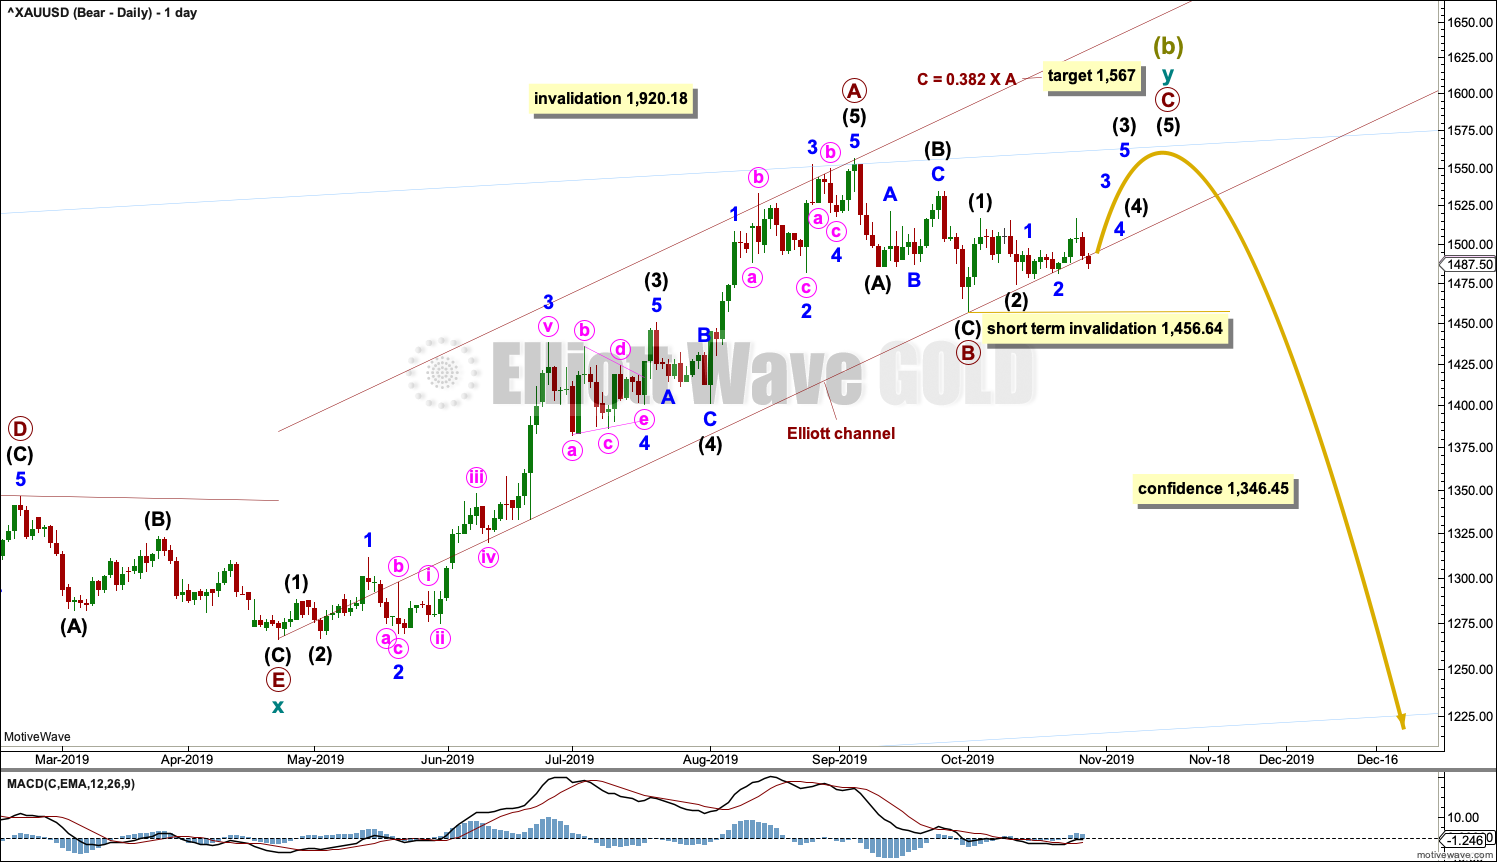
Click chart to enlarge.
This wave count exactly follows the expected pathway for Silver.
It is possible that the double zigzag for Super Cycle wave (b) may be incomplete and may yet require one more high. A target is calculated for primary wave C that expects resistance at the upper edge of the light blue best fit channel to continue.
Within cycle wave y, primary wave A may have been over at the last high. Primary wave B may now be a complete zigzag. Primary wave C may have begun. Within primary wave C, intermediate wave (2) may not move beyond the start of intermediate wave (1) below 1,456.64.
A channel is drawn about cycle wave y using Elliott’s technique for a correction. Today this channel is breached by some downwards movement. The probability of this wave count is now reduced to about even with the alternate below.
It is possible to move the degree of labelling within intermediate wave (B) down one degree; intermediate wave (B) may still continue lower as a double zigzag. Within the double, wave X may be completing. If intermediate wave (B) continues lower, it would still have good proportion to intermediate wave (A). Intermediate wave (B) may not move beyond the start of intermediate wave (A) below 1,266.61.
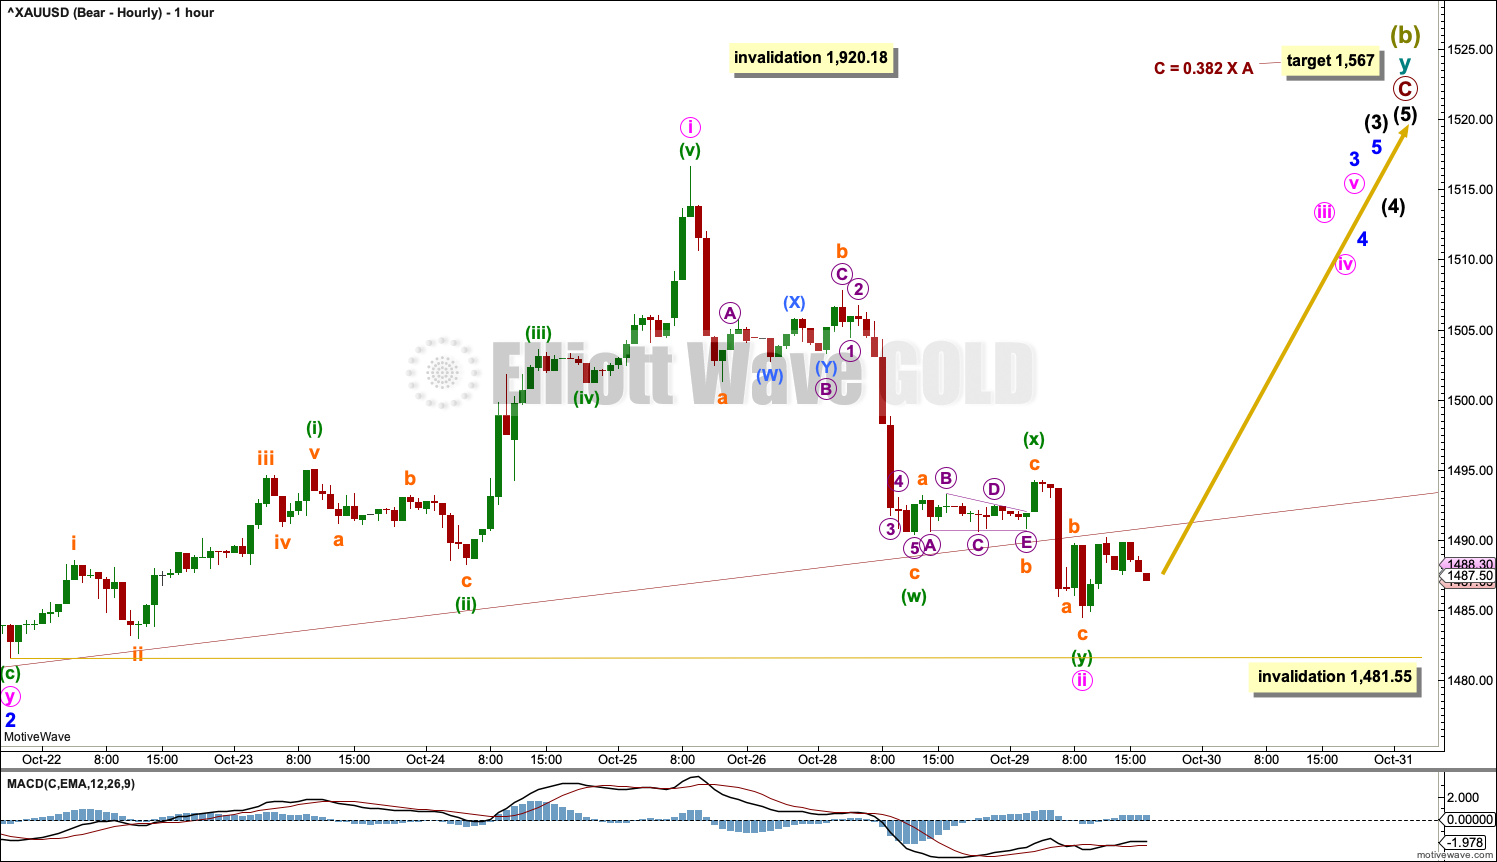
HOURLY CHART
Click chart to enlarge.
This hourly chart shows all movement from the end of minor wave 2.
Intermediate wave (3) may only subdivide as an impulse. Within the impulse, minor waves 1 and 2 may be complete. Minor wave 3 may have begun, and it too may only subdivide as an impulse.
Within minor wave 3, minute waves i and ii may be complete. Minute wave ii may have continued lower today as a double zigzag.
If it continues lower, then minute wave ii may not move beyond the start of minute wave i below 1,481.55.
ALTERNATE DAILY CHART
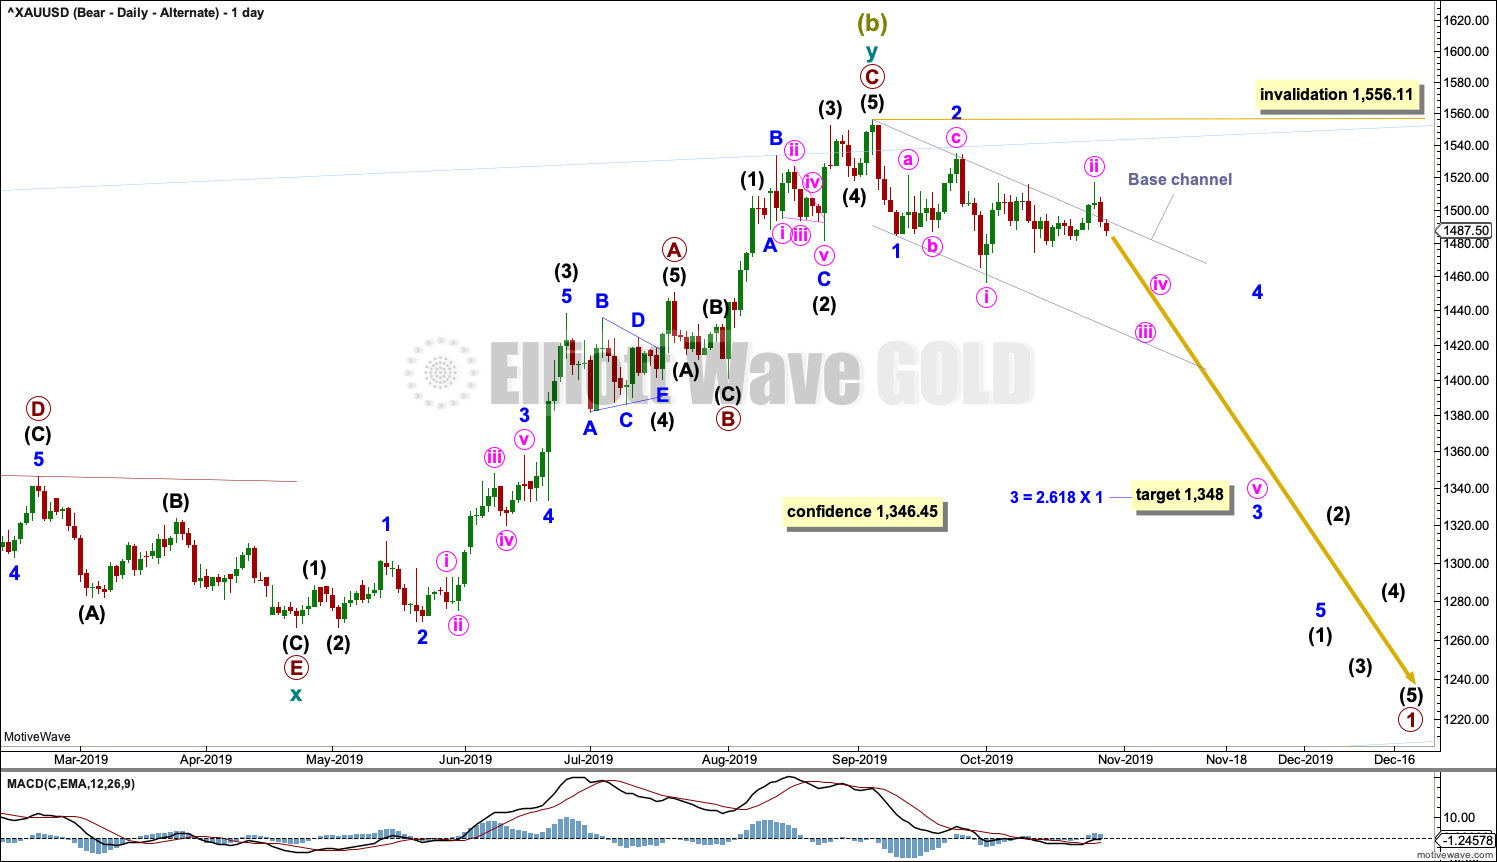
Click chart to enlarge.
Cycle wave y may be a complete zigzag. Within both of primary waves A and C, there is good proportion between intermediate waves (2) and (4). Within both of primary waves A and C, there is good alternation in structure of intermediate waves (2) and (4).
Within cycle wave y, there is no Fibonacci Ratio between primary waves A and C.
Draw a base channel on daily and hourly charts about minor waves 1 and 2. Draw the first trend line from the start of minor wave 1 to the end of minor wave 2, then place a parallel copy on the end of minor wave 1.
Gold does not always fit neatly within base channels. Occasionally, second wave corrections can be deep and time consuming and can breach base channels. This wave count remains valid. Price has returned strongly back within the base channel.
ALTERNATE HOURLY CHART
Click chart to enlarge.
Minute wave ii may be complete at the high for Friday. This wave count now expects a third wave down at two degrees has begun.
Minute wave iii may only subdivide as an impulse. Within the impulse, minuette wave (i) may now be complete.
Minuette wave (ii) may not move beyond the start of minuette wave (i) above 1,516.65.
The strong downwards pull now of a third wave at two degrees may force minuette wave (ii) to be more brief than usual.
BULLISH ELLIOTT WAVE COUNT
WEEKLY CHART
Click chart to enlarge.
This wave count sees the the bear market complete at the last major low for Gold in November 2015.
If Gold is in a new bull market, then it should begin with a five wave structure upwards on the weekly chart. However, the biggest problem with this wave count is the structure labelled cycle wave I because this wave count must see it as a five wave structure, but it looks more like a three wave structure.
Commodities often exhibit swift strong fifth waves that force the fourth wave corrections coming just prior and just after to be more brief and shallow than their counterpart second waves. It is unusual for a commodity to exhibit a quick second wave and a more time consuming fourth wave, and this is how cycle wave I is labelled. This wave count still suffers from this very substantial problem, and for this reason the bearish wave count is still considered because it has a better fit in terms of Elliott wave structure.
Cycle wave II subdivides well as a double combination: zigzag – X – expanded flat.
Cycle wave III may have begun. Within cycle wave III, primary waves 1 and 2 may now be complete. Primary wave 3 has now moved above the end of primary wave 1 meeting a core Elliott wave rule. It has now moved far enough to allow room for primary wave 4 to unfold and remain above primary wave 1 price territory. Primary wave 4 may not move into primary wave 1 price territory below 1,346.45.
Cycle wave III so far for this wave count would have been underway now for 63 weeks. It exhibits some support from volume and increasing ATR. This wave count has some support from classic technical analysis.
The channel drawn about cycle wave III is an adjusted Elliott channel. The lower edge is pulled lower.
Add the wide best fit channel to weekly and daily charts.
DAILY CHART
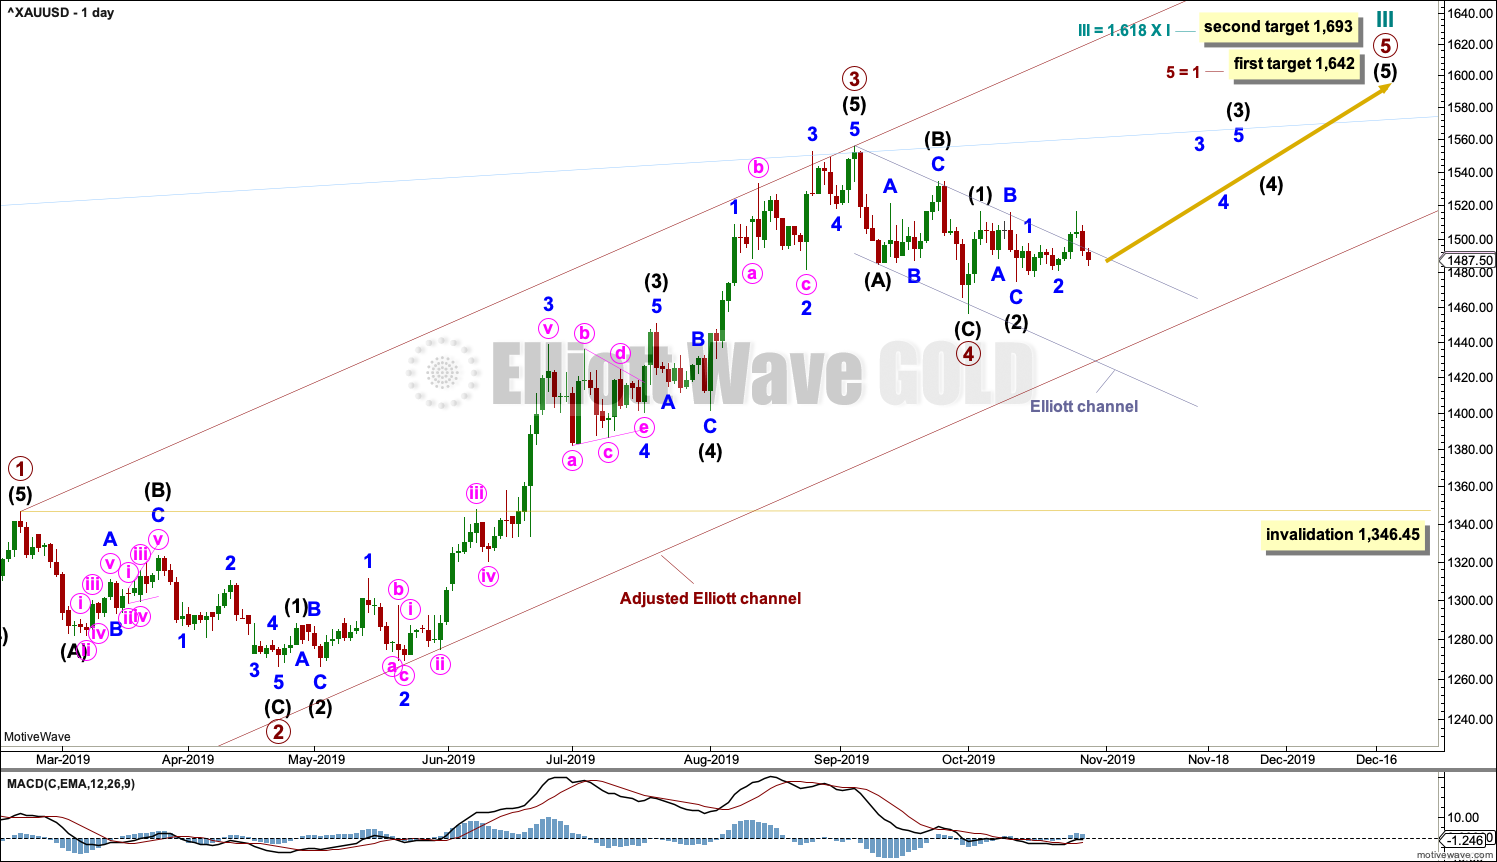
Click chart to enlarge.
Primary wave 4 is possibly complete. The structure now fits as a zigzag. It is possible that primary wave 4 could continue lower as a double zigzag. However, if primary wave 4 did continue lower, it may become longer in duration to primary wave 2. The proportion may not look good. This wave count would look best if primary wave 4 is over as labelled.
Primary wave 2 lasted 43 sessions. Primary wave 4 may have been over in 19 sessions. Gold’s fourth waves are often more brief in duration than its second waves; this part of the wave count has the right look.
Primary wave 4 may not move into primary wave 1 price territory below 1,346.45.
HOURLY CHART
Click chart to enlarge.
This hourly chart shows all price movement from the end of minor wave 2.
Minor wave 3 may only subdivide as an impulse. Within the impulse, minute wave i may be over at Friday’s high. Minute wave ii may now be complete as a double zigzag. If minute wave ii continues lower then it may not move beyond the start of minute wave i below 1,481.55.
TECHNICAL ANALYSIS
WEEKLY CHART
Click chart to enlarge. Chart courtesy of StockCharts.com.
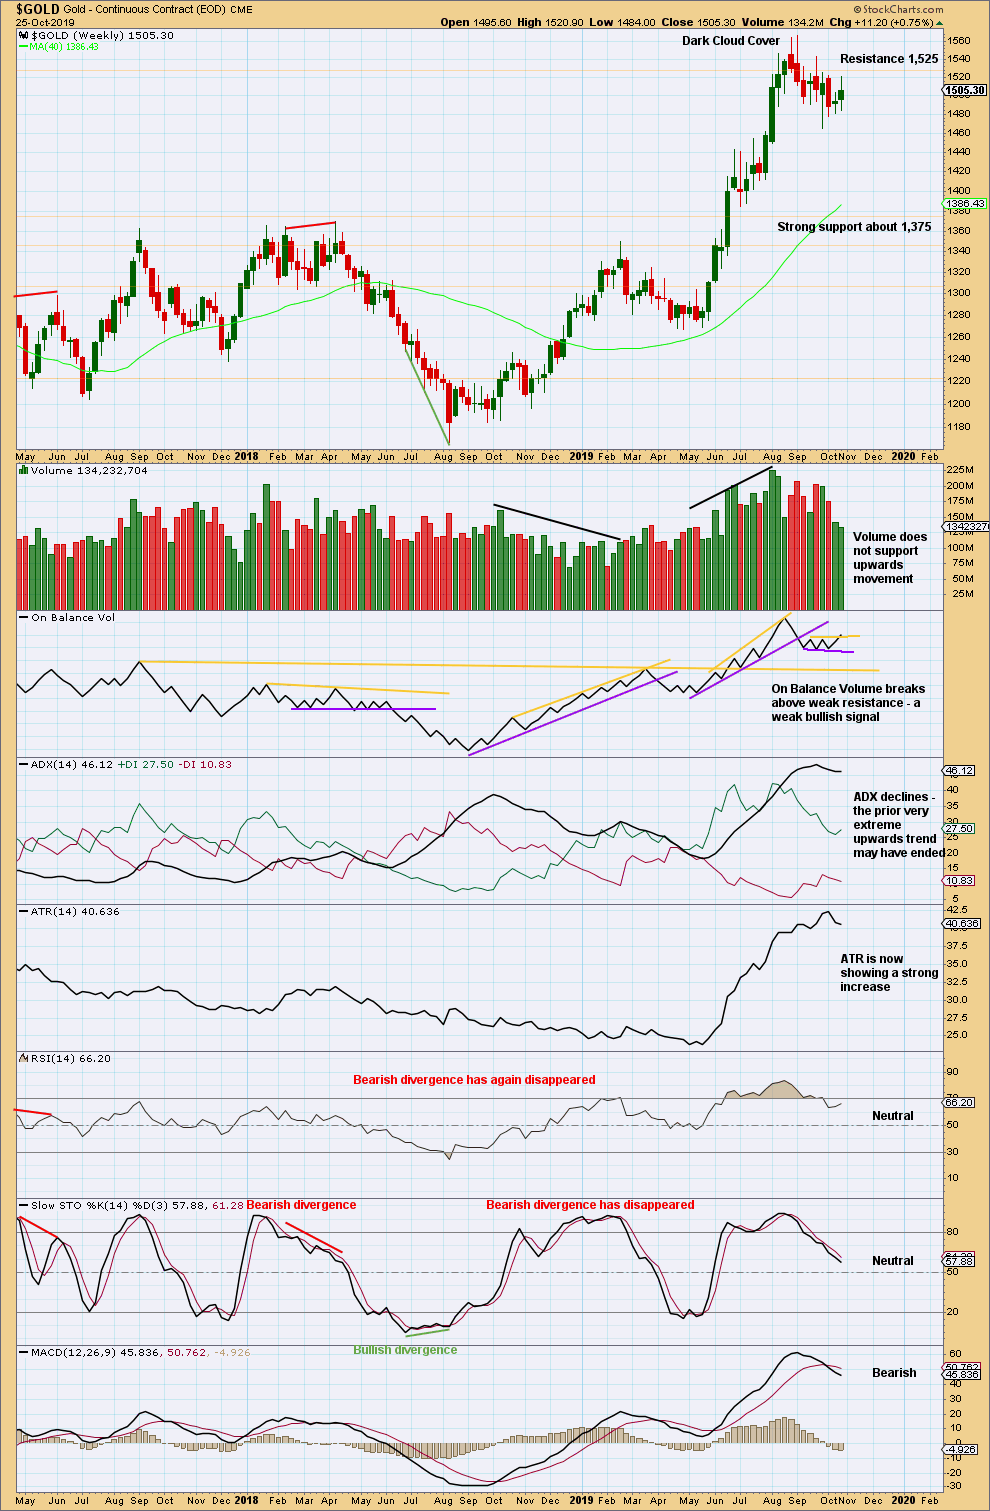
When trends reach very extreme, candlestick reversal patterns should be given weight. The Dark Cloud Cover bearish reversal pattern is given more bearish weight from the long upper wick.
This pullback has brought RSI and Stochastics down from overbought and ADX down from very extreme. It looks like a high may be in place for Gold, but it is also possible that one final high may yet be seen before a major trend change.
Last week gives contradictory signals. A decline in volume does not support upwards movement, but On Balance Volume gives a weak bullish signal. The view that a high may be in, or one final high may yet unfold shortly, is unchanged.
DAILY CHART
Click chart to enlarge. Chart courtesy of StockCharts.com.
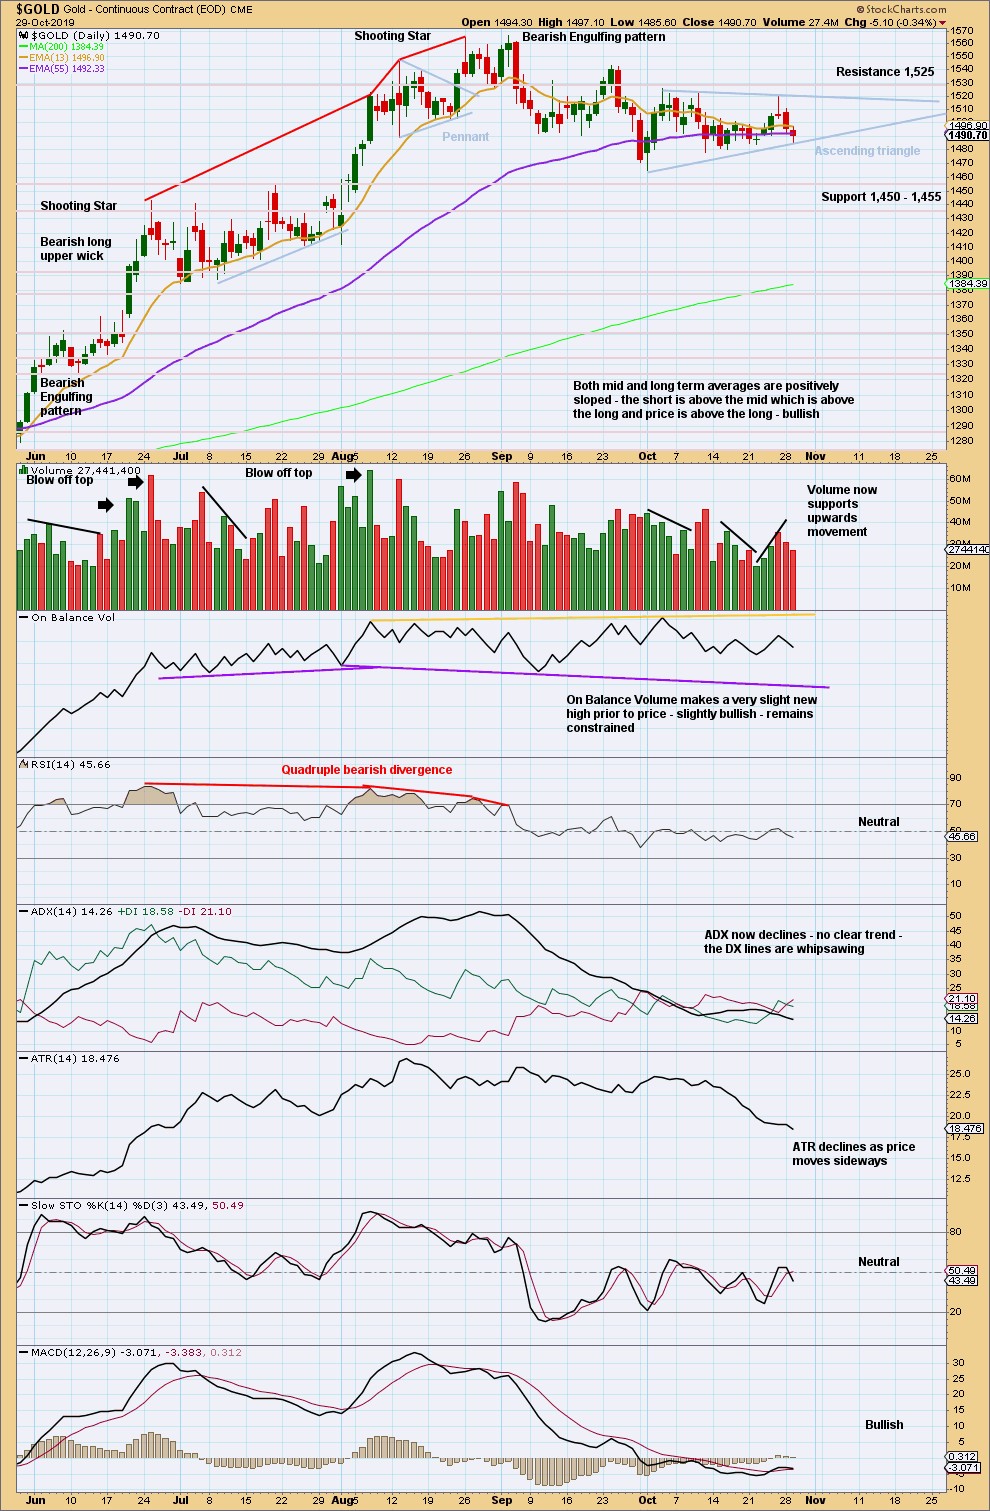
Since the last high on the 4th of September, there has been a new swing low (on the 30th of September) and now a series of (so far) two lower swing lows and two lower swing highs. In conjunction with a very strong Bearish Engulfing pattern on the 5th of September and the prior upwards trend reaching very extreme, it looks like Gold may have had a trend change.
A reasonably small ascending triangle may be unfolding.
From Kirkpatrick and Dhalquist, “Technical Analysis” page 317:
“Upwards breakouts occur 77% of the time, and all breakouts usually happen roughly 61% of the distance (time) from the base to the cradle.”
The lower triangle trend line is now adjusted; this makes a difference to where the cradle is positioned. A breakout may now happen in about another 12 sessions.
For the last small rise in price volume increased. Now volume declines for a fall in price. The short-term volume profile is bullish.
GDX WEEKLY CHART
Click chart to enlarge. Chart courtesy of StockCharts.com.
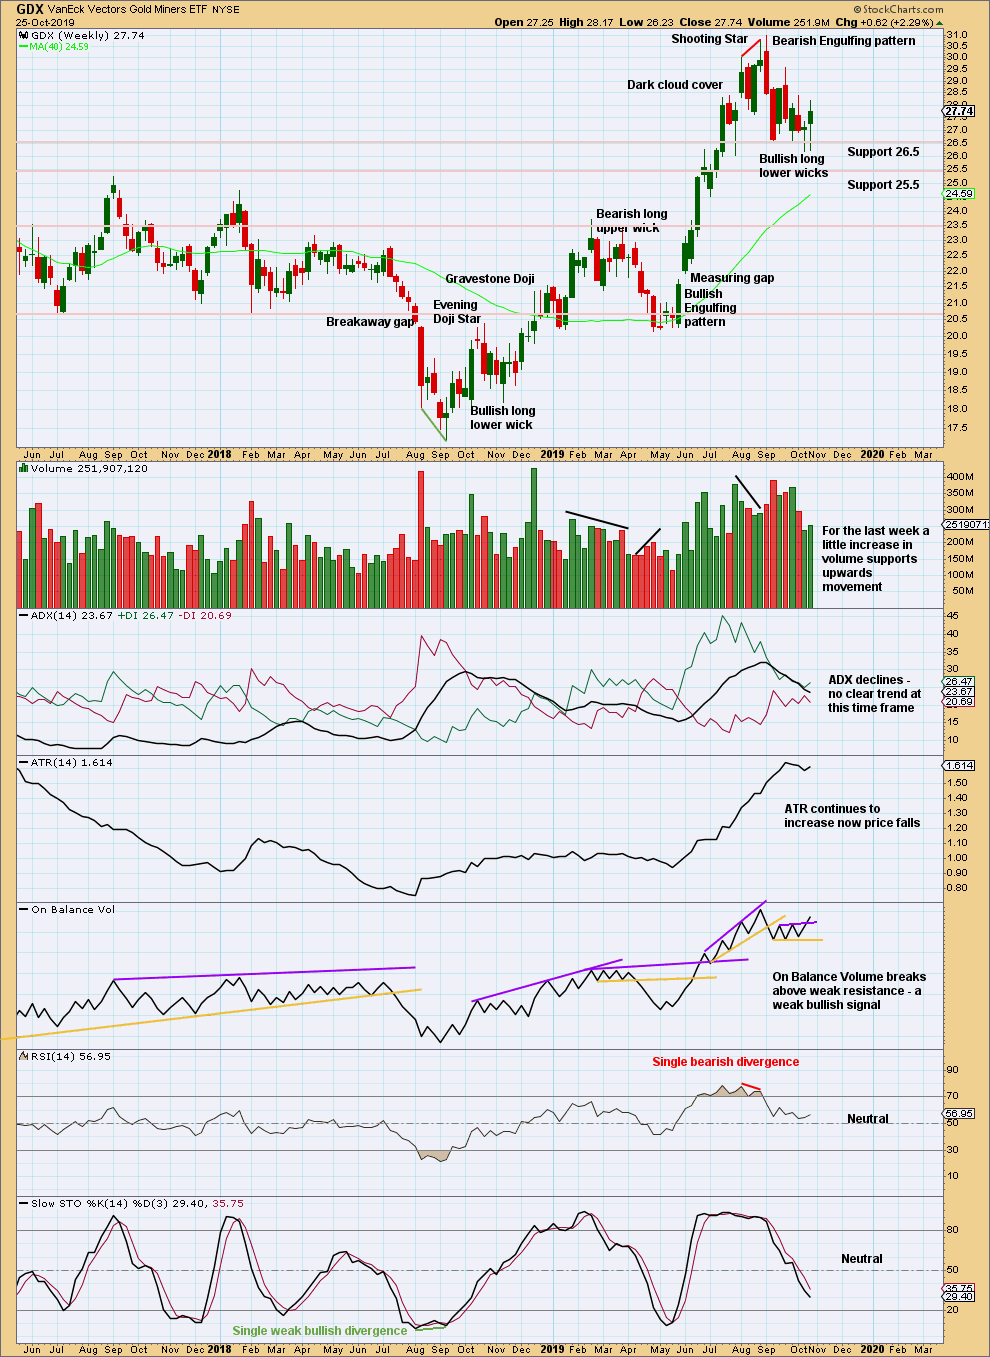
Some increase in volume, a long lower wick, and a weak bullish signal from On Balance Volume suggest more upwards movement for the short term.
GDX DAILY CHART
Click chart to enlarge. Chart courtesy of StockCharts.com.
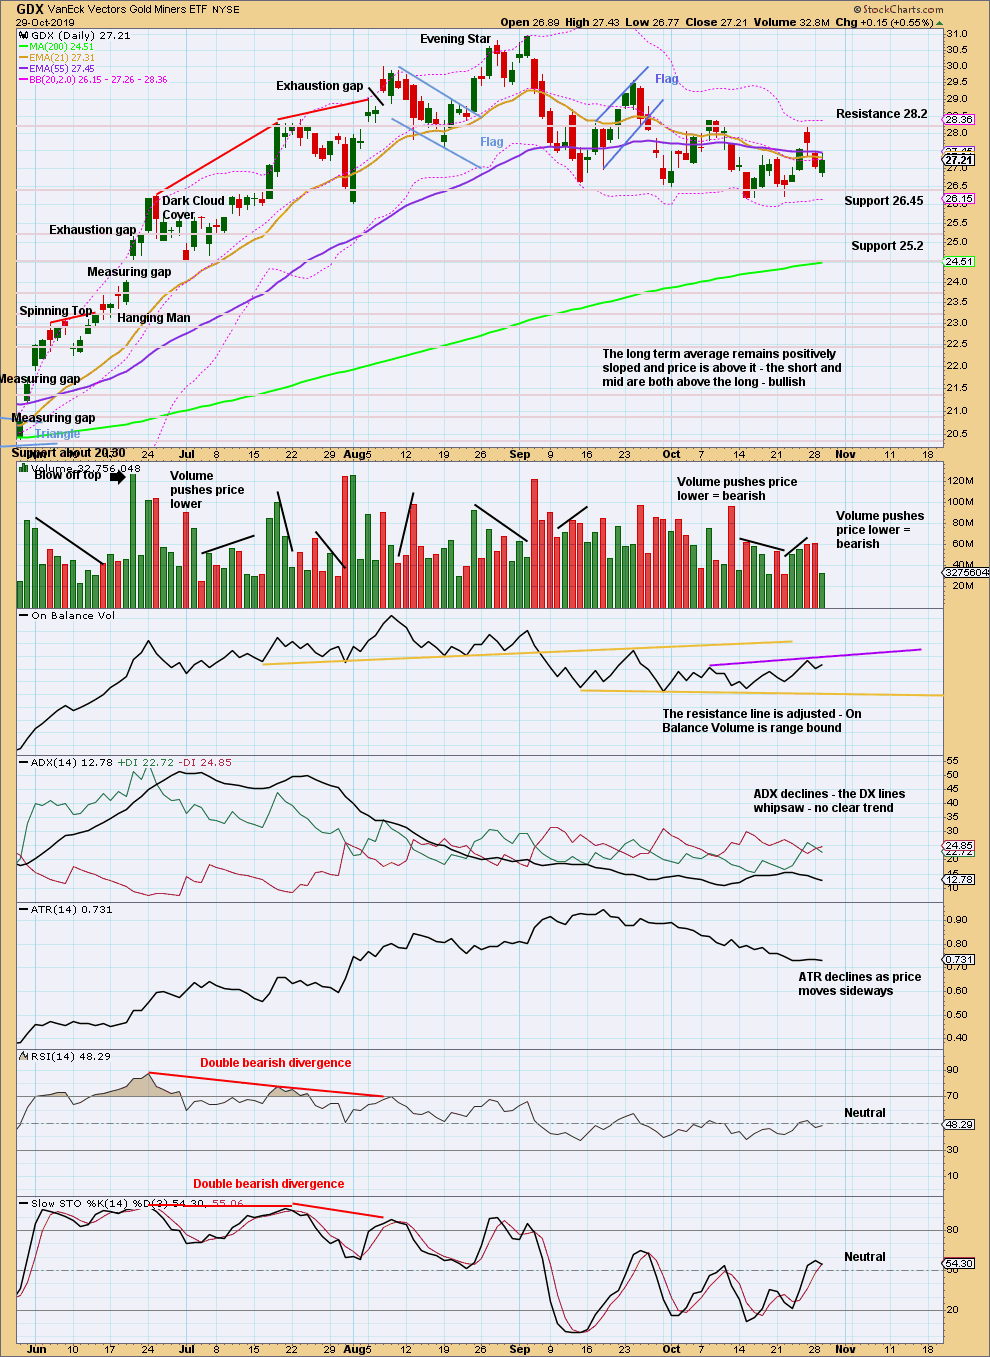
There is now a series of three lower highs and three lower lows from the high on the 4th of September. It still looks like GDX may have had a trend change. This view should remain dominant while the last swing high at 28.38 on the 8th of October remains intact.
For the very short term, GDX now looks a little more clearly bearish than Gold with volume pushing price lower.
Published @ 07:04 p.m. EST.
—
Careful risk management protects your trading account(s).
Follow my two Golden Rules:
1. Always trade with stops.
2. Risk only 1-5% of equity on any one trade.
—
New updates to this analysis are in bold.
thanks Lara – also the Dollar sold off to under it’s major trendline again – looks more bullish for gold (right now)….
https://www.tradingview.com/x/W3lNFZu1/
I have been meaning to get my USD analysis updated.
But I’m not currently at home and so my routine is out. Now I have to do a big report for Invysis, so the USD analysis is further delayed.
It does look like it’s had a trend change though.
bottom line remains that price is range bound
one option in this kind of market is to open a hedge, with the long side opened near support of the zone and the short side opened near resistance of the zone
after a breakout the losing side is closed and you have a profitable position for the next trend
My apologies everybody for not being here prior to NY close. Sometimes it’s just not possible for me to be here in time.
Hourly bull chart updated: minute ii may now be a complete double combination; zigzag – x – flat
hourly bear alternate updated
this is the most immediately bearish count currently
minuette (ii) may be a complete flat, but at this time subminuette c could certainly continue higher
the invalidation point has to remain the same
Hi Lara,
in the bear scenario can you have subminuette b going lower than minuette (i)?
yes, minuette (ii) may be an expanded flat
subminuette b makes a new low below the start of subminuette a and is a 1.19 length of subminuette a
this is a common corrective pattern and entirely valid
the rule for minuette (ii) in relation to minuette (i) is that minuette (ii) may not move beyond the start of minuette (i) above 1,516.65
My calculations may not be accurate, but 1481.55 seemed to hold on the double zig zag down. If so, that might be promising from the bullish hourly count standpoint. Wondered what other people thought.
Yep, I think we’re in the C now to 1503 personally
I wouldn’t expect much movement today .. these days fire off and crash, and end up back where they started (mostly).
IMO todays not the day we know whats going to happen next.
agree, nothing will be decided but if we get up to the.618 and reject impulsively I want to have at least a few shorts in case we get the big wave 3 starting next week.
Leaving sell bids at the .618 (top of the breakdown candle) for Gold. I have a feeling 2pm will be spiked up and then sold off. Market would love to bear trap the many shorts on SPX
Still hi level of commercial shorting. Move down towards lower 1400s may change that. Fedspeak may move gold market lower….or might have to wait till China trade agreement in Nov.
should be interesting, popcorn at hand