
Last week’s analysis expected a pullback to continue towards a target at 16.86. The week saw price move lower to 16.897, just 0.037 short of the target.
Summary: Upwards movement may now resume towards a target at 21.375. This target may be met in about 8 or 13 weeks.
Monthly charts were last updated here.
ELLIOTT WAVE COUNTS
BEARISH WAVE COUNT
WEEKLY CHART
Click chart to enlarge.
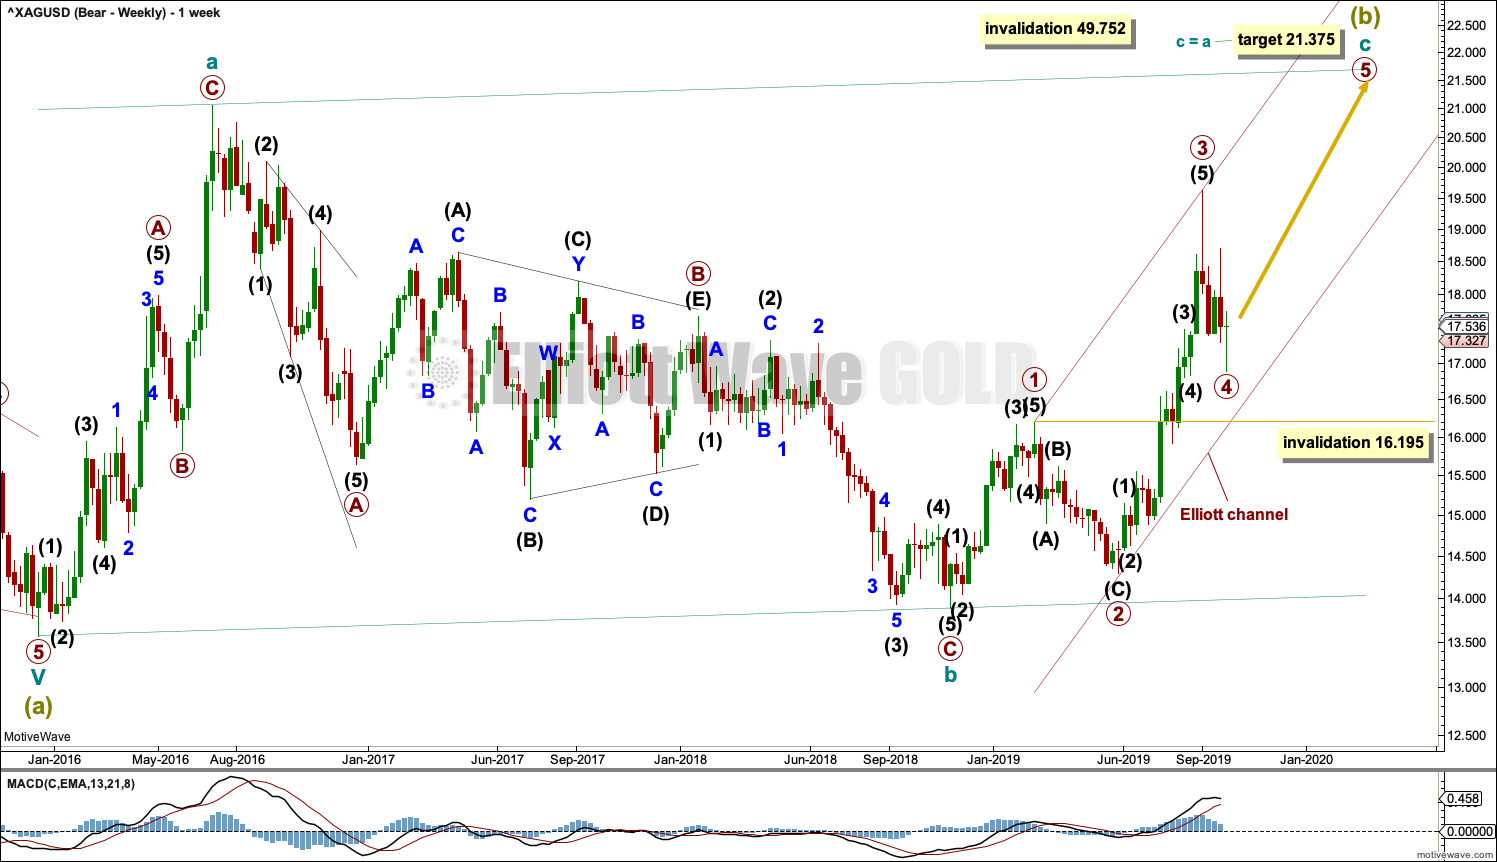
It is possible that Super Cycle wave (b) is an incomplete regular flat correction.
Within the regular flat correction, cycle wave a subdivides well as a zigzag and cycle wave b subdivides well as a zigzag, which is a 0.96 correction of cycle wave a.
Cycle wave c must complete as a five wave structure. Within cycle wave c, primary waves 1 through to 3 may be complete. Primary wave 4 may not move into primary wave 1 price territory below 16.195.
Regular flat corrections often fit within parallel channels. Cycle wave c may end about resistance at the upper edge of the channel. The most common Fibonacci Ratio for cycle wave c within a regular flat would be equality in length with cycle wave a.
It would be extremely likely, for this wave count, for cycle wave c to move at least slightly above the end of cycle wave a at 21.062 to avoid a truncation.
Within cycle wave c, primary waves 1 and 3 both lasted 14 weeks, one longer than a Fibonacci 13. Primary wave 5 may be a little shorter in length. It may last a total Fibonacci 8 or 13 weeks.
DAILY CHART
Click chart to enlarge.
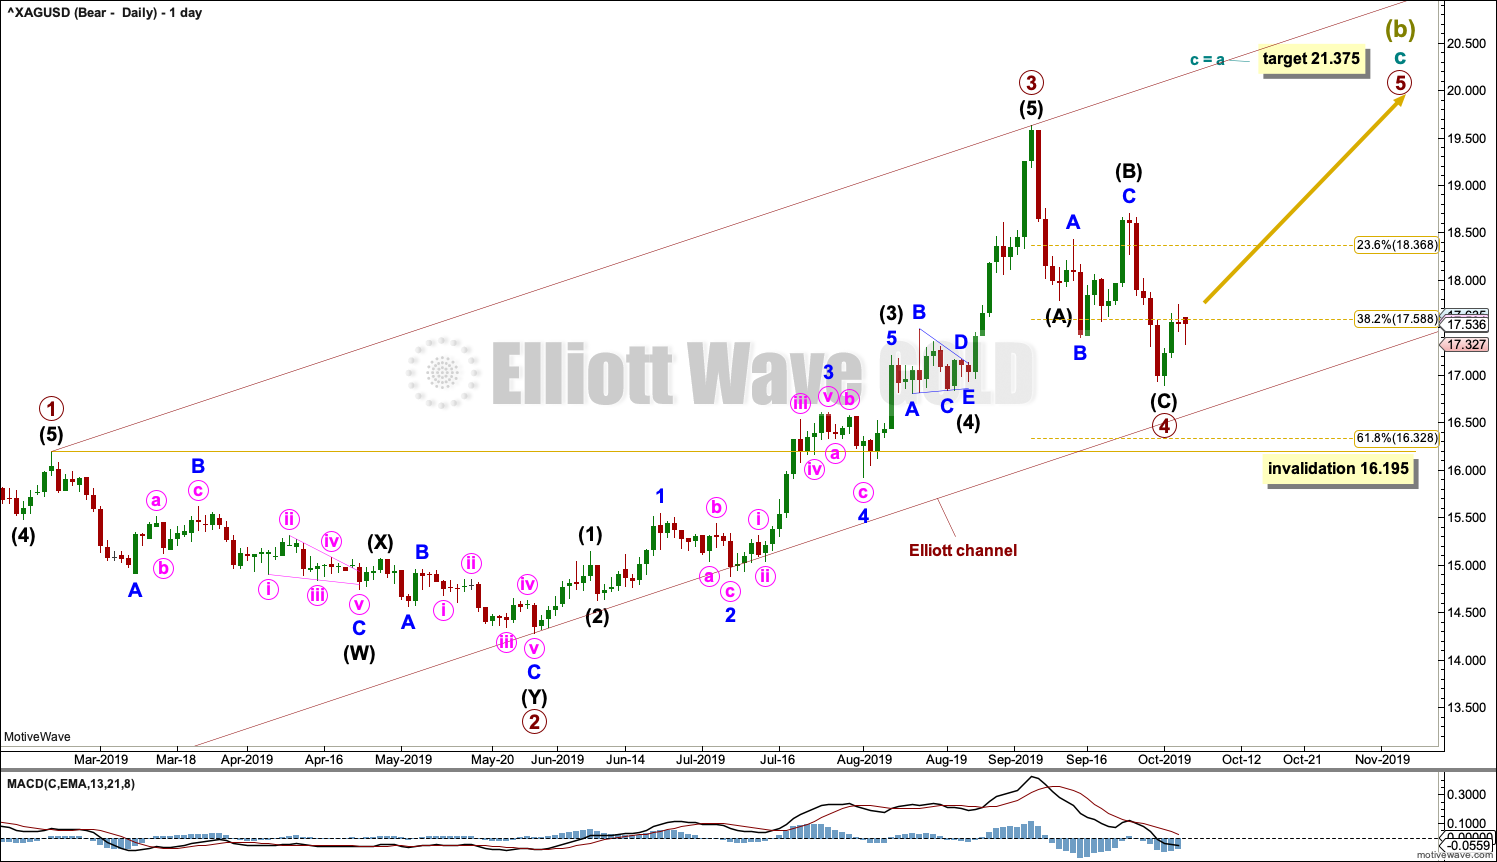
Cycle wave C may be subdividing as an impulse. Within the impulse, primary waves 1 to 4 may now be complete.
If it continues any further, then primary wave 4 may not move into primary wave 1 price territory below 16.195.
Primary wave 2 lasted 69 sessions and subdivided as a deep 0.82 double zigzag. If it is complete as labelled, then primary wave 4 may have exhibited some alternation as a single zigzag and more shallow at 0.51 of primary wave 3.
Primary wave 4 may be more brief than primary wave 2; fourth waves for Silver tend to be more brief than counterpart second waves.
BULLISH WAVE COUNT
WEEKLY CHART
Click chart to enlarge.
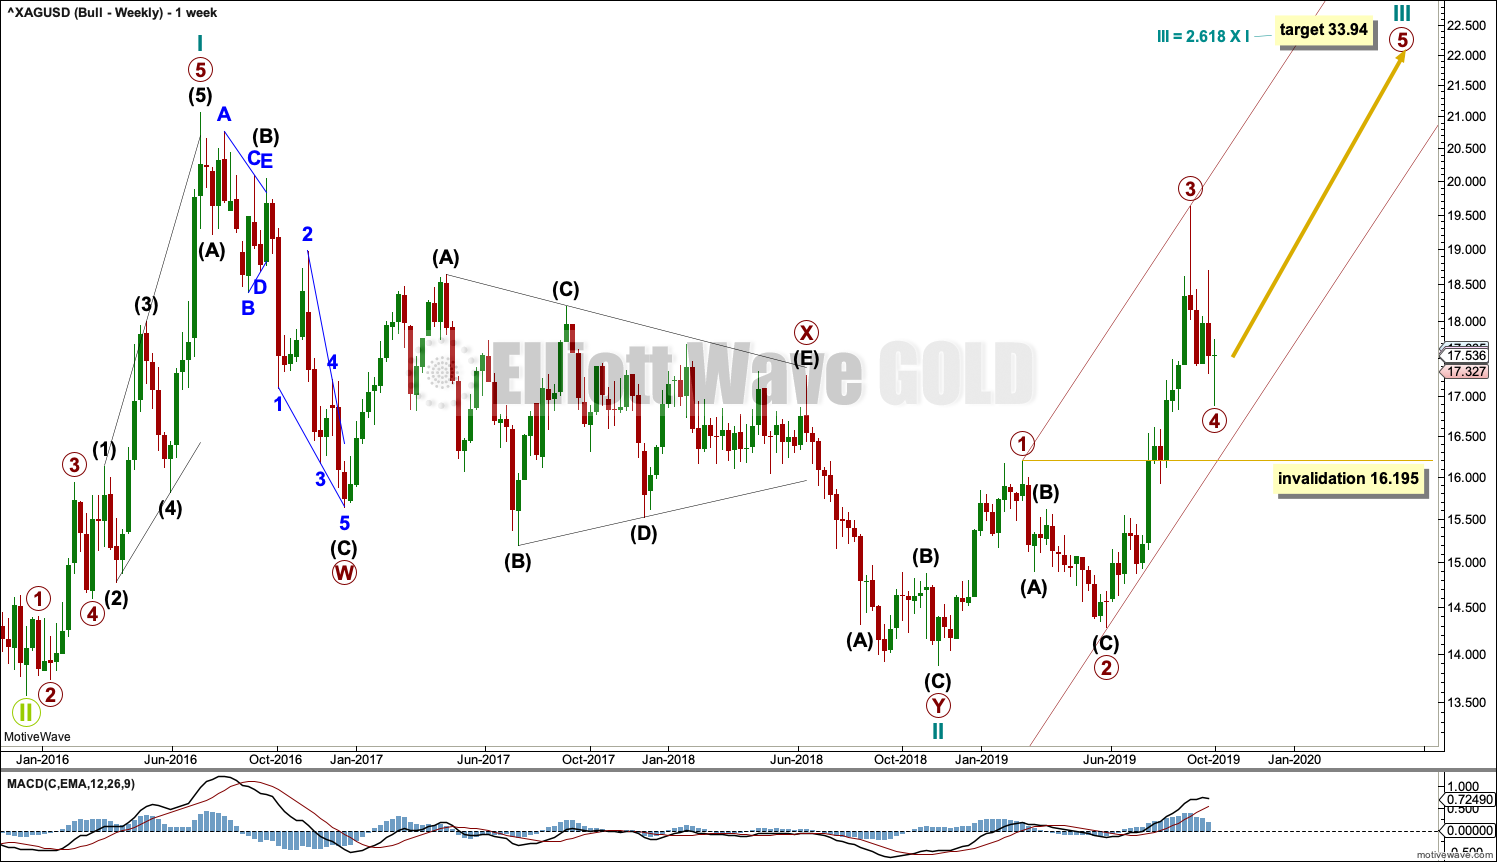
This bullish Elliott wave count sees a new bull market beginning for Silver at the low in December 2015.
A new bull market should begin with a five wave structure upwards. This is labelled cycle wave I.
Following five steps forward should be three steps back. This is labelled cycle wave II. The Elliott wave corrective structure of cycle wave II is labelled as a double zigzag, which is a fairly common structure.
Cycle wave III may only subdivide as an impulse. Within the impulse, primary waves 1 through to 3 may now be complete.
Cycle wave III must move beyond the end of cycle wave I above 21.062. Cycle wave III must move far enough above this point to allow room for cycle wave IV to unfold and remain above cycle wave I price territory.
DAILY CHART
Click chart to enlarge.
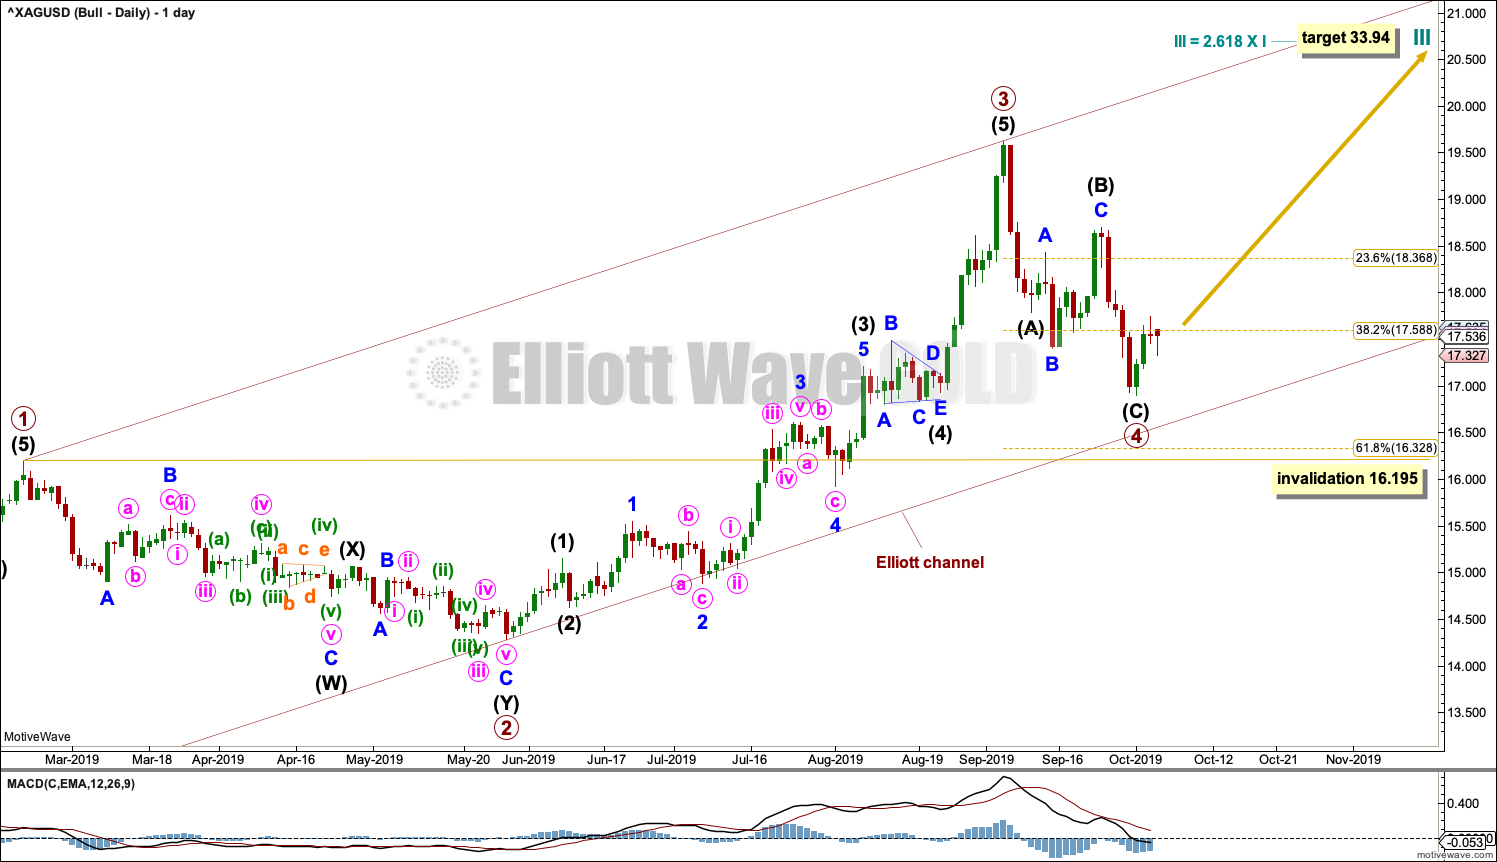
Both Elliott wave counts now expect a primary degree fourth wave to unfold. At this stage, both bull and bear wave counts are the same for the short to mid term. The targets for the next upwards movement are different.
TECHNICAL ANALYSIS
WEEKLY CHART
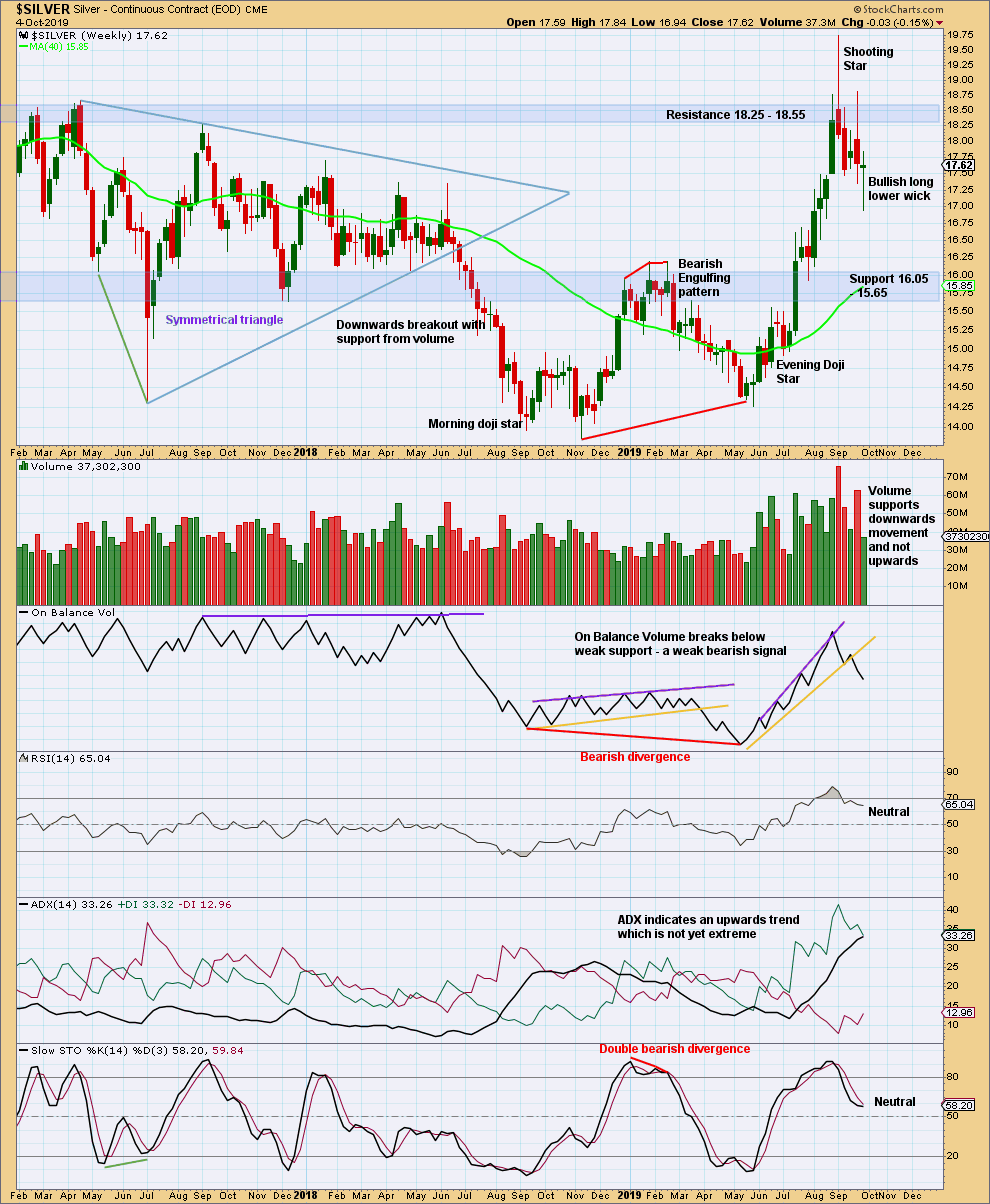
Click chart to enlarge. Chart courtesy of StockCharts.com.
This week a very long lower wick on the Doji candlestick suggests upwards movement next week. This supports the view that the pullback is over.
For Silver the trend is not yet extreme. The pullback has bought RSI down from overbought. There is again room for price to rise.
DAILY CHART
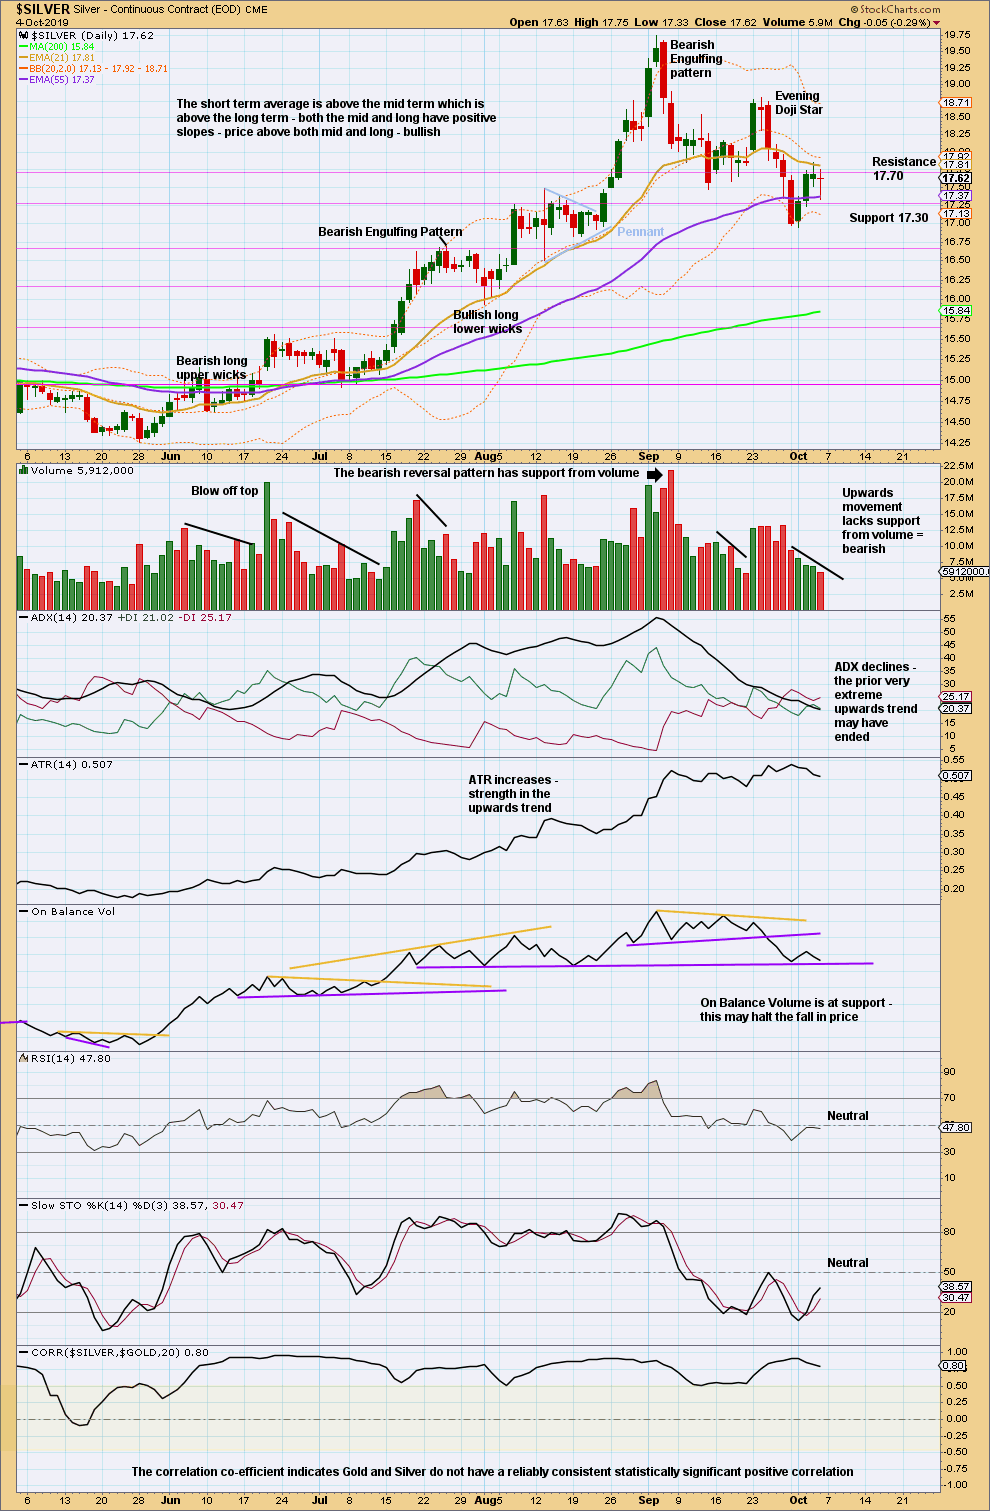
Click chart to enlarge. Chart courtesy of StockCharts.com.
Stochastics reached oversold at the low for this week. The bounce looks weak, however, and this contradicts the conclusion from the weekly candlestick.
Published @ 06:36 p.m. EST on October 5, 2019.
—
Careful risk management protects your trading account(s).
Follow my two Golden Rules:
1. Always trade with stops.
2. Risk only 1-5% of equity on any one trade.
—
New updates to this analysis are in bold.