
Monthly Elliott wave charts are updated for Silver.
Summary: Upwards movement may now resume towards a target at 21.375. This target may be met in about another 7 or 12 weeks.
ELLIOTT WAVE COUNTS
BEARISH WAVE COUNT
MONTHLY CHART
Click chart to enlarge.
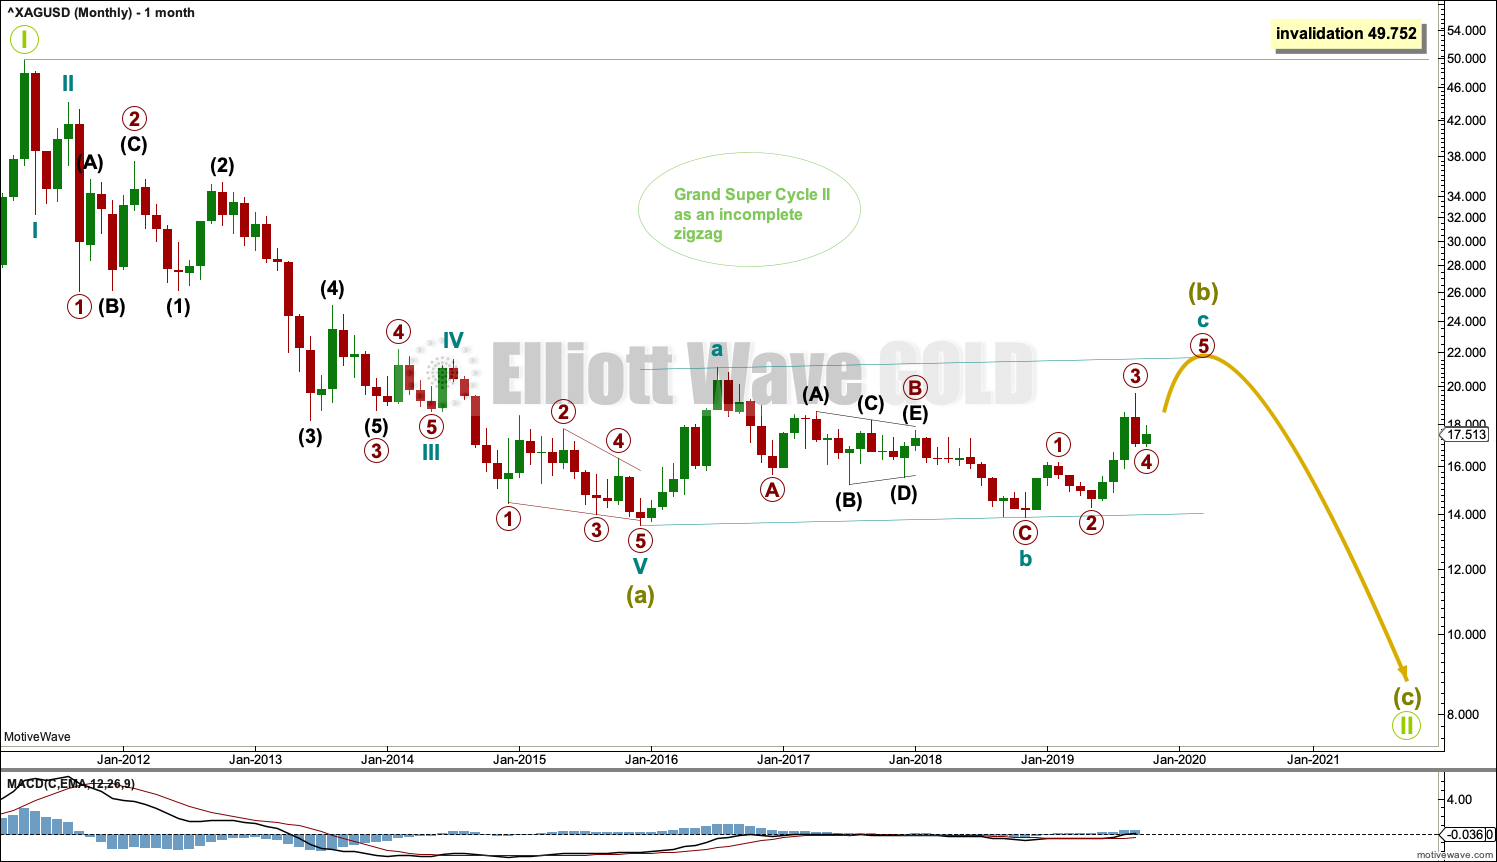
There is less historical data for Silver than Gold. The wave count for Silver sees a second wave correction unfolding where Gold sees a fourth wave. Either way, the structure may be incomplete for both. Gold and Silver usually have somewhat different wave counts and see major highs and lows at different times.
This wave count sees Super Cycle wave (a) as a complete five wave impulse. Super Cycle wave (b) may not move beyond its start above 49.752.
Super Cycle wave (b) may be an incomplete regular flat.
Super Cycle wave (c) would most likely move below the end of Super Cycle wave (a) at 13.569 to avoid a truncation.
WEEKLY CHART
Click chart to enlarge.
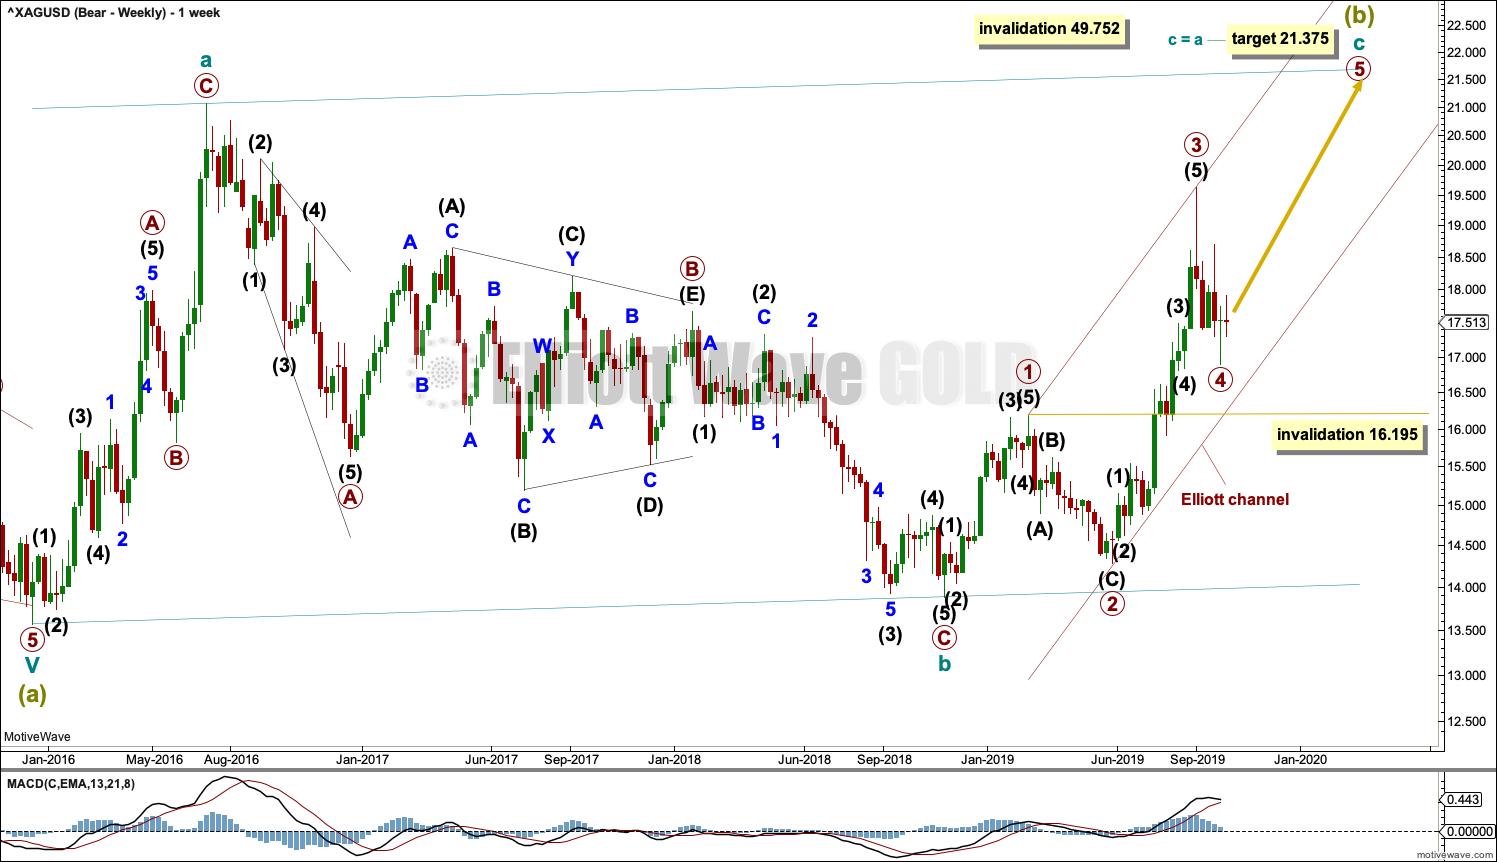
Super Cycle wave (b) may be an incomplete regular flat correction.
Within the regular flat correction, cycle wave a subdivides well as a zigzag and cycle wave b subdivides well as a zigzag, which is a 0.96 correction of cycle wave a.
Cycle wave c must complete as a five wave structure. Within cycle wave c, primary waves 1 through to 4 may be complete. If it continues any further, then primary wave 4 may not move into primary wave 1 price territory below 16.195.
Regular flat corrections often fit within parallel channels. Cycle wave c may end about resistance at the upper edge of the channel. The most common Fibonacci Ratio for cycle wave c within a regular flat would be equality in length with cycle wave a.
It would be extremely likely, for this wave count, for cycle wave c to move at least slightly above the end of cycle wave a at 21.062 to avoid a truncation.
Within cycle wave c, primary waves 1 and 3 both lasted 14 weeks, one longer than a Fibonacci 13. Primary wave 5 may be a little shorter in length. It may last a total Fibonacci 8 or 13 weeks.
DAILY CHART
Click chart to enlarge.
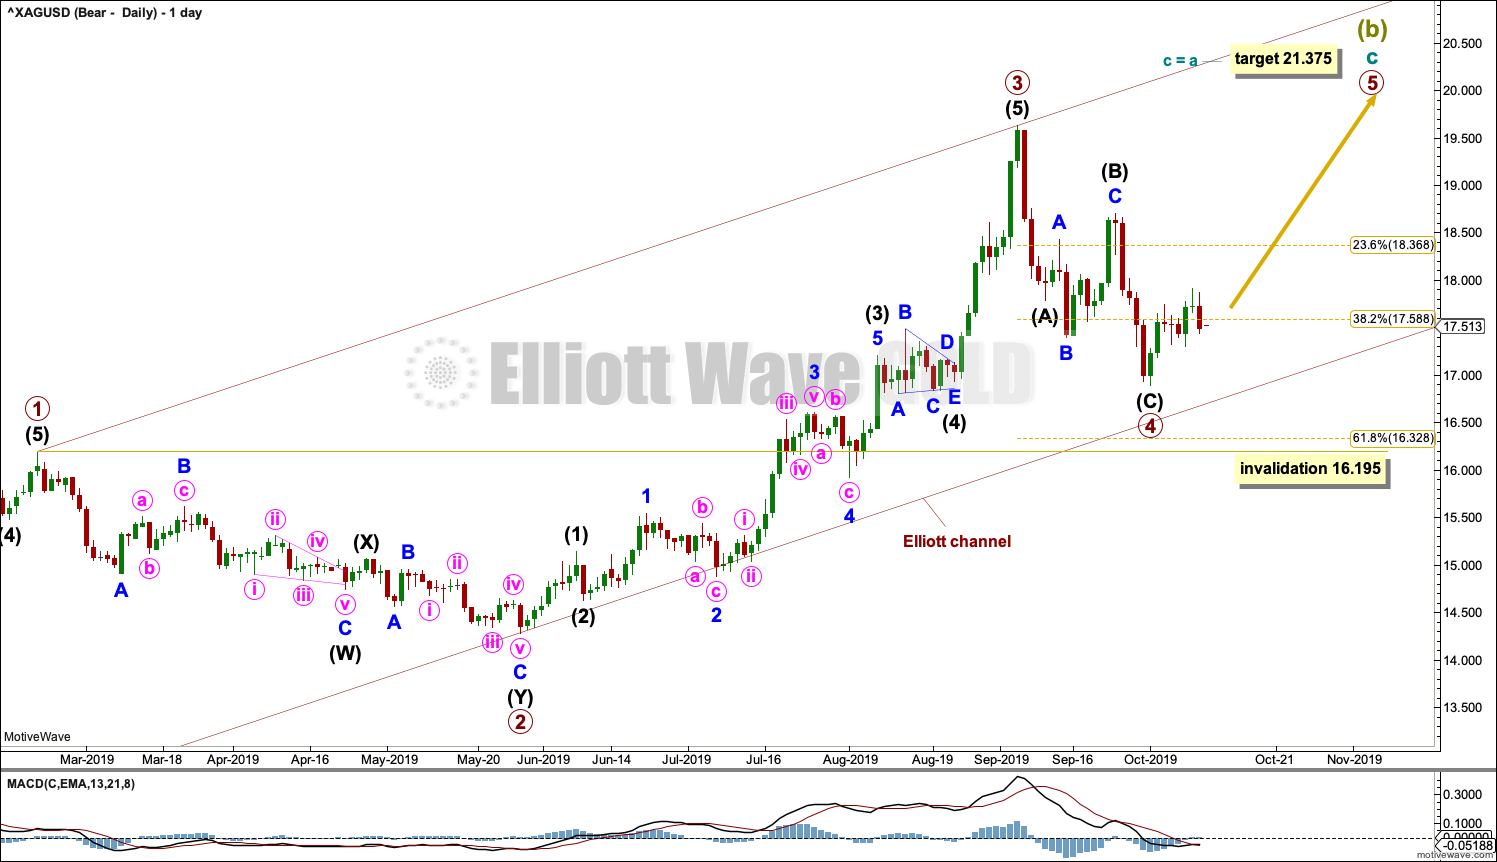
Cycle wave C may be subdividing as an impulse. Within the impulse, primary waves 1 to 4 may now be complete.
If it continues any further, then primary wave 4 may not move into primary wave 1 price territory below 16.195.
Primary wave 2 lasted 69 sessions and subdivided as a deep 0.82 double zigzag. If it is complete as labelled, then primary wave 4 may have exhibited some alternation as a single zigzag and more shallow at 0.51 of primary wave 3.
Primary wave 4 may be more brief than primary wave 2; fourth waves for Silver tend to be more brief than counterpart second waves.
BULLISH WAVE COUNT
MONTHLY CHART

Click chart to enlarge.
This bullish wave count looks at the possibility that the bear market may be over for Silver and a new bull market may have begun.
Grand Super Cycle wave II may be a complete double zigzag. Within this structure, there is a typically brief and shallow super cycle wave (x). The brevity of this X wave is acceptable within this structure.
If Grand Super Cycle wave II is complete, then a new substantial bull market may be in the very early stages for silver.
WEEKLY CHART
Click chart to enlarge.
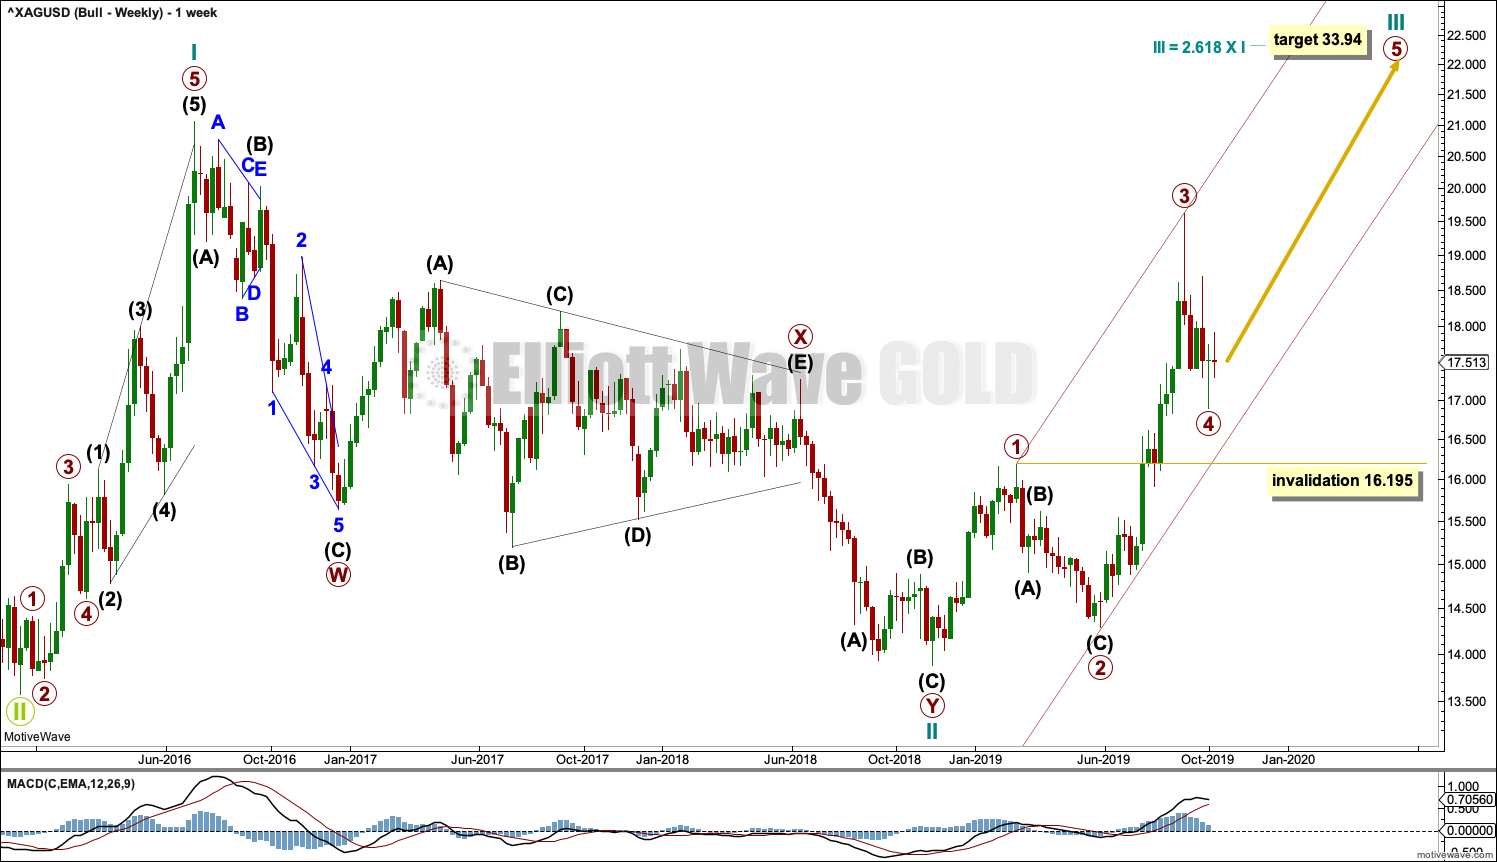
This bullish Elliott wave count sees a new bull market beginning for Silver at the low in December 2015.
A new bull market should begin with a five wave structure upwards. This is labelled cycle wave I.
Following five steps forward should be three steps back. This is labelled cycle wave II. The Elliott wave corrective structure of cycle wave II is labelled as a double zigzag, which is a fairly common structure.
Cycle wave III may only subdivide as an impulse. Within the impulse, primary waves 1 through to 3 may now be complete.
Cycle wave III must move beyond the end of cycle wave I above 21.062. Cycle wave III must move far enough above this point to allow room for cycle wave IV to unfold and remain above cycle wave I price territory.
DAILY CHART
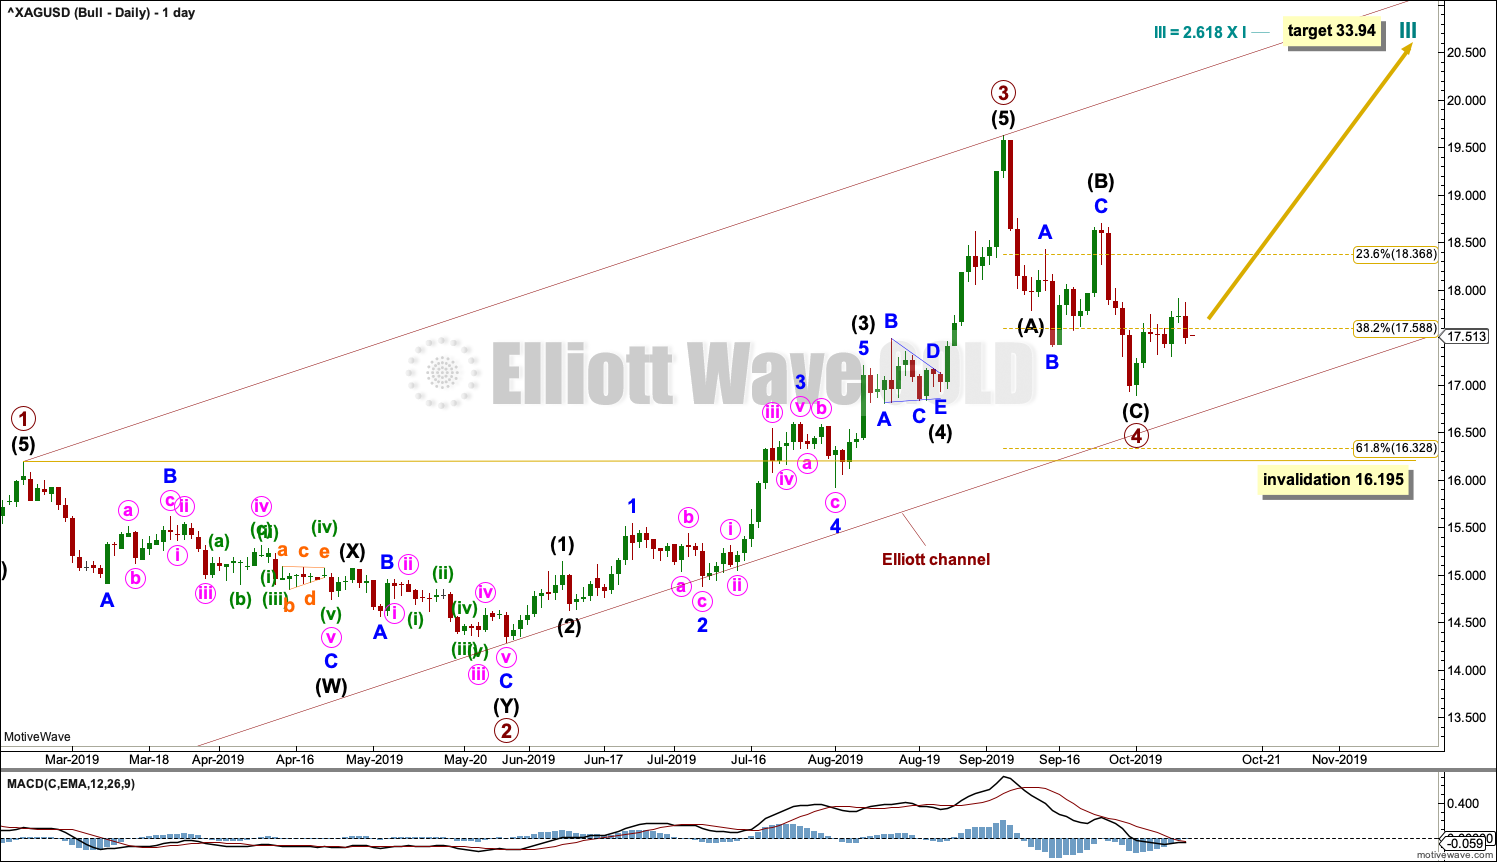
Click chart to enlarge.
Both Elliott wave counts now expect a primary degree fourth wave has completed and a primary degree fifth wave has begun. At this stage, both bull and bear wave counts are the same for the short to mid term. The targets for the next upwards movement are different.
TECHNICAL ANALYSIS
MONTHLY CHART
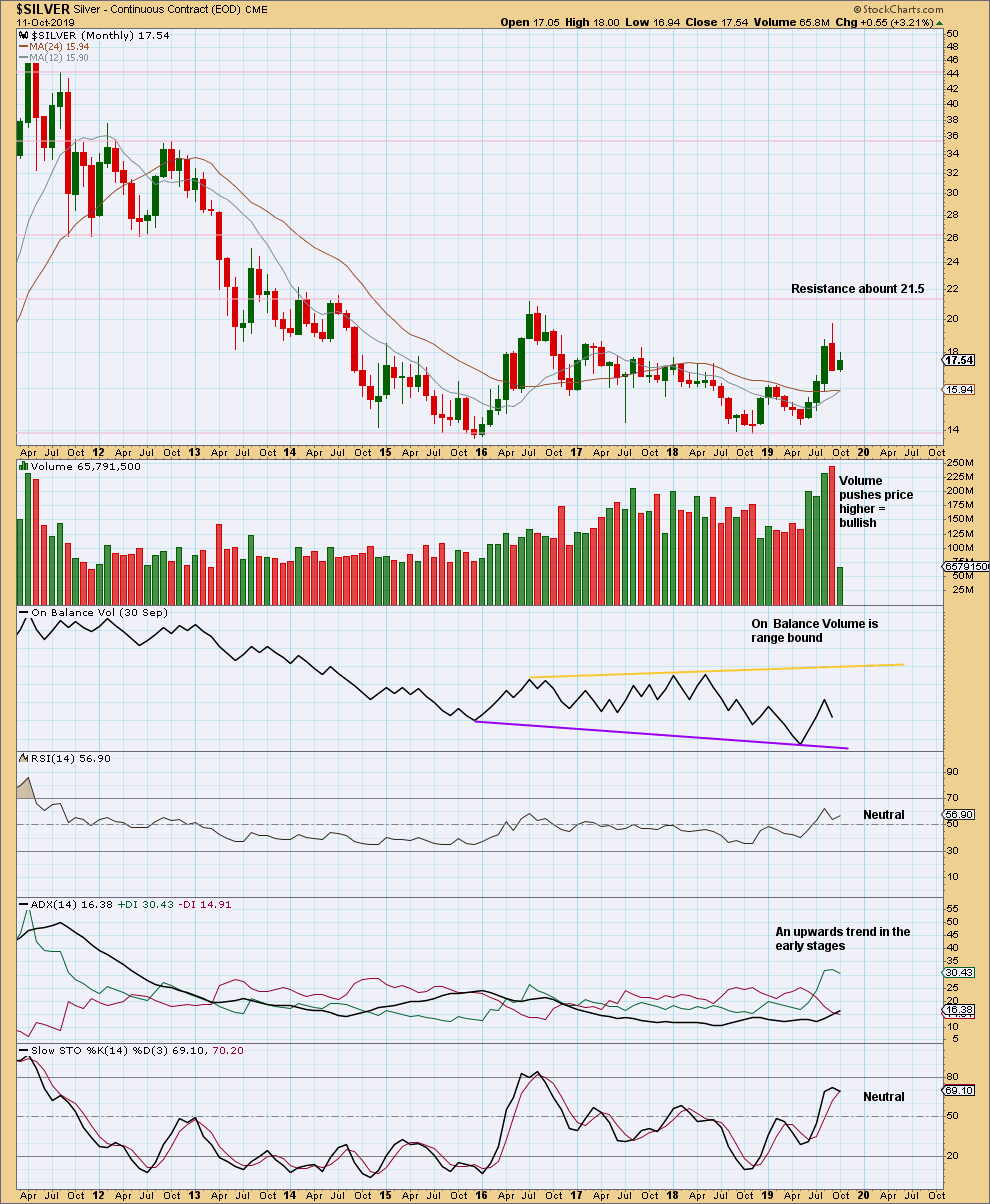
Click chart to enlarge. Chart courtesy of StockCharts.com.
Silver has been range bound since November 2013. Resistance is about 21.50. Support is about 13.60. Currently, an upwards trend may see an upwards breakout; volume strongly suggests an upwards breakout may be coming soon.
WEEKLY CHART
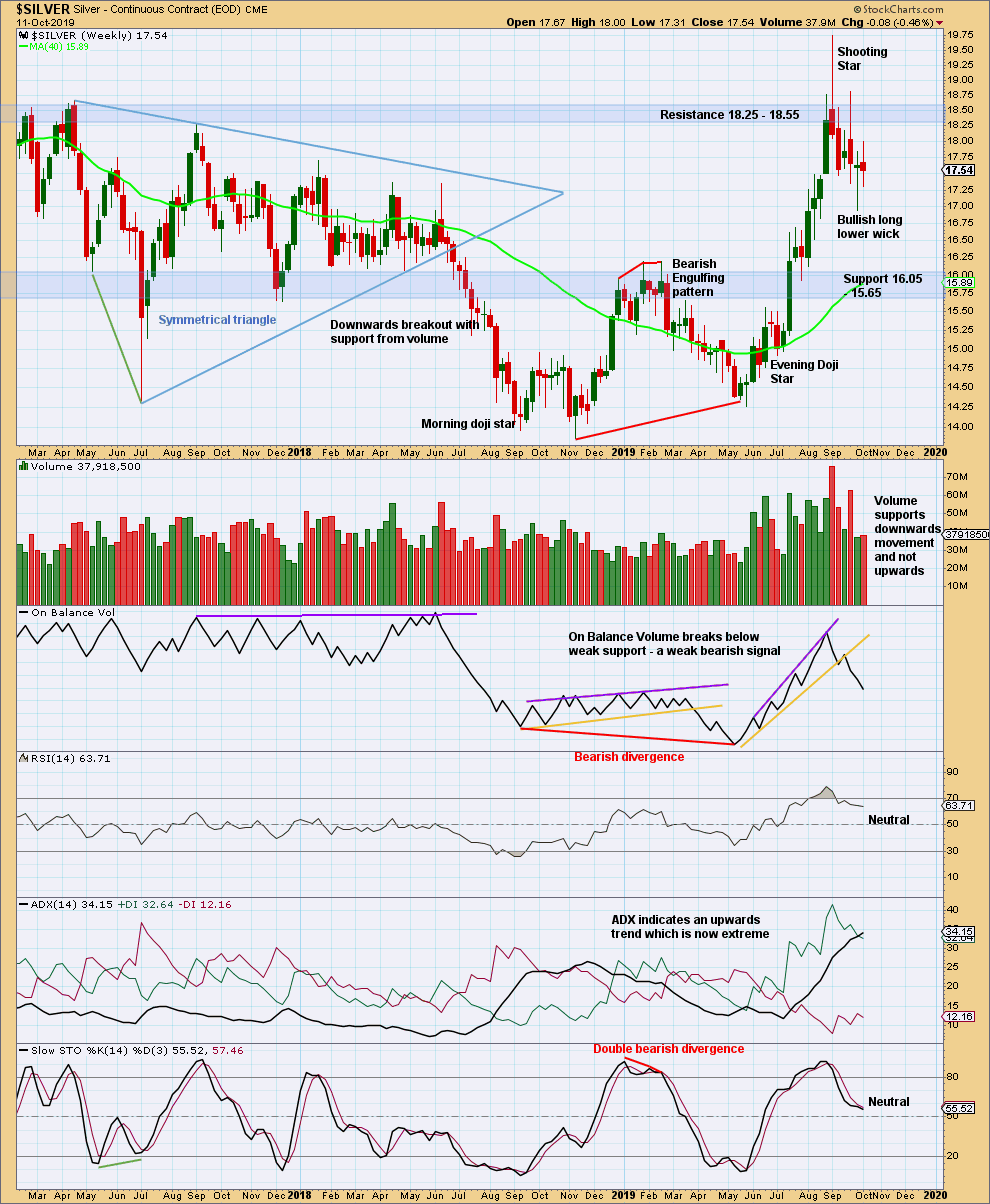
Click chart to enlarge. Chart courtesy of StockCharts.com.
The short-term volume profile is more bearish. Silver is back within a strong area of resistance and support, identified by blue shaded areas.
The upwards trend this week has reached extreme. Silver may have finished an upwards swing, or it may yet test resistance again. An upwards breakout has not yet occurred.
DAILY CHART
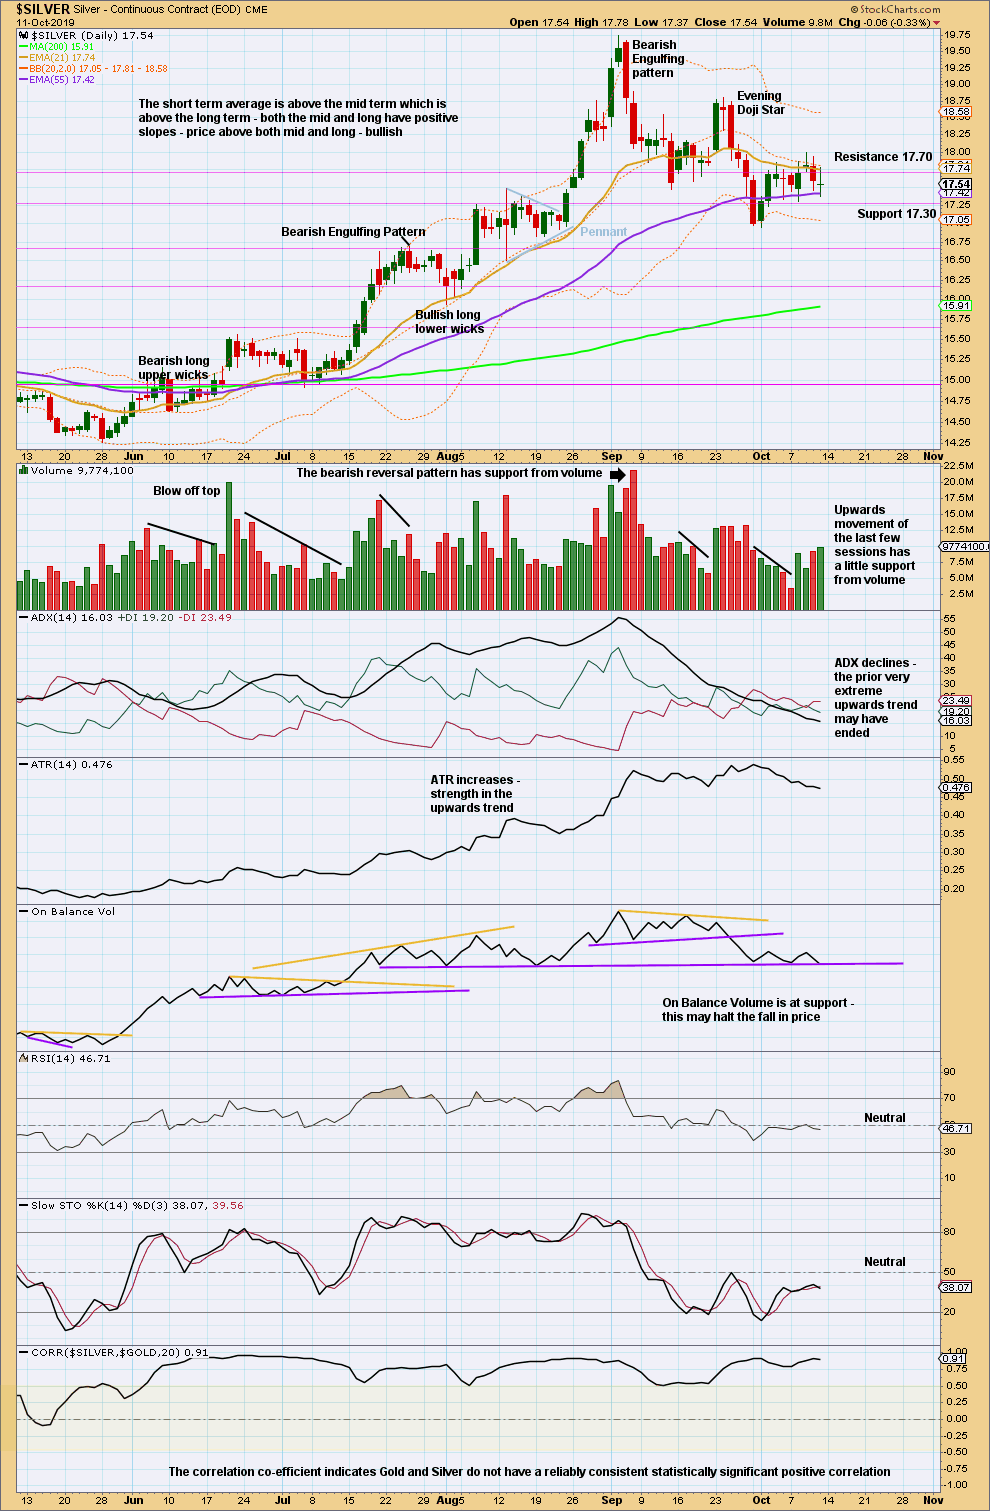
Click chart to enlarge. Chart courtesy of StockCharts.com.
There is now a series of two lower swing highs and two lower swing lows from the high on the 4th of September. The prior very extreme upwards trend may have ended. A new downwards trend may have begun.
This week there is still no signal from On Balance Volume; it is still at support.
Published @ 09:37 p.m. EST.
—
Careful risk management protects your trading account(s).
Follow my two Golden Rules:
1. Always trade with stops.
2. Risk only 1-5% of equity on any one trade.
—
New updates to this analysis are in bold.
Hi Lara,
Rather than gold moving higher (and I know we shouldn’t assume they move together) – bit how possible is a truncation in silver ??
Don’t want to go too heavy silver assuming it won’t truncate, if actually it’s possible.
Thank you
A truncation is most always possible, but in my opinion, it would occur at a price point much closer to the Cycle wave a price. So we still need to complete Intermediate wave 2, 3 & 4, then a truncation of Intermediate wave 5 of Primary 5 of Cycle c of SuperCycle B is possible. More up is likely coming.
Thank you.
It’s potentially very exciting times, so there is always that internal battle of how heavy to go in 😂😂
In the short term, there may be more down in Silver first
GDX may have a Head & Shoulders forming. Watch the neckline for a break. Could be a strong move down coming.
Dreamer,
I am taking the other side of the trade… I loaded up heavy on AU (Anglo Ashanti) on Friday on this ridiculous super hyped trade deal… The Fed is aggressively expanding the balance sheet, cutting rates and we have negative rates around in Europe & Japan.
I can’t see Gold & GDX going down that much…
Good luck
Mathieu
Silver rarely does truncations. It’s possible, but I would not expect it nor would I base a wave count on it.