
A little upwards movement reaches resistance at the upper trend line of a small ascending triangle.
All three Elliott wave counts remain valid.
Summary: For the very short term, a new low below 1,482.52 would add confidence in a more bearish outlook. The target would be at 1,348.
For the very short term, a new high above 1,516.65 would add some confidence in a more bullish outlook. The target would then be at 1,567, 1,652 or 1,693.
Classic technical analysis suggests an ascending triangle may be continuing. An upwards breakout is expected in 8 more sessions. A target may be at 1,578.
For the bigger picture, the bearish Elliott wave count expects a new downwards trend to last one to several years may begin after one more high. The alternate bearish wave count looks at the possibility that a major high is already in. Confidence in this view may be had if price makes a new low by any amount at any time frame below 1,346.45.
The bullish Elliott wave count expects a primary degree fourth wave has completed and the upwards trend has resumed.
Grand SuperCycle analysis is here.
Monthly charts were last published here.
BEARISH ELLIOTT WAVE COUNT
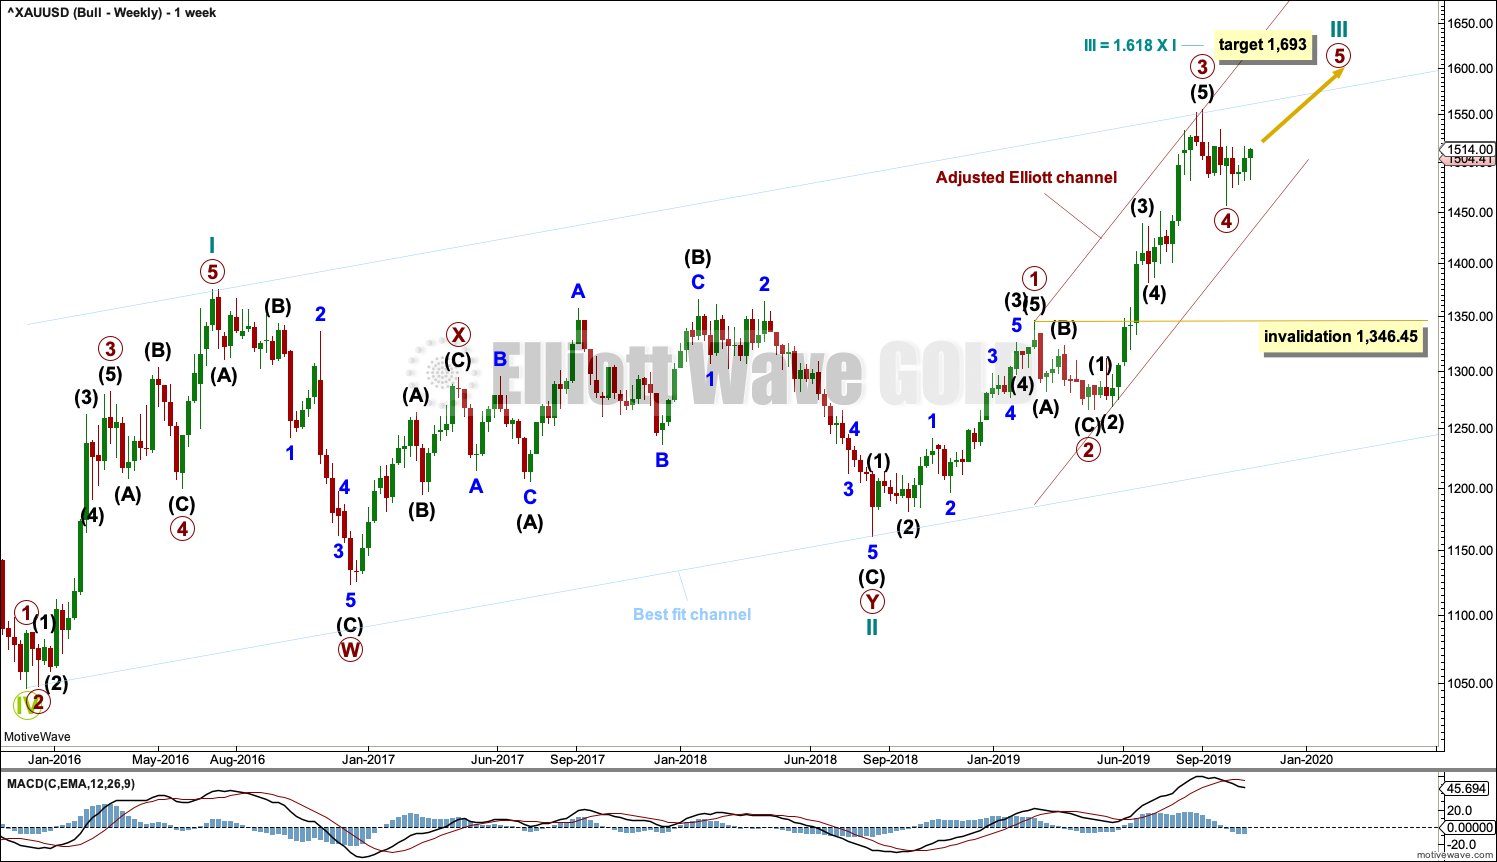
WEEKLY CHART
Click chart to enlarge.
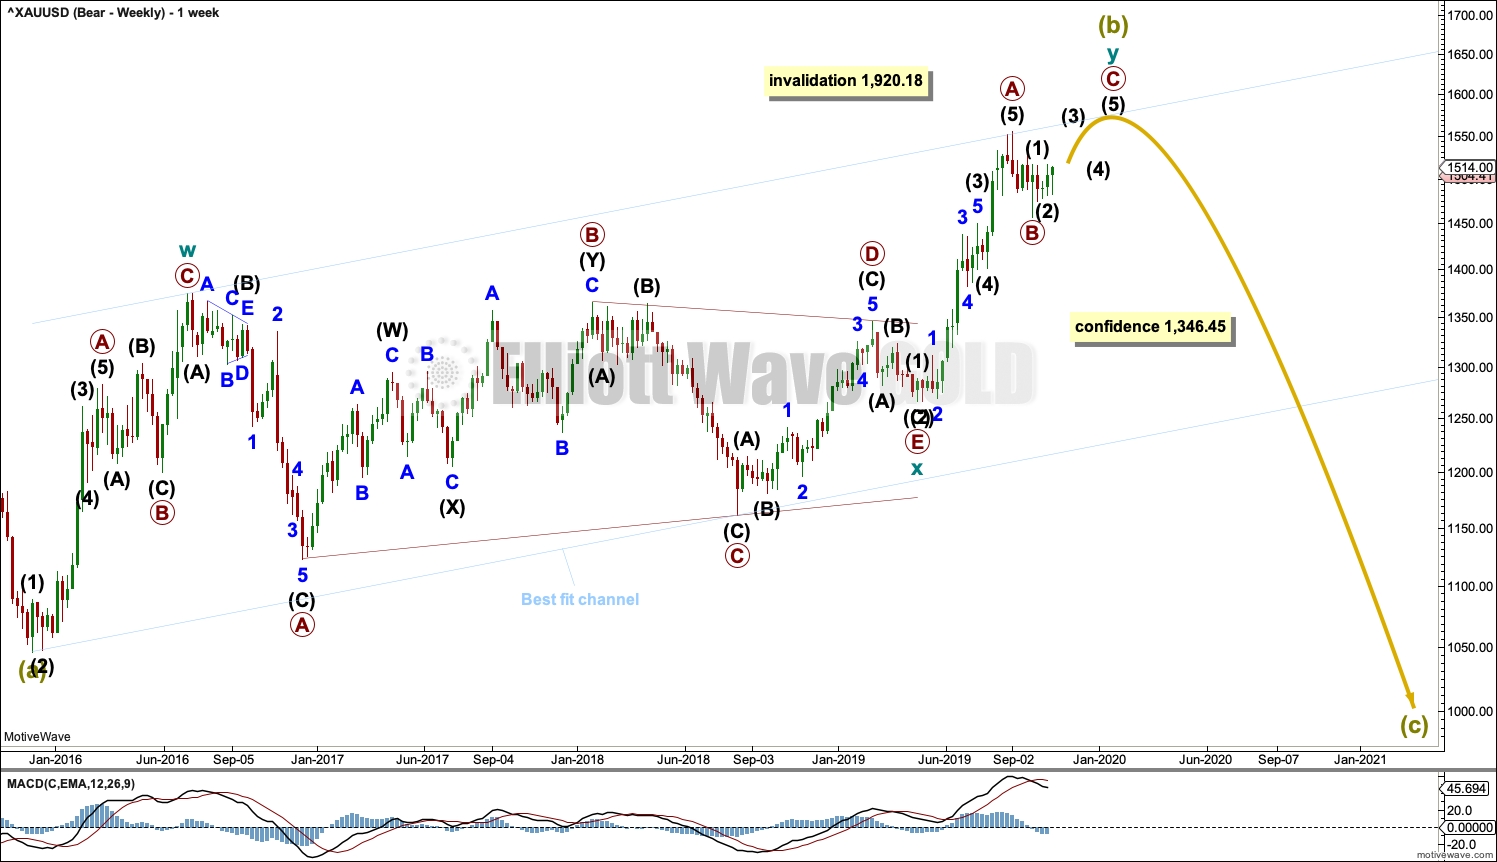
It is possible that Super Cycle wave (b) is nearly complete as a double zigzag.
The first zigzag in the double is labelled cycle wave w. The double is joined by a three in the opposite direction, a triangle labelled cycle wave x. The second zigzag in the double is labelled cycle wave y.
The purpose of the second zigzag in a double is to deepen the correction. Cycle wave y has achieved this purpose.
A new low below 1,346.45 would add strong confidence to this wave count. At that stage, the bullish Elliott wave count would be invalidated.
A wide best fit channel is added in light blue. This channel contains all of Super Cycle wave (b) and may provide resistance and support. Copy this channel over to daily charts.
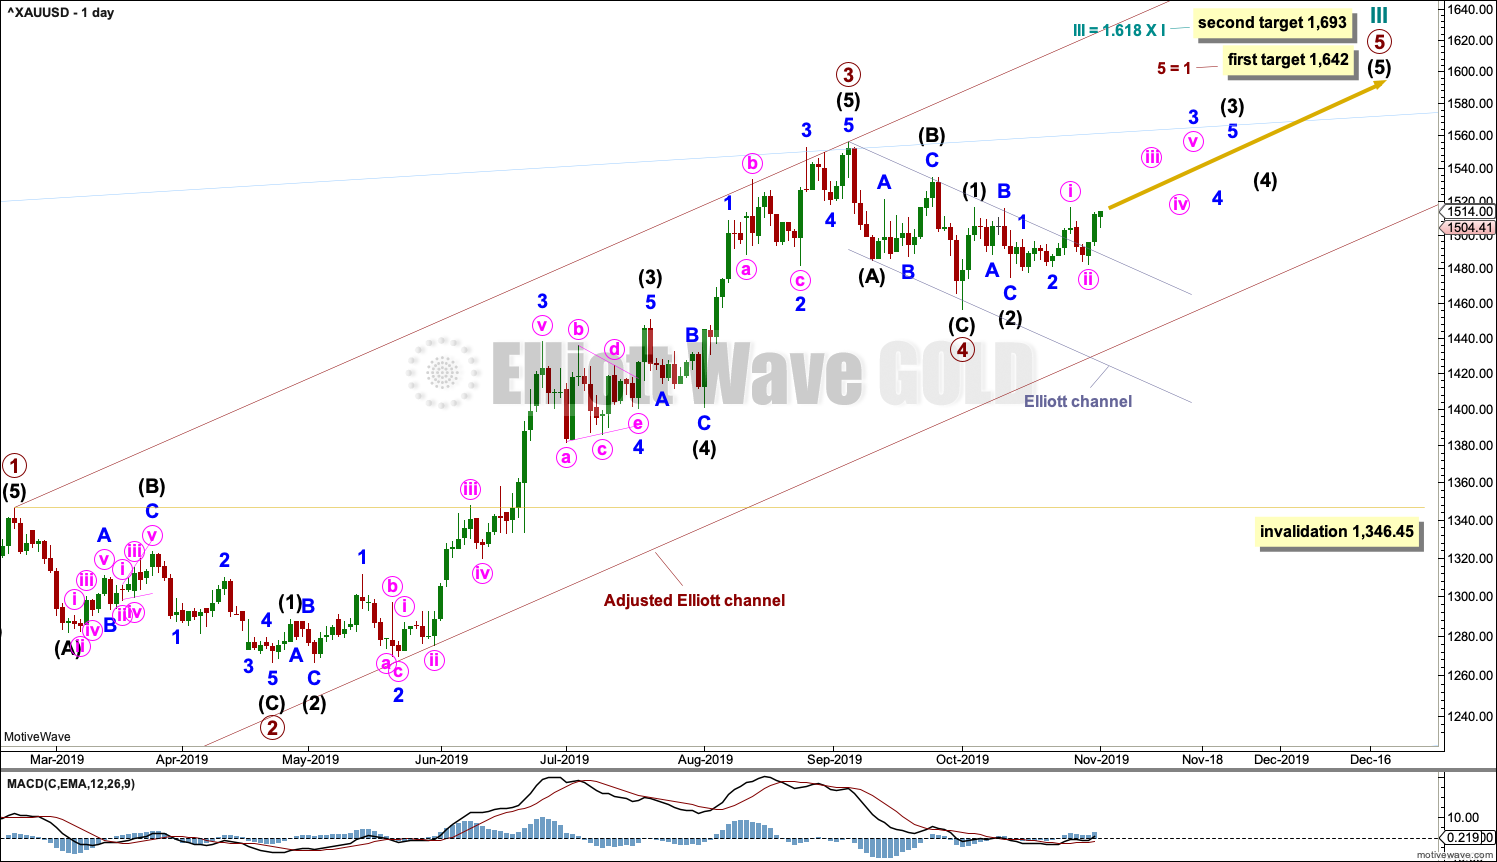
DAILY CHART
Click chart to enlarge.
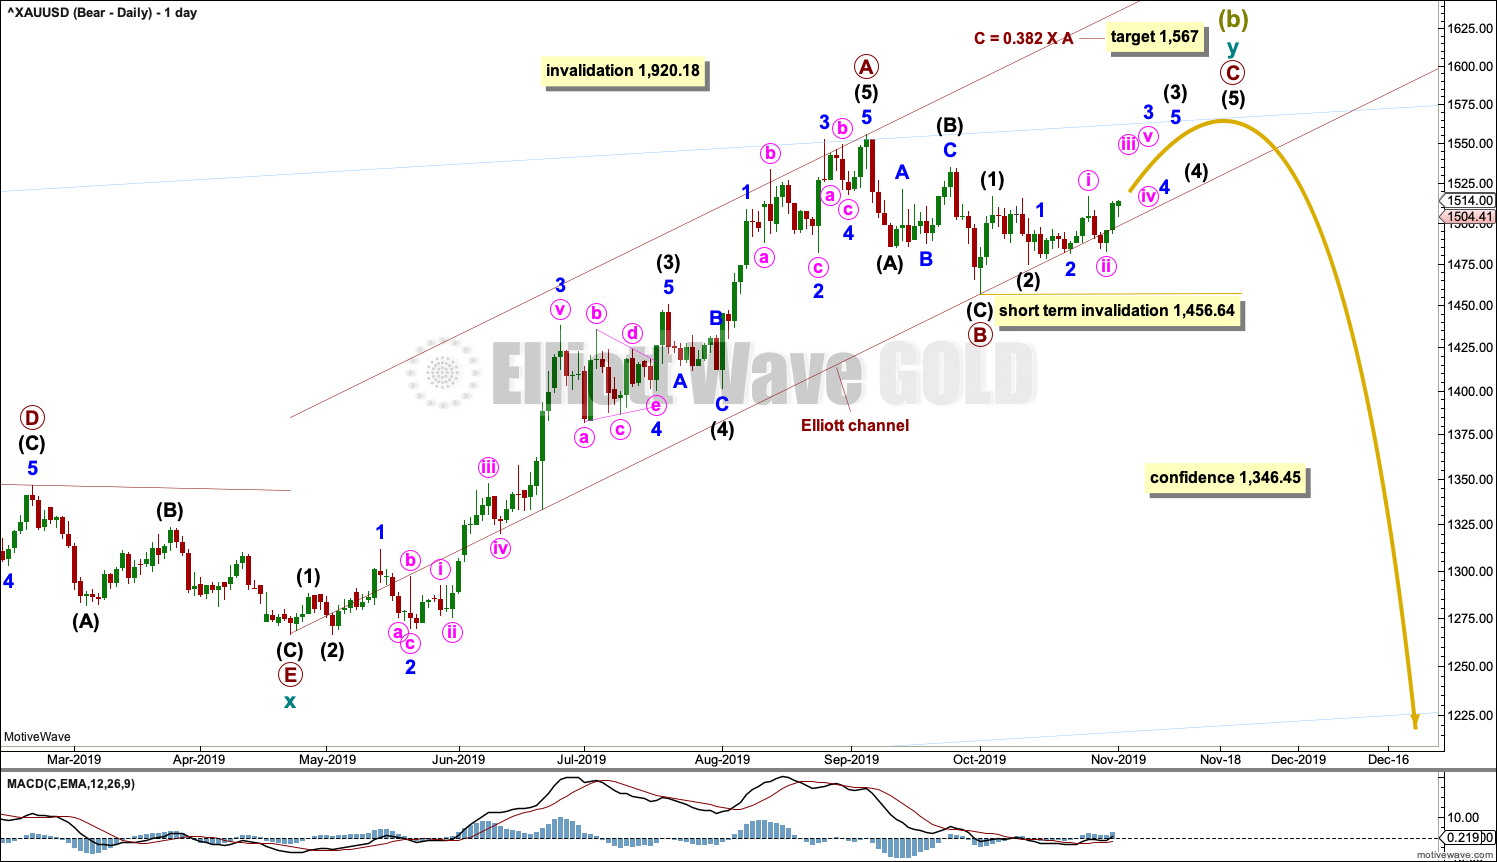
This wave count exactly follows the expected pathway for Silver.
It is possible that the double zigzag for Super Cycle wave (b) may be incomplete and may yet require one more high. A target is calculated for primary wave C that expects resistance at the upper edge of the light blue best fit channel to continue.
Within cycle wave y, primary wave A may have been over at the last high. Primary wave B may now be a complete zigzag. Primary wave C may have begun. Within primary wave C, intermediate wave (2) may not move beyond the start of intermediate wave (1) below 1,456.64.
A channel is drawn about cycle wave y using Elliott’s technique for a correction. This channel is breached by some downwards movement.
It is possible to move the degree of labelling within intermediate wave (B) down one degree; intermediate wave (B) may still continue lower as a double zigzag. Within the double, wave X may be completing. If intermediate wave (B) continues lower, it would still have good proportion to intermediate wave (A). Intermediate wave (B) may not move beyond the start of intermediate wave (A) below 1,266.61.
HOURLY CHART
Click chart to enlarge.
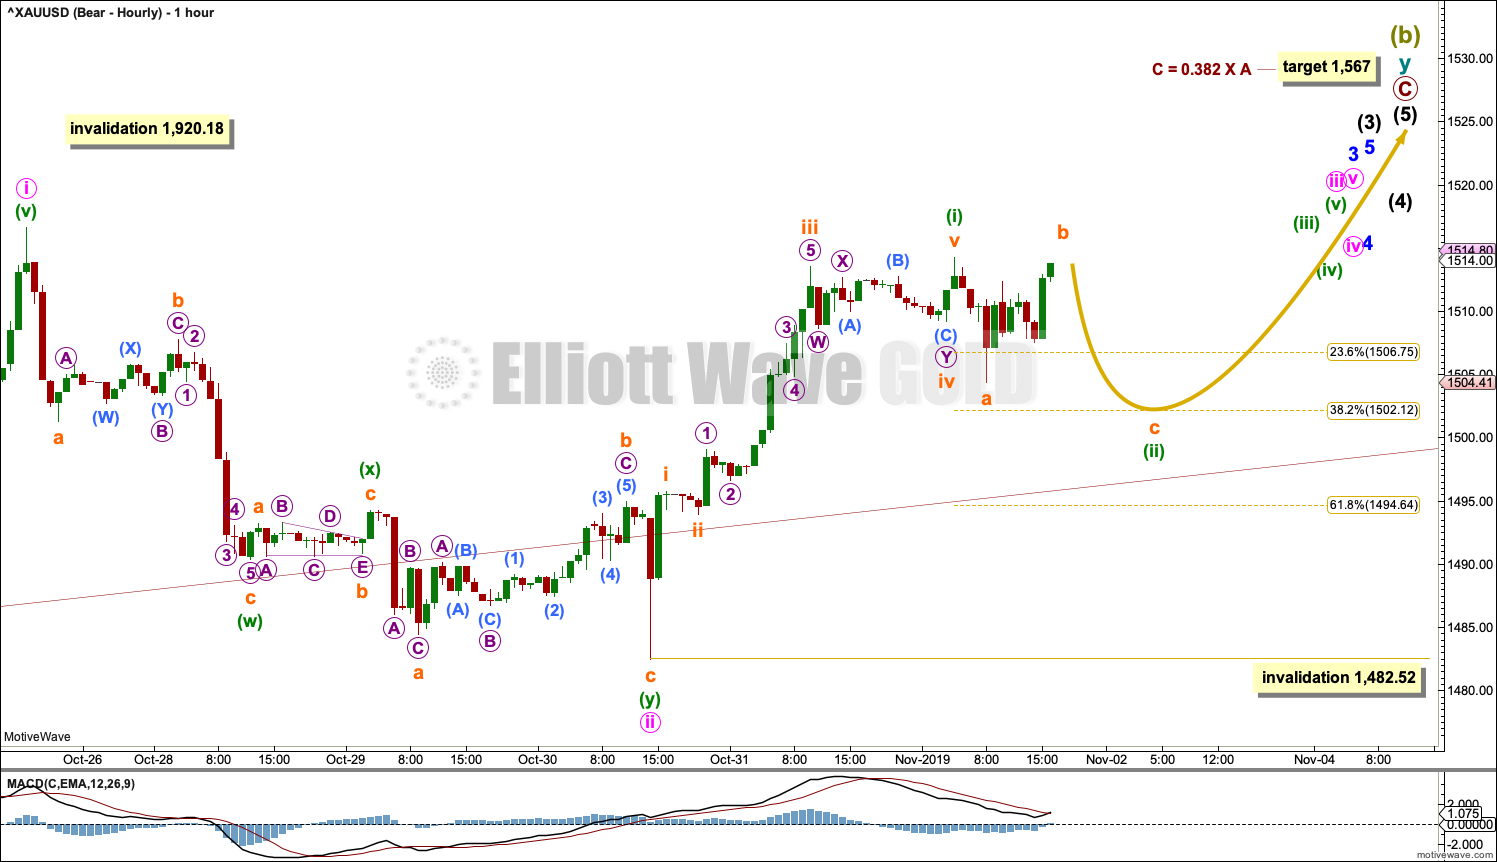
This hourly chart shows all movement from the end of minute wave i.
All of intermediate wave (3), minor wave 3 and minute wave iii may only subdivide as impulses. Within minute wave iii, minuette wave (ii) may not move beyond the start of minuette wave (i) below 1,482.52.
ALTERNATE DAILY CHART
Click chart to enlarge.
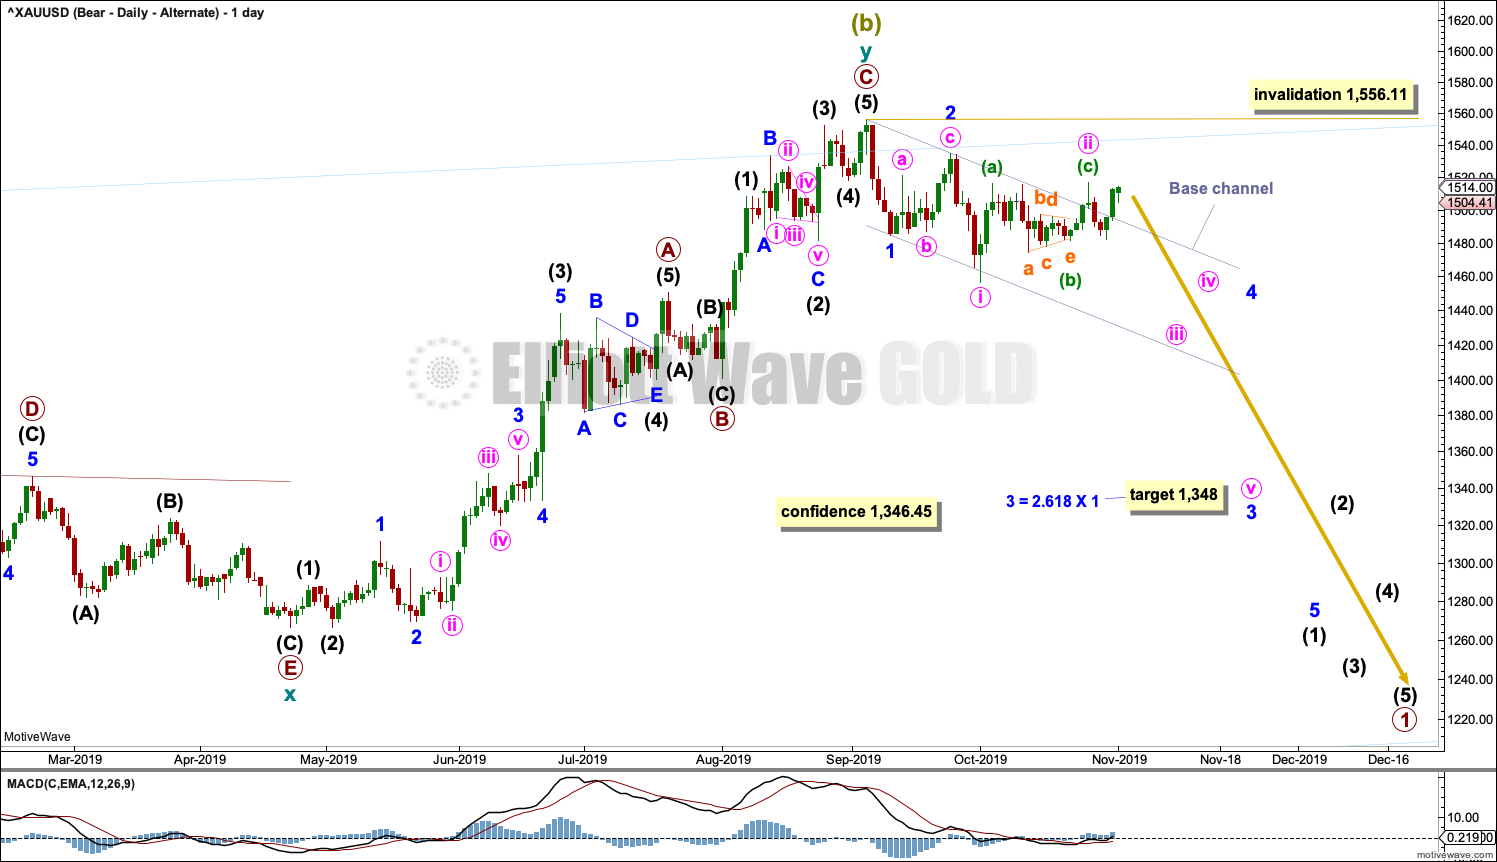
Cycle wave y may be a complete zigzag. Within both of primary waves A and C, there is good proportion between intermediate waves (2) and (4). Within both of primary waves A and C, there is good alternation in structure of intermediate waves (2) and (4).
Within cycle wave y, there is no Fibonacci Ratio between primary waves A and C.
Draw a base channel on daily and hourly charts about minor waves 1 and 2. Draw the first trend line from the start of minor wave 1 to the end of minor wave 2, then place a parallel copy on the end of minor wave 1.
Gold does not always fit neatly within base channels. Occasionally, second wave corrections can be deep and time consuming and can breach base channels. This wave count remains valid. A very strong breach of the base channel reduces the probability of this wave count.
ALTERNATE HOURLY CHART
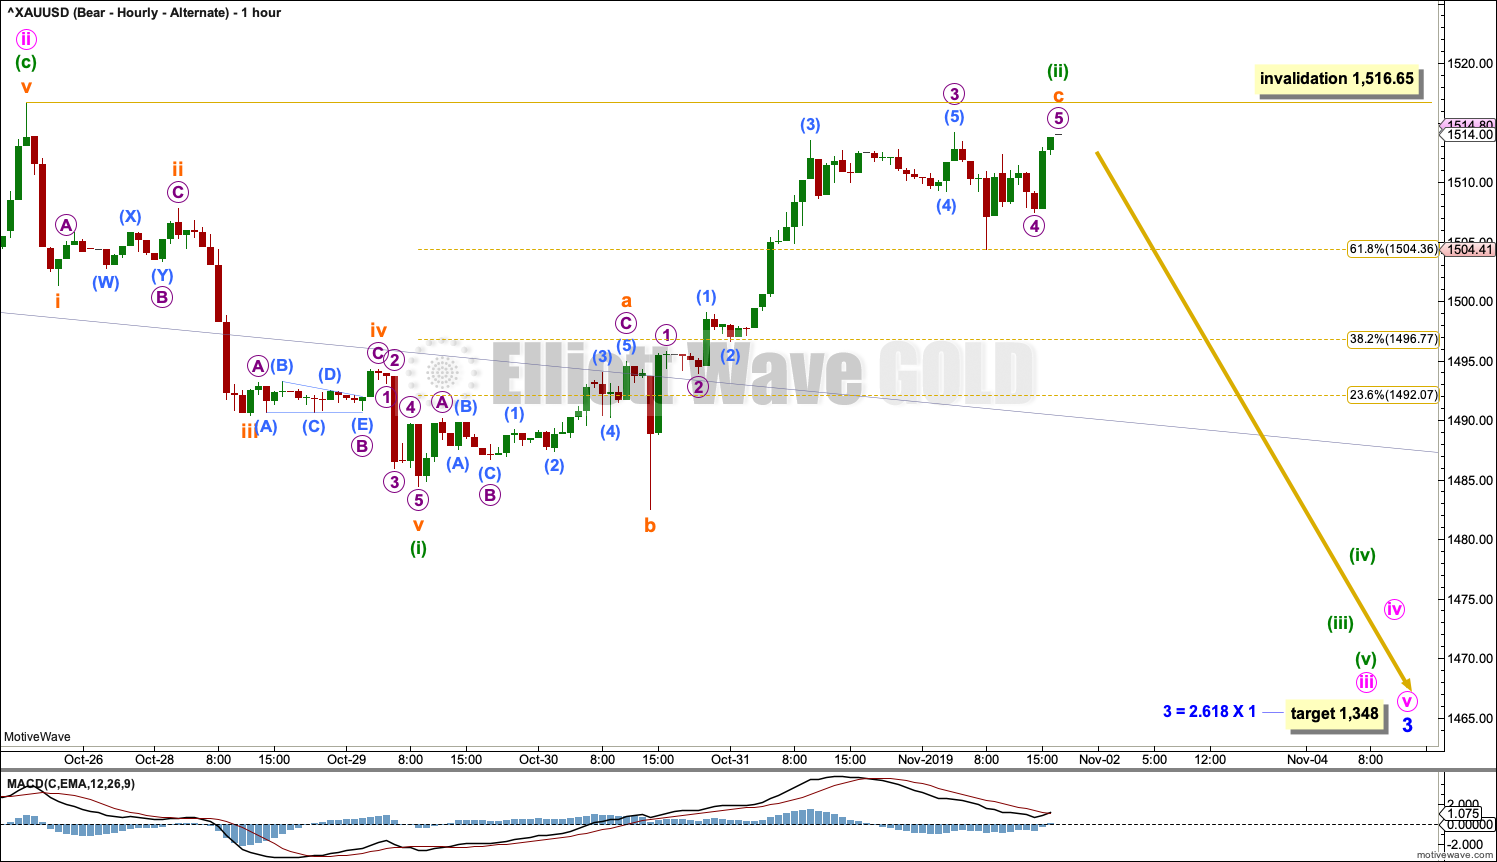
Click chart to enlarge.
Minute wave ii may be complete. This wave count now expects a third wave down at two degrees has begun.
Minute wave iii may only subdivide as an impulse. Within the impulse, minuette wave (i) may be complete.
The structure of minuette wave (ii) no longer looks right for this wave count. It is still labelled as an expanded flat correction. Minuette wave (ii) may not move beyond the start of minuette wave (i) above 1,516.65.
BULLISH ELLIOTT WAVE COUNT
WEEKLY CHART
Click chart to enlarge.
This wave count sees the the bear market complete at the last major low for Gold in November 2015.
If Gold is in a new bull market, then it should begin with a five wave structure upwards on the weekly chart. However, the biggest problem with this wave count is the structure labelled cycle wave I because this wave count must see it as a five wave structure, but it looks more like a three wave structure.
Commodities often exhibit swift strong fifth waves that force the fourth wave corrections coming just prior and just after to be more brief and shallow than their counterpart second waves. It is unusual for a commodity to exhibit a quick second wave and a more time consuming fourth wave, and this is how cycle wave I is labelled. This wave count still suffers from this very substantial problem, and for this reason the bearish wave count is still considered because it has a better fit in terms of Elliott wave structure.
Cycle wave II subdivides well as a double combination: zigzag – X – expanded flat.
Cycle wave III may have begun. Within cycle wave III, primary waves 1 and 2 may now be complete. Primary wave 3 has now moved above the end of primary wave 1 meeting a core Elliott wave rule. It has now moved far enough to allow room for primary wave 4 to unfold and remain above primary wave 1 price territory. Primary wave 4 may not move into primary wave 1 price territory below 1,346.45.
Cycle wave III so far for this wave count would have been underway now for 63 weeks. It exhibits some support from volume and increasing ATR. This wave count has some support from classic technical analysis.
The channel drawn about cycle wave III is an adjusted Elliott channel. The lower edge is pulled lower.
Add the wide best fit channel to weekly and daily charts.
DAILY CHART
Click chart to enlarge.
Primary wave 4 is possibly complete. The structure now fits as a zigzag. It is possible that primary wave 4 could continue lower as a double zigzag. However, if primary wave 4 did continue lower, it would have to be longer in duration to primary wave 2. The proportion would not look good. This wave count would look best if primary wave 4 is over as labelled.
Primary wave 2 lasted 43 sessions. Primary wave 4 may have been over in 19 sessions. Gold’s fourth waves are often more brief in duration than its second waves; this part of the wave count has the right look.
Primary wave 4 may not move into primary wave 1 price territory below 1,346.45.
HOURLY CHART
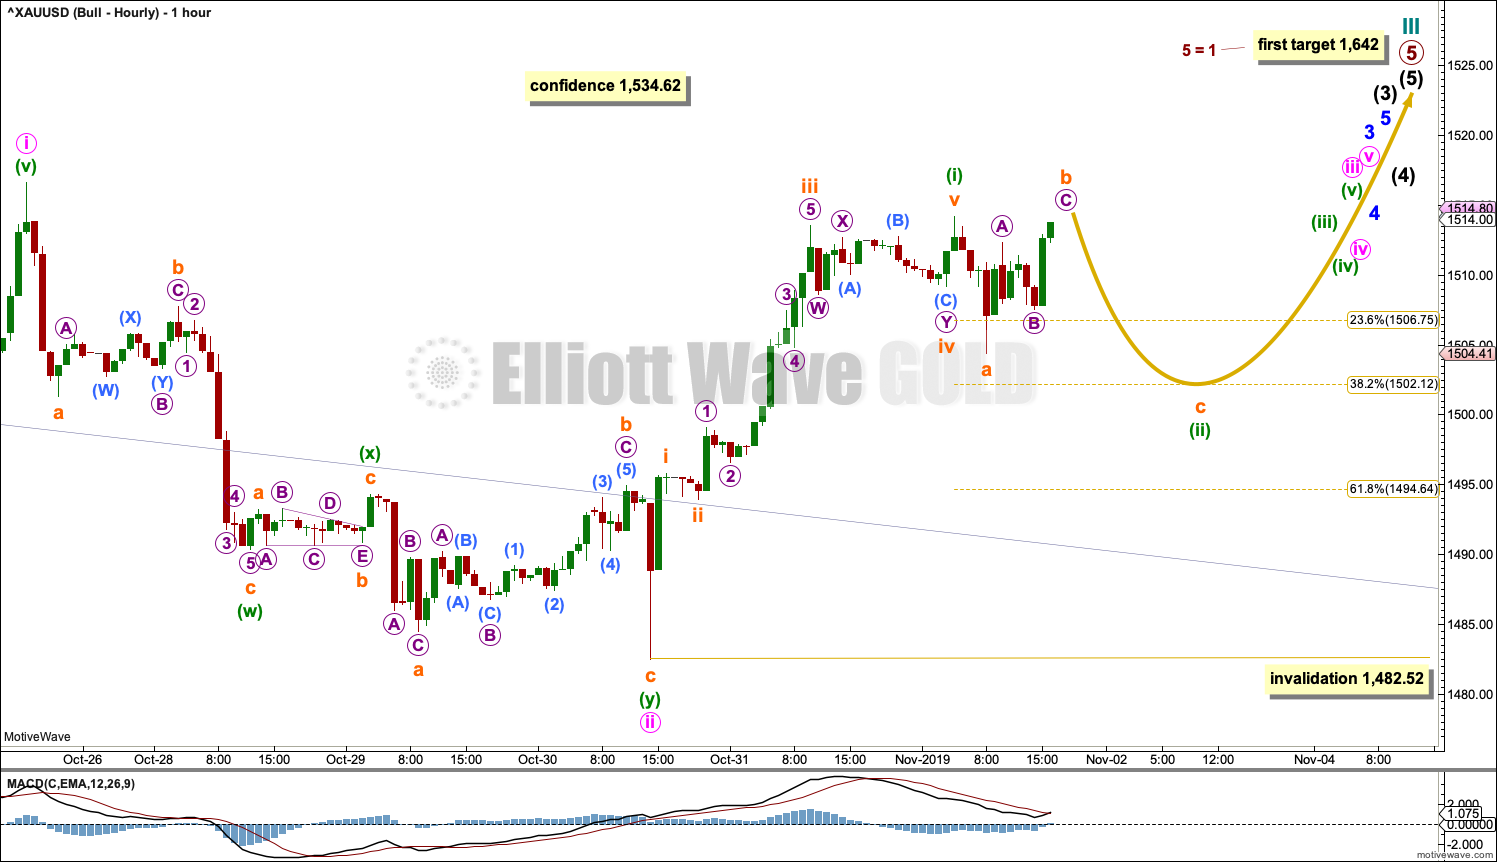
Click chart to enlarge.
This hourly chart shows all price movement from the end of minor wave 2.
Minor wave 3 may only subdivide as an impulse. Within the impulse, minute wave i may be over. Minute wave ii may now be complete as a double combination. Minute wave iii may have begun.
Within minute wave iii, minuette wave (ii) may not move beyond the start of minuette wave (i) below 1,482.52.
TECHNICAL ANALYSIS
MONTHLY CHART
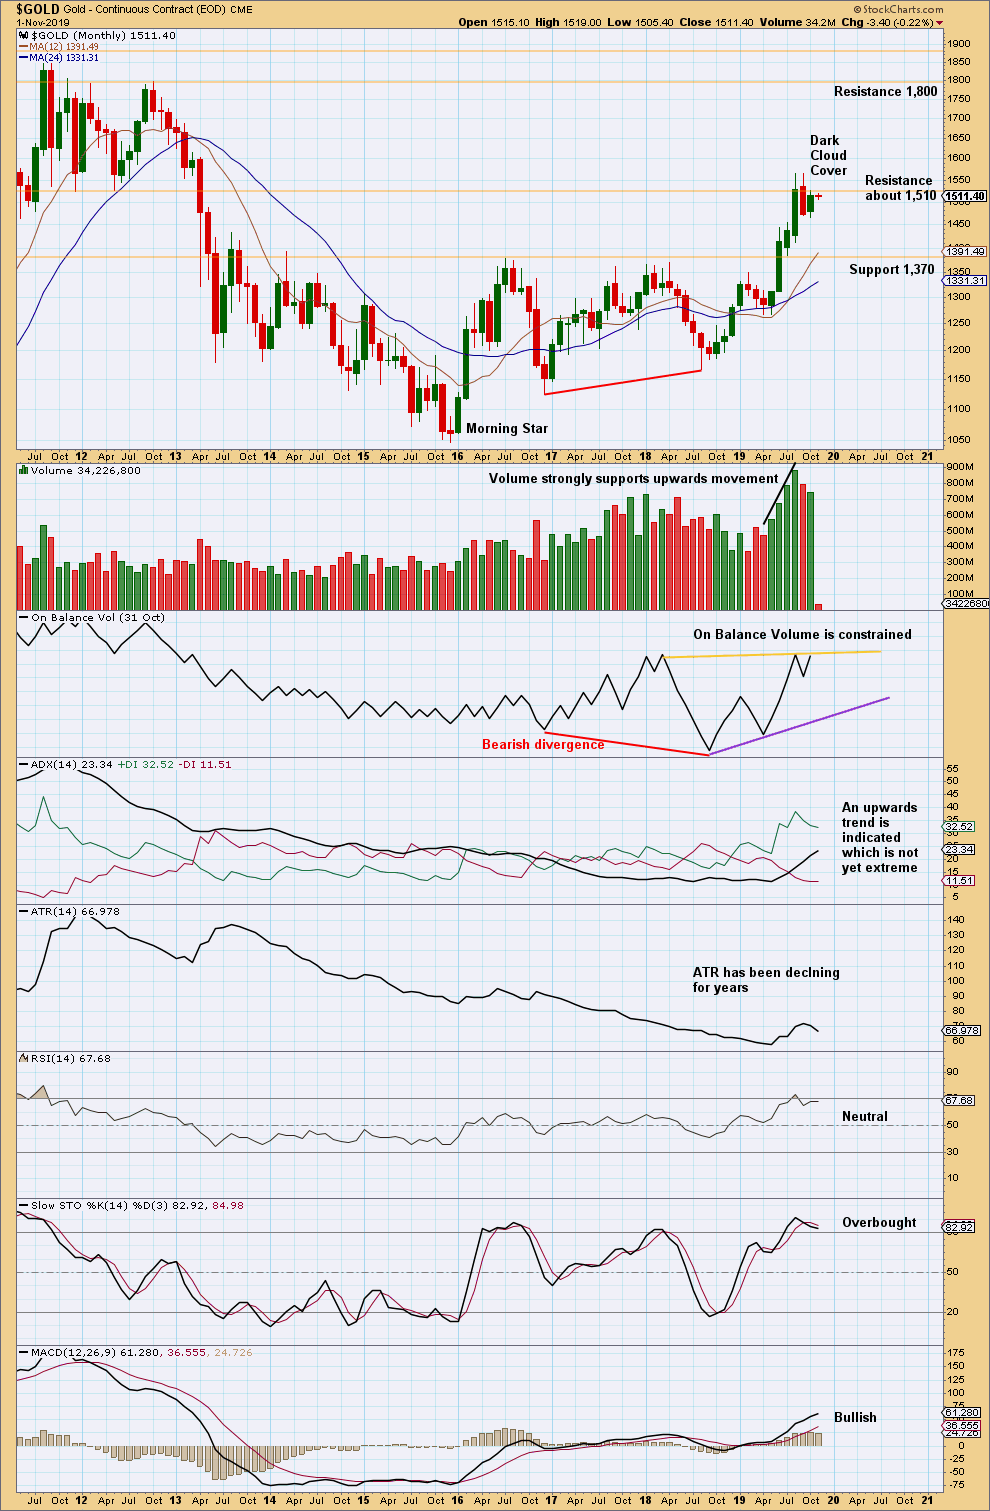
Click chart to enlarge. Chart courtesy of StockCharts.com.
Overall, this chart is bullish. However, with RSI reaching overbought at the last high, upwards movement may be limited.
The last two months of sideways movement look like a consolidation within an ongoing upwards trend.
Some suspicion regarding the current upwards trend may be warranted by bearish divergence between price and On Balance Volume at the last lows.
WEEKLY CHART
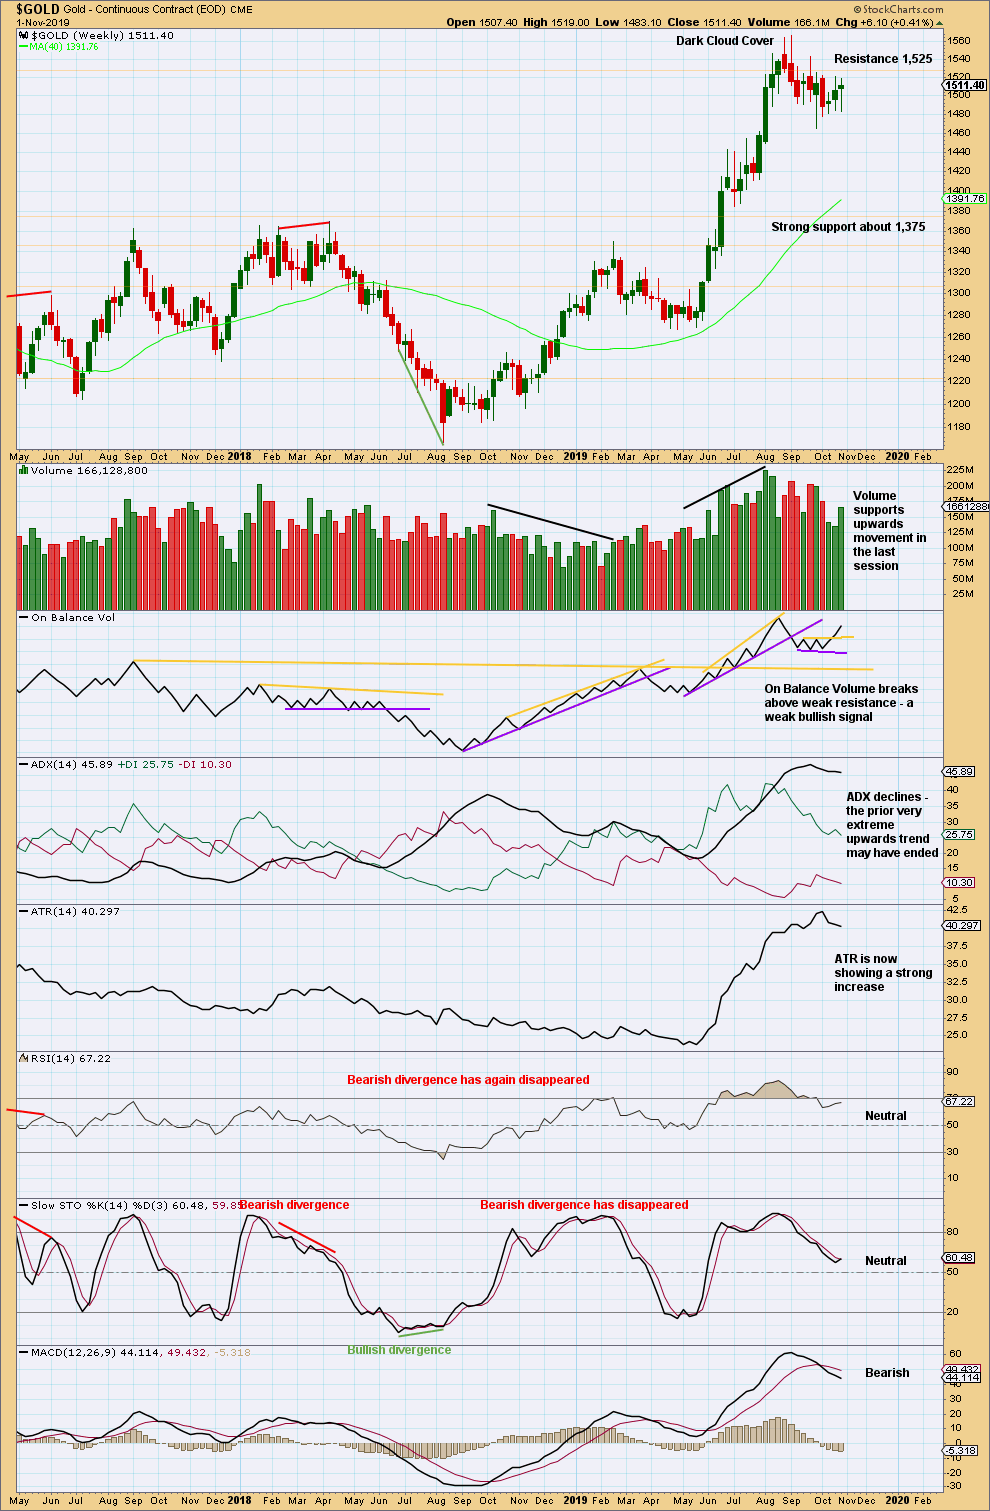
Click chart to enlarge. Chart courtesy of StockCharts.com.
When trends reach very extreme, candlestick reversal patterns should be given weight. The Dark Cloud Cover bearish reversal pattern is given more bearish weight from the long upper wick.
This pullback has brought RSI and Stochastics down from overbought and ADX down from very extreme. It looks like a high may be in place for Gold, but it is also possible that one final high may yet be seen before a major trend change.
For the short term, the picture is looking slightly more clearly bullish. Long lower wicks, support from volume for upwards movement, and a bullish signal from On Balance Volume all suggest more upwards movement just ahead.
DAILY CHART
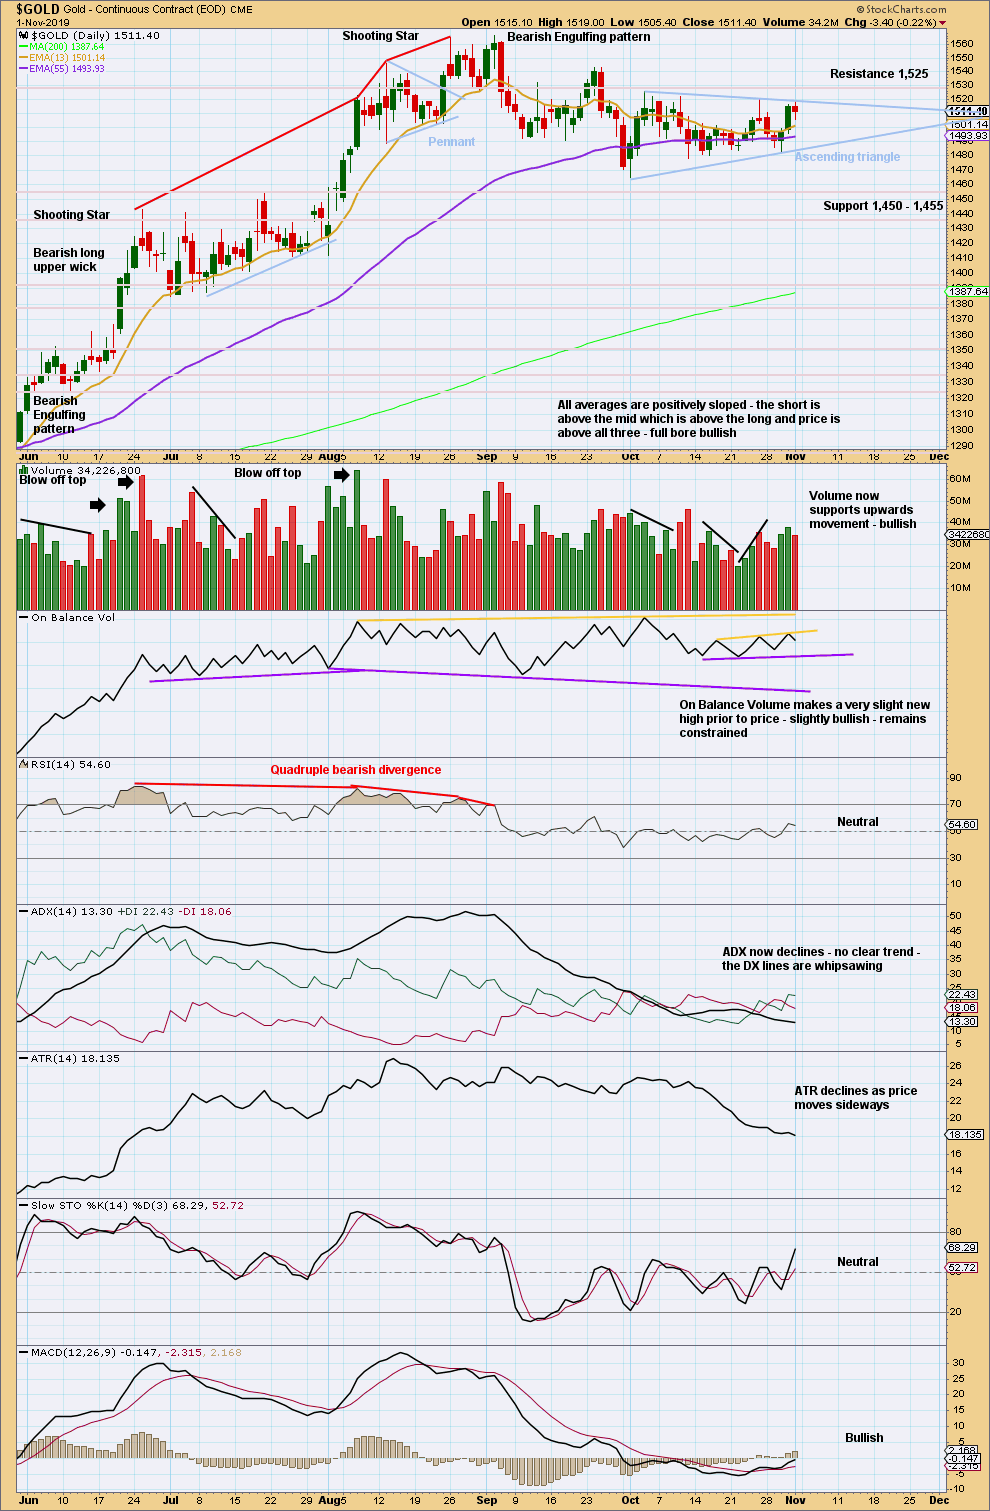
Click chart to enlarge. Chart courtesy of StockCharts.com.
Since the last high on the 4th of September, there has been a new swing low (on the 30th of September) and now a series of (so far) two lower swing lows and two lower swing highs. In conjunction with a very strong Bearish Engulfing pattern on the 5th of September and the prior upwards trend reaching very extreme, it looks like Gold may have had a trend change.
A reasonably small ascending triangle may be unfolding.
From Kirkpatrick and Dhalquist, “Technical Analysis” page 317:
“Upwards breakouts occur 77% of the time, and all breakouts usually happen roughly 61% of the distance (time) from the base to the cradle.”
A breakout may now happen in about another 9 sessions. A target would be about 1,578.
Volume and On Balance Volume support the view that an upwards breakout may occur soon.
GDX WEEKLY CHART
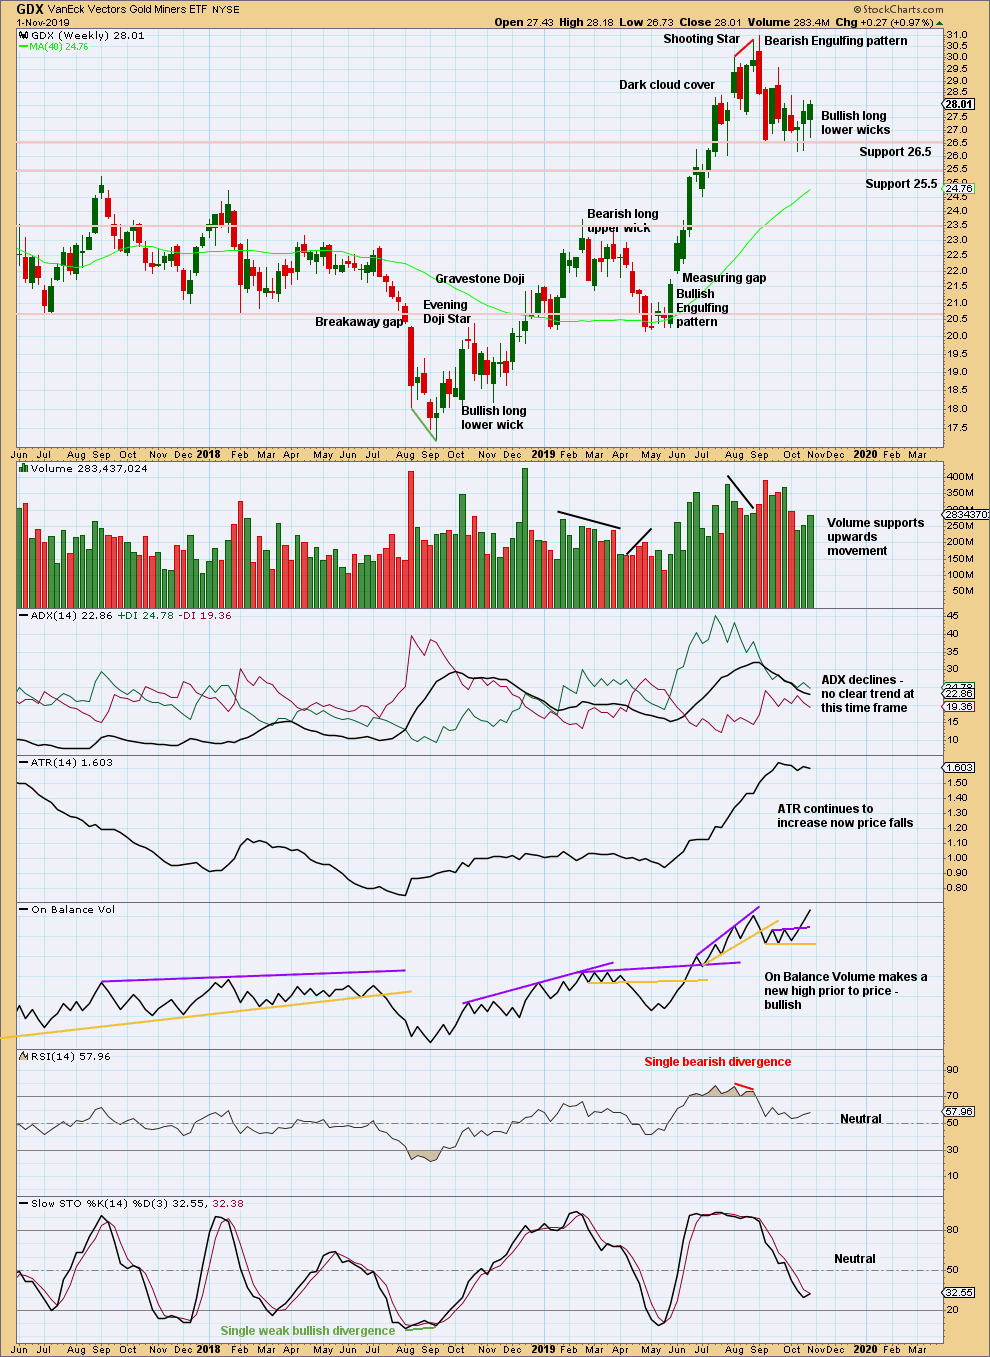
Click chart to enlarge. Chart courtesy of StockCharts.com.
The short term picture for GDX remains bullish. ADX and RSI have been bought down from extreme. There is again room for an upwards trend to continue.
GDX DAILY CHART
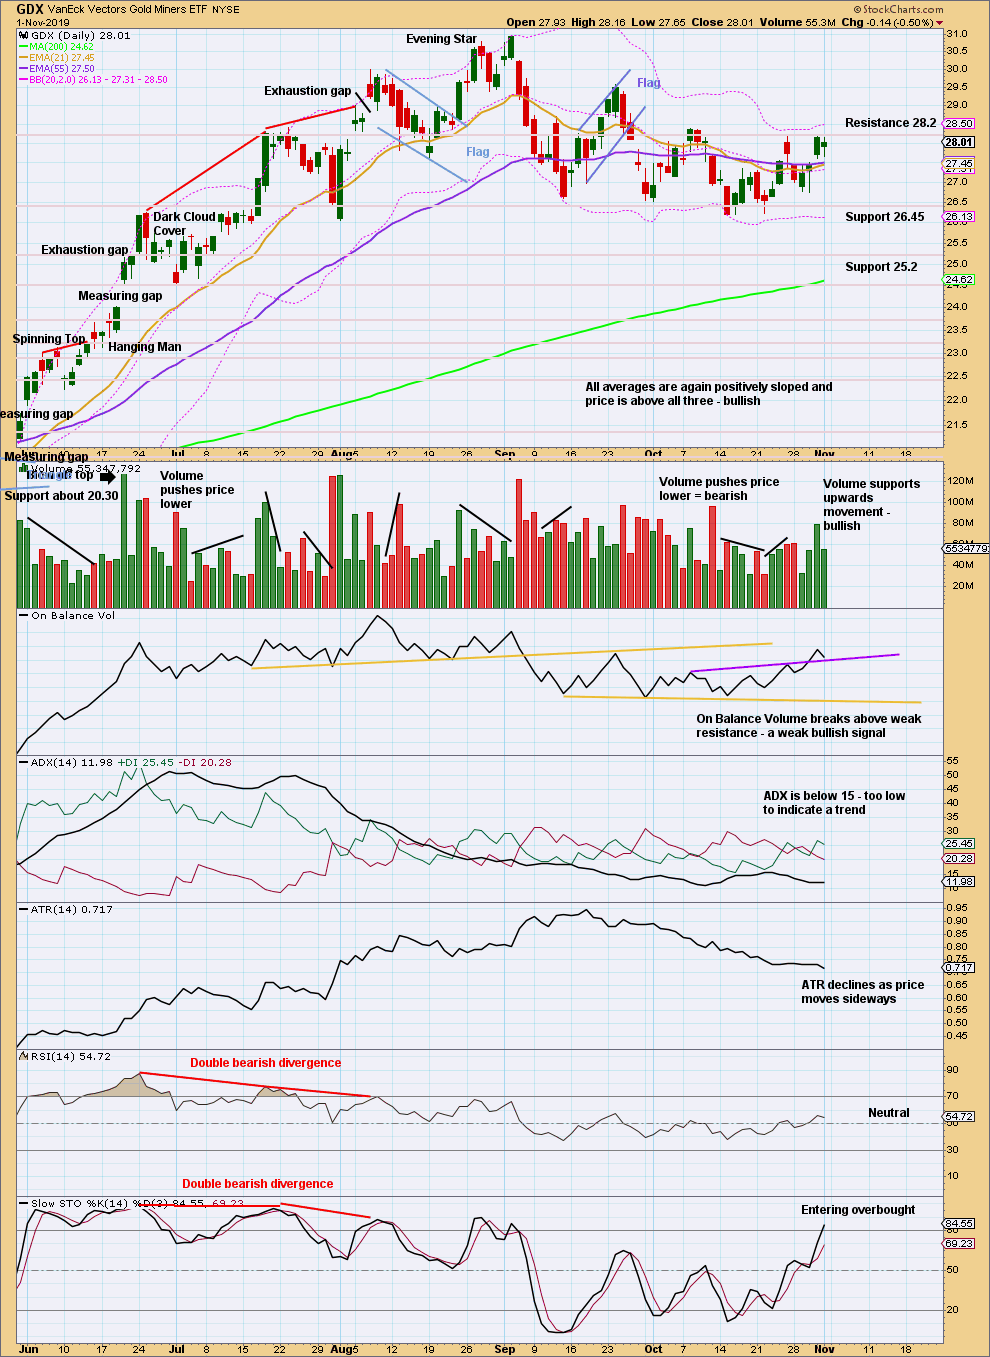
Click chart to enlarge. Chart courtesy of StockCharts.com.
There is now a series of three lower highs and three lower lows from the high on the 4th of September. It still looks like GDX may have had a trend change. This view should remain dominant while the last swing high at 28.38 on the 8th of October remains intact.
GDX continues to look bullish for the very short term. Upwards movement may be expected as fairly likely next week.
Published @ 10:28 p.m. EST.
—
Careful risk management protects your trading account(s).
Follow my two Golden Rules:
1. Always trade with stops.
2. Risk only 1-5% of equity on any one trade.
—
New updates to this analysis are in bold.
Hourly bear chart updated
the hourly bull is essentially the same