
Bounce was expected to end about 1,472. Price has continued higher to reach 1,473.35 for this session.
Summary: This bounce may be over here. If it continues any higher, then it may be for only one more day. It may end about 1,480, where the lower triangle trend line may provide resistance (daily technical analysis chart).
The downwards trend may now resume. The Elliott wave target is at 1,348.
A target calculated from the triangle is about 1,431.
For the very short term, a new high above 1,514.29 would add some confidence in a more bullish outlook. The target would then be at 1,567, 1,635 or 1,693.
For the bigger picture, the bearish Elliott wave count expects a new downwards trend to last one to several years has begun. The alternate bearish wave count looks at the possibility that one final high to 1,559 is required first.
The bullish Elliott wave count expects a primary degree fourth wave has completed and the upwards trend has resumed.
Grand SuperCycle analysis is here.
Monthly charts were last published here.
BEARISH ELLIOTT WAVE COUNT
WEEKLY CHART
Click chart to enlarge.
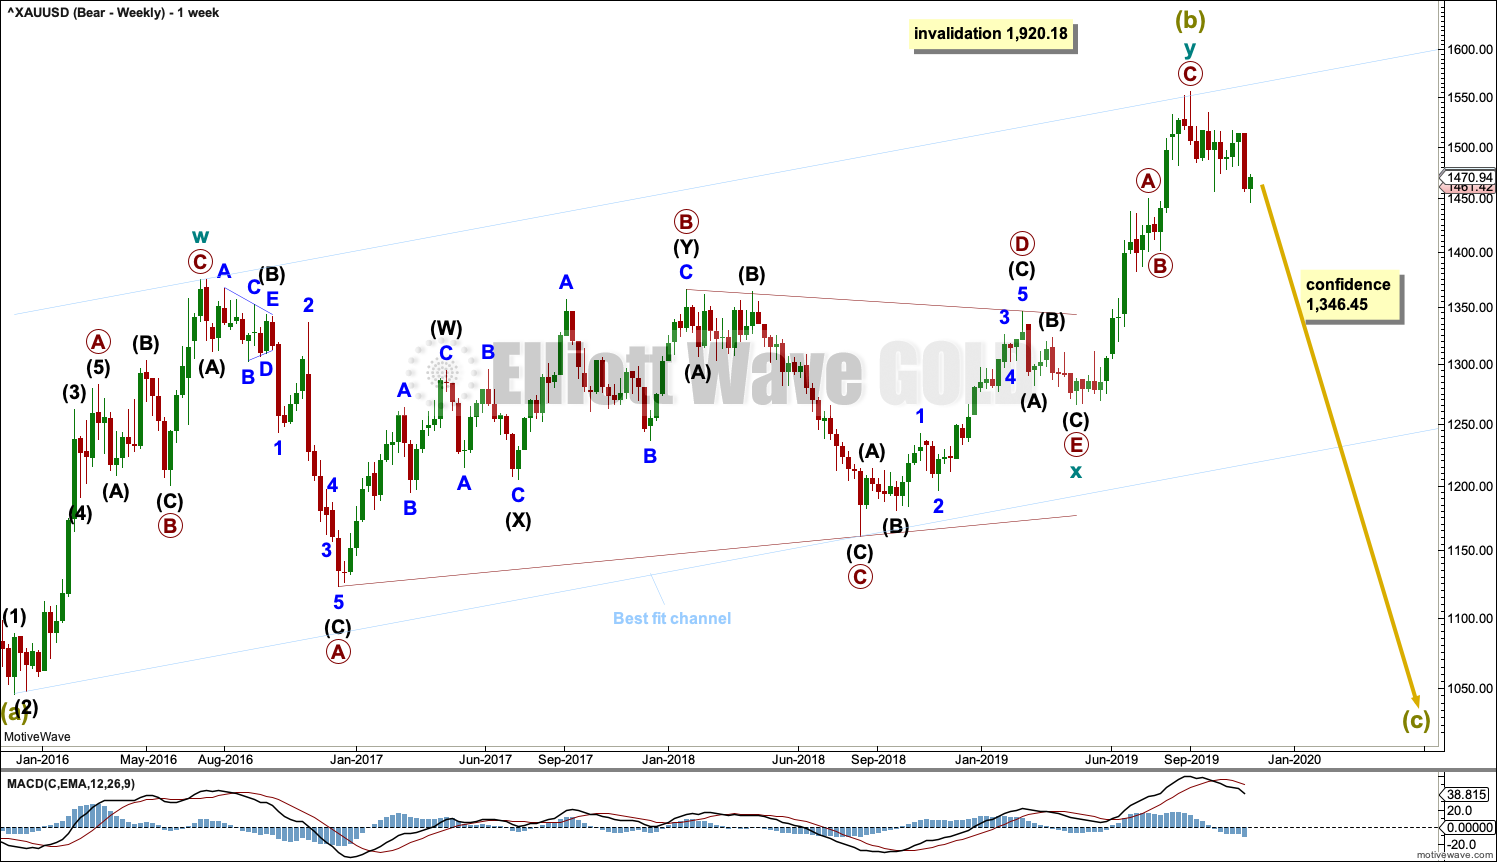
It is possible that Super Cycle wave (b) is nearly complete as a double zigzag.
The first zigzag in the double is labelled cycle wave w. The double is joined by a three in the opposite direction, a triangle labelled cycle wave x. The second zigzag in the double is labelled cycle wave y.
The purpose of the second zigzag in a double is to deepen the correction. Cycle wave y has achieved this purpose.
A new low below 1,346.45 would add strong confidence to this wave count. At that stage, the bullish Elliott wave count would be invalidated.
A wide best fit channel is added in light blue. This channel contains all of Super Cycle wave (b) and may provide resistance and support. Copy this channel over to daily charts.
Super Cycle wave (c) must subdivide as a five wave structure, most likely an impulse. It may last several years. It would be very likely to make new lows below the end of Super Cycle wave (a) at 1,046.27 to avoid a truncation.
DAILY CHART
Click chart to enlarge.
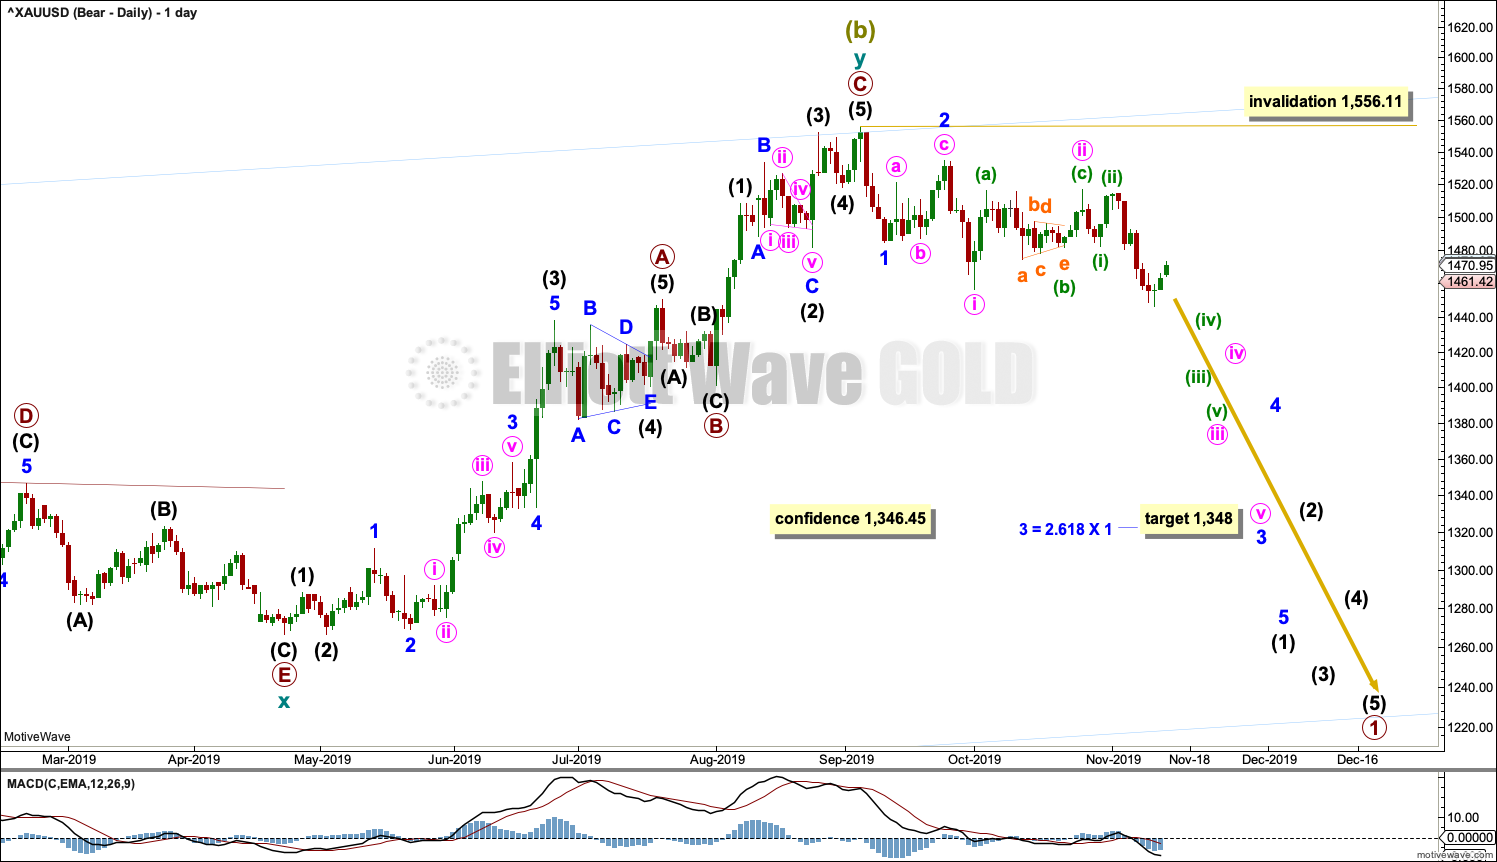
Classic analysis now reasonably supports this wave count.
Cycle wave y may be a complete zigzag. Within both of primary waves A and C, there is good proportion between intermediate waves (2) and (4). Within both of primary waves A and C, there is good alternation in structure of intermediate waves (2) and (4).
Within cycle wave y, there is no Fibonacci Ratio between primary waves A and C.
If there has been a trend change at Super Cycle degree, then a five down needs to develop on the daily and weekly charts. So far that is incomplete. It will be labelled intermediate wave (1).
HOURLY CHART
Click chart to enlarge.
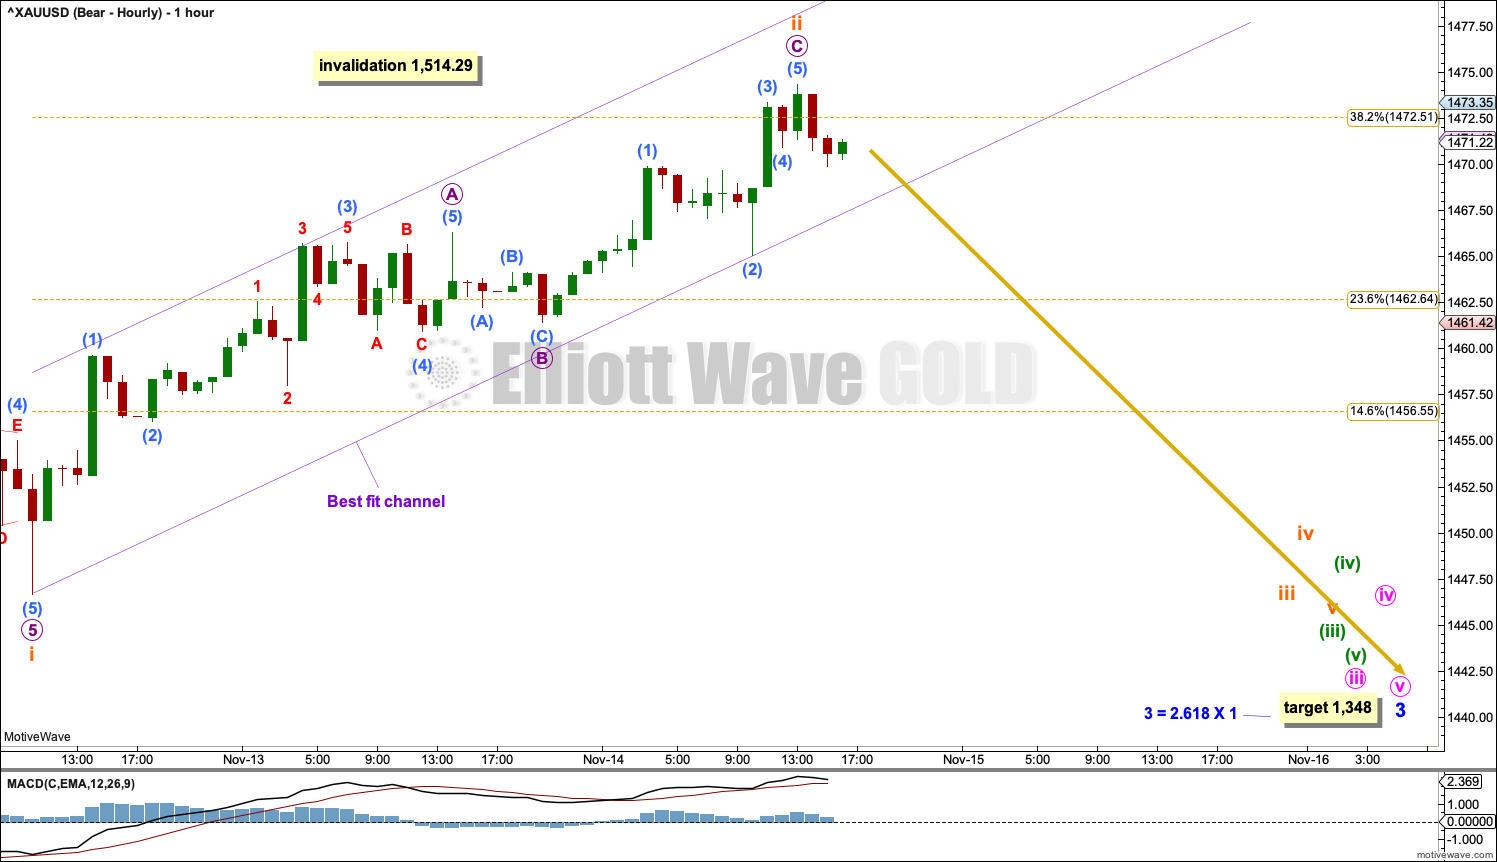
Subminuette wave ii may now be a complete single zigzag.
A best fit channel is drawn about subminuette wave ii. When this small channel is breached by downwards movement (not sideways), then that may be taken as an indication that the bounce is over and the downwards trend has resumed. Risk remains that the bounce may continue higher while price remains within the channel. The 0.618 Fibonacci ratio is at 1,488.46, but this may not be met as there is strong resistance above about 1,480.
Subminuette wave ii may not move beyond the start of subminuette wave i above 1,514.29.
This wave count now expects that soon there may be a series of four overlapping first and second waves complete. An increase in downwards momentum would be expected.
Gold typically exhibits swift strong fifth waves. This tendency is especially prevalant for fifth waves to end third wave impulses. It is possible that any one or more of subminuette wave v, minuette wave (v) or minute wave v may be particularly strong, ending in capitulation spikes.
ALTERNATE DAILY CHART
Click chart to enlarge.
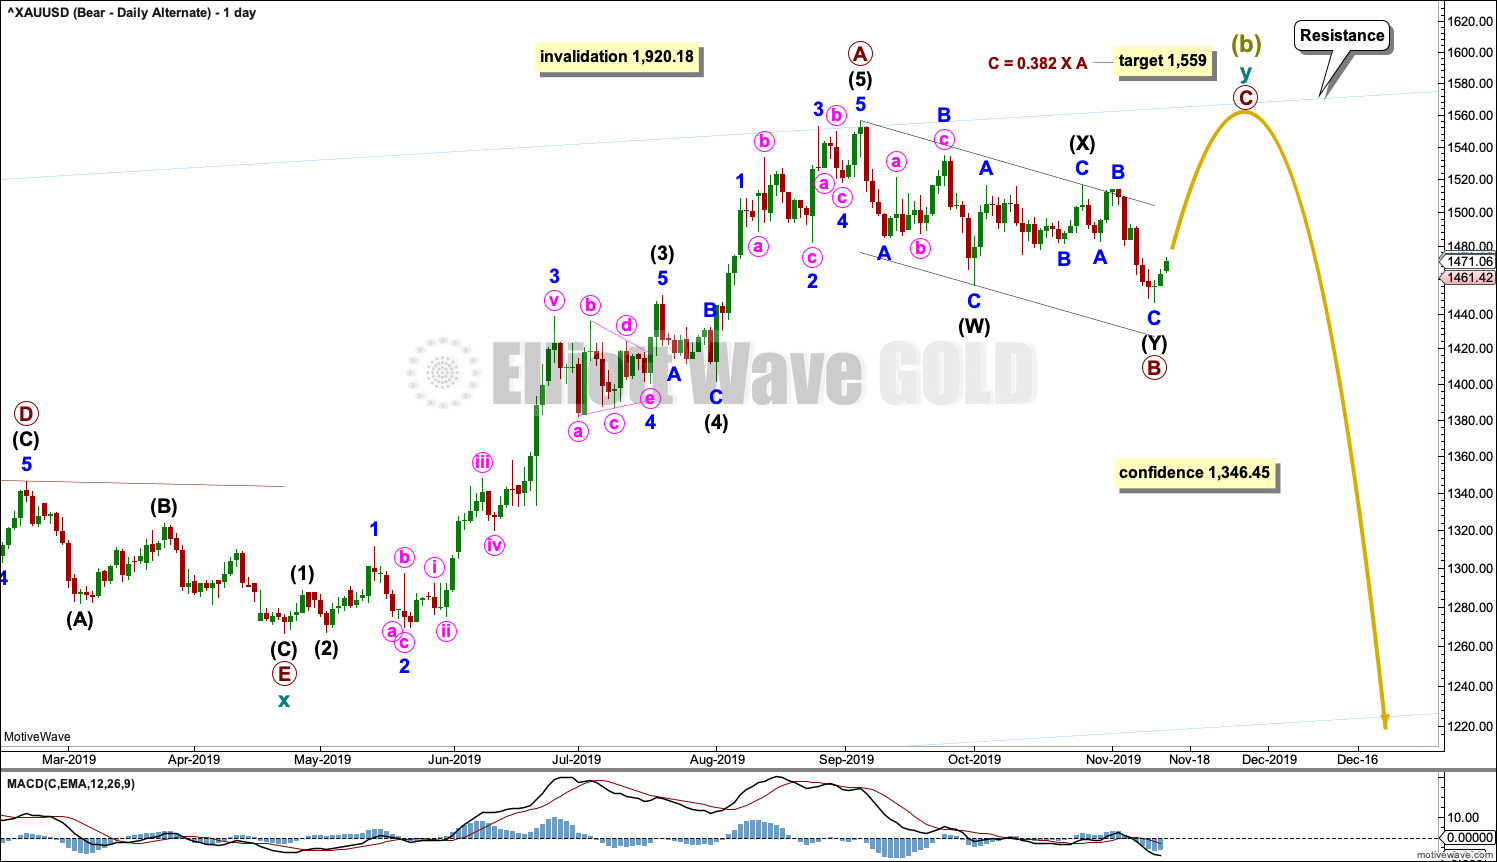
It is possible that the double zigzag for Super Cycle wave (b) may be incomplete and may yet require one more high.
Within cycle wave y, primary wave A may have been over at the last high. Primary wave B may now be complete as a double zigzag. Primary wave B may not move beyond the start of primary wave A below 1,266.61.
Primary wave C would be expected to find strong resistance and end at the upper edge of the blue best fit channel copied over from the weekly chart.
BULLISH ELLIOTT WAVE COUNT
WEEKLY CHART
Click chart to enlarge.
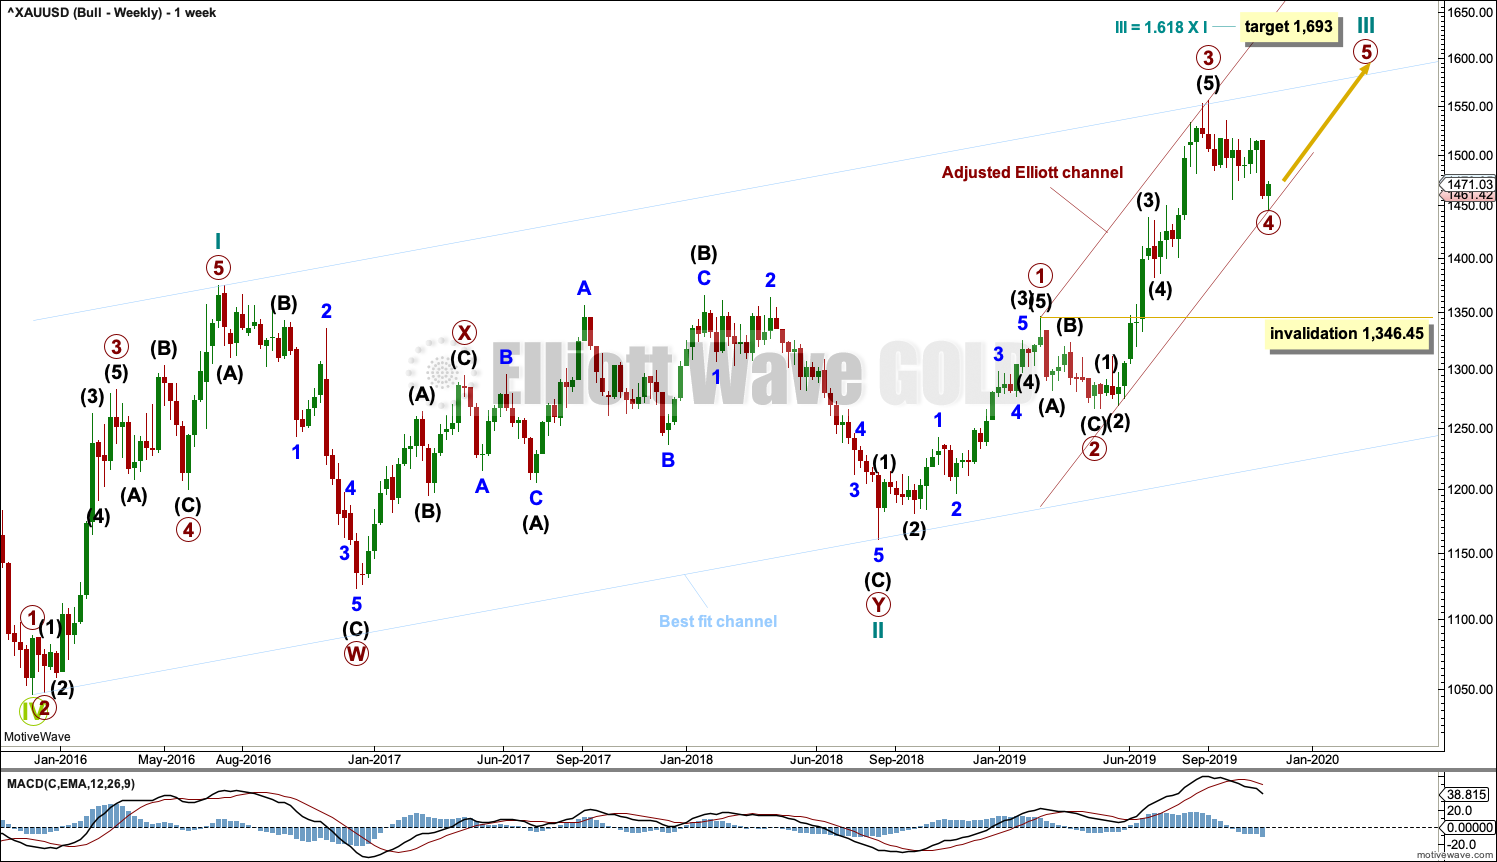
This wave count sees the the bear market complete at the last major low for Gold in November 2015.
If Gold is in a new bull market, then it should begin with a five wave structure upwards on the weekly chart. However, the biggest problem with this wave count is the structure labelled cycle wave I because this wave count must see it as a five wave structure, but it looks more like a three wave structure.
Commodities often exhibit swift strong fifth waves that force the fourth wave corrections coming just prior and just after to be more brief and shallow than their counterpart second waves. It is unusual for a commodity to exhibit a quick second wave and a more time consuming fourth wave, and this is how cycle wave I is labelled. This wave count still suffers from this very substantial problem, and for this reason the bearish wave count is still considered because it has a better fit in terms of Elliott wave structure.
Cycle wave II subdivides well as a double combination: zigzag – X – expanded flat.
Cycle wave III may have begun. Within cycle wave III, primary waves 1 and 2 may now be complete. Primary wave 3 has now moved above the end of primary wave 1 meeting a core Elliott wave rule. It has now moved far enough to allow room for primary wave 4 to unfold and remain above primary wave 1 price territory. Primary wave 4 may not move into primary wave 1 price territory below 1,346.45.
Cycle wave III so far for this wave count would have been underway now for 65 weeks. It exhibits some support from volume and increasing ATR. This wave count has some support from classic technical analysis.
The channel drawn about cycle wave III is an adjusted Elliott channel. The lower edge is pulled lower.
Add the wide best fit channel to weekly and daily charts.
DAILY CHART
Click chart to enlarge.
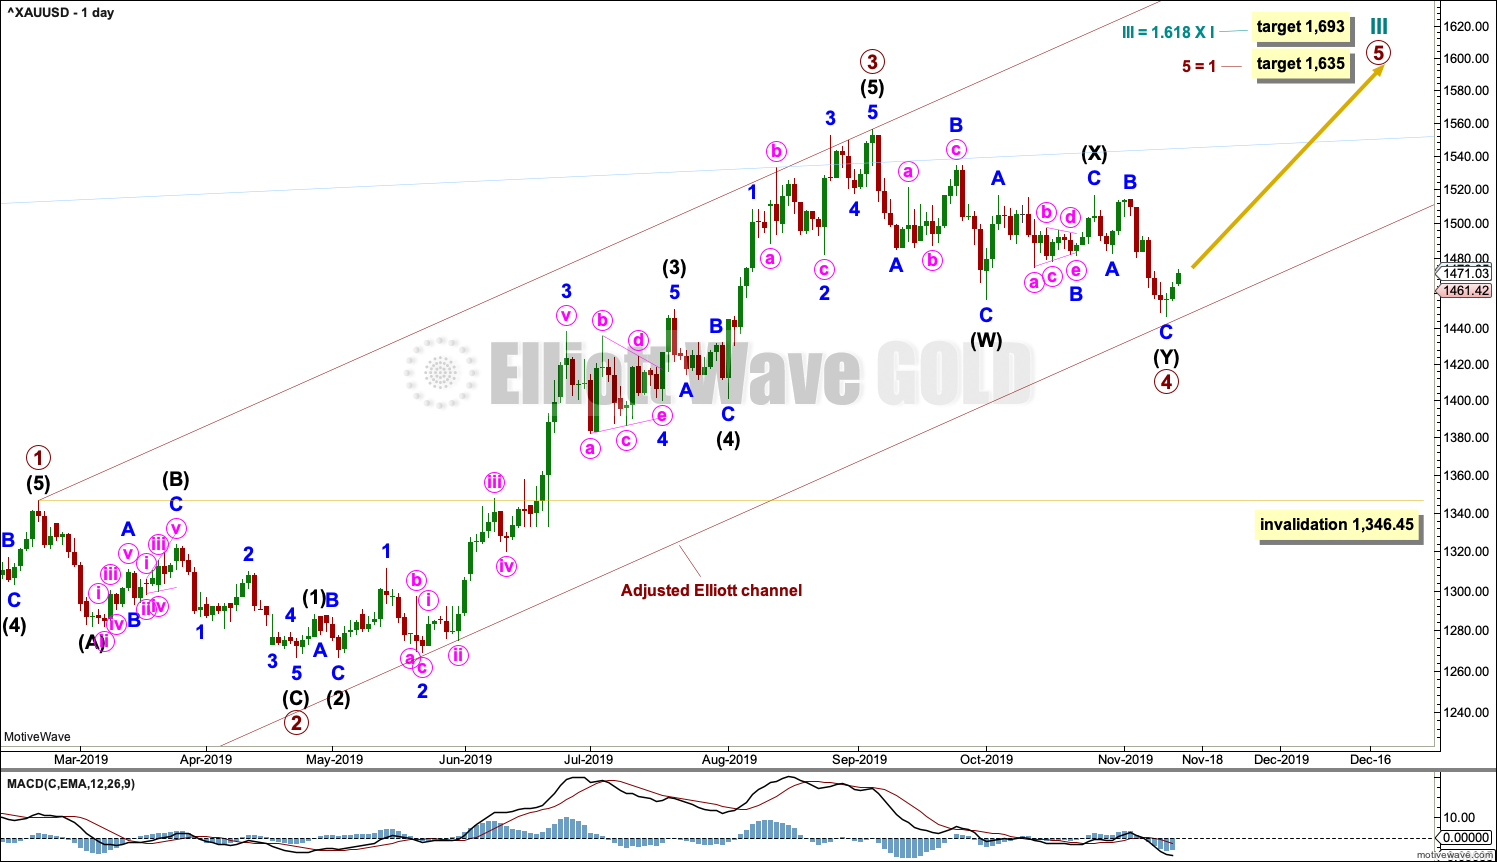
Primary wave 4 may be complete as a double zigzag. Primary wave 4 may have lasted 49 sessions, just six more than primary wave 2, which lasted 43 sessions. The proportion remains very good for this part of the wave count.
A target for cycle wave III is calculated also now at primary degree. If price reaches the first target and keeps rising, then the second higher target may be used.
If it continues any further, then primary wave 4 may not move into primary wave 1 price territory below 1,346.45.
HOURLY CHART
Click chart to enlarge.
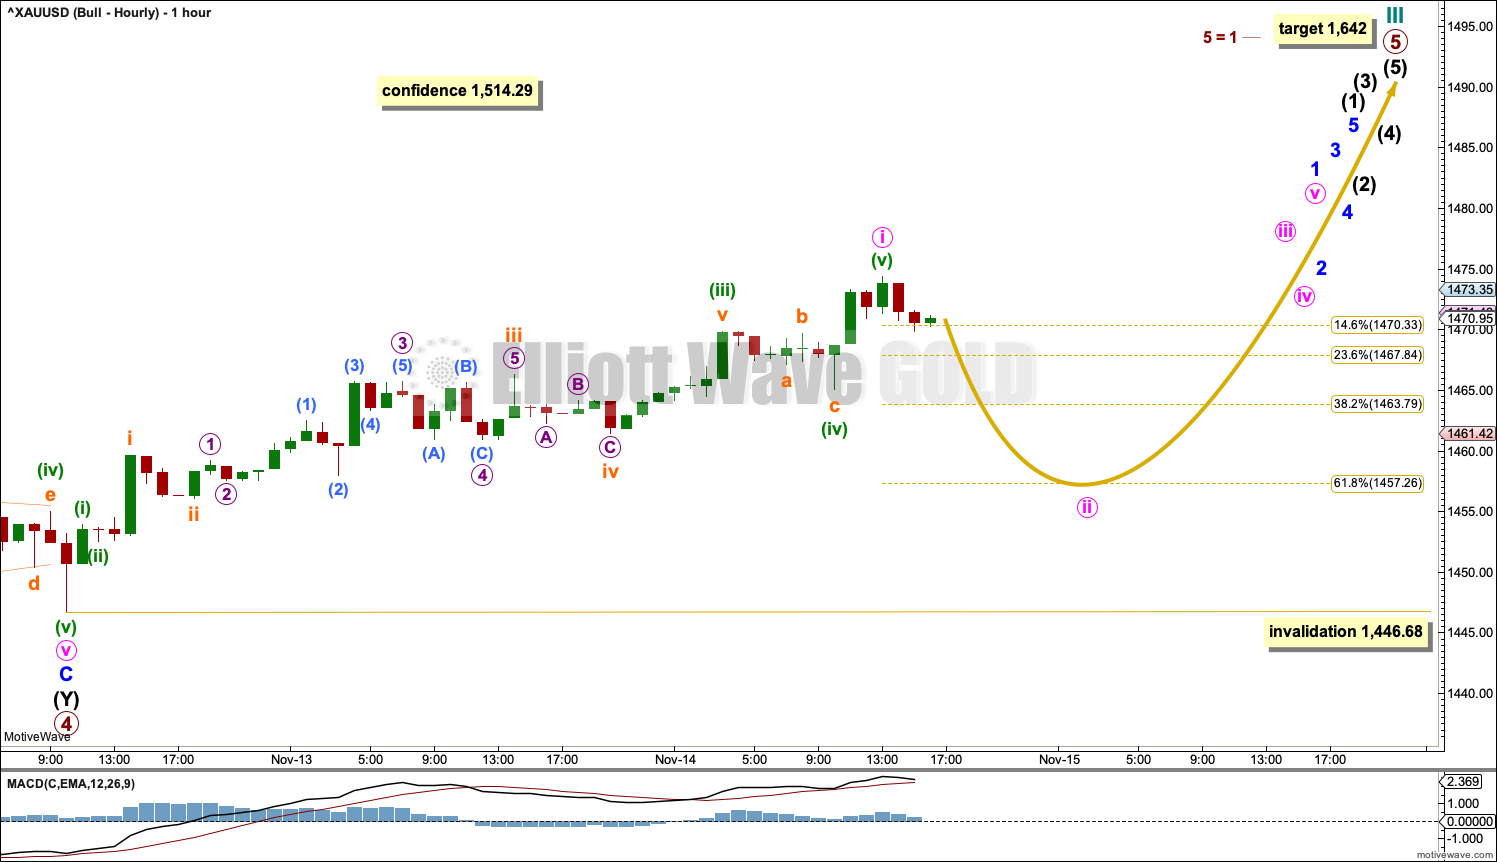
Primary wave 5 may have begun. A first wave may now be complete within primary wave 5, labelled minute wave i.
Minute wave ii may end about the 0.618 Fibonacci ratio of minute wave i. It may also be deeper than that; Gold typically exhibits very deep second wave corrections at the start of a new trend.
Minute wave ii may not move beyond the start of minute wave i below 1,446.68.
TECHNICAL ANALYSIS
MONTHLY CHART
Click chart to enlarge. Chart courtesy of StockCharts.com.
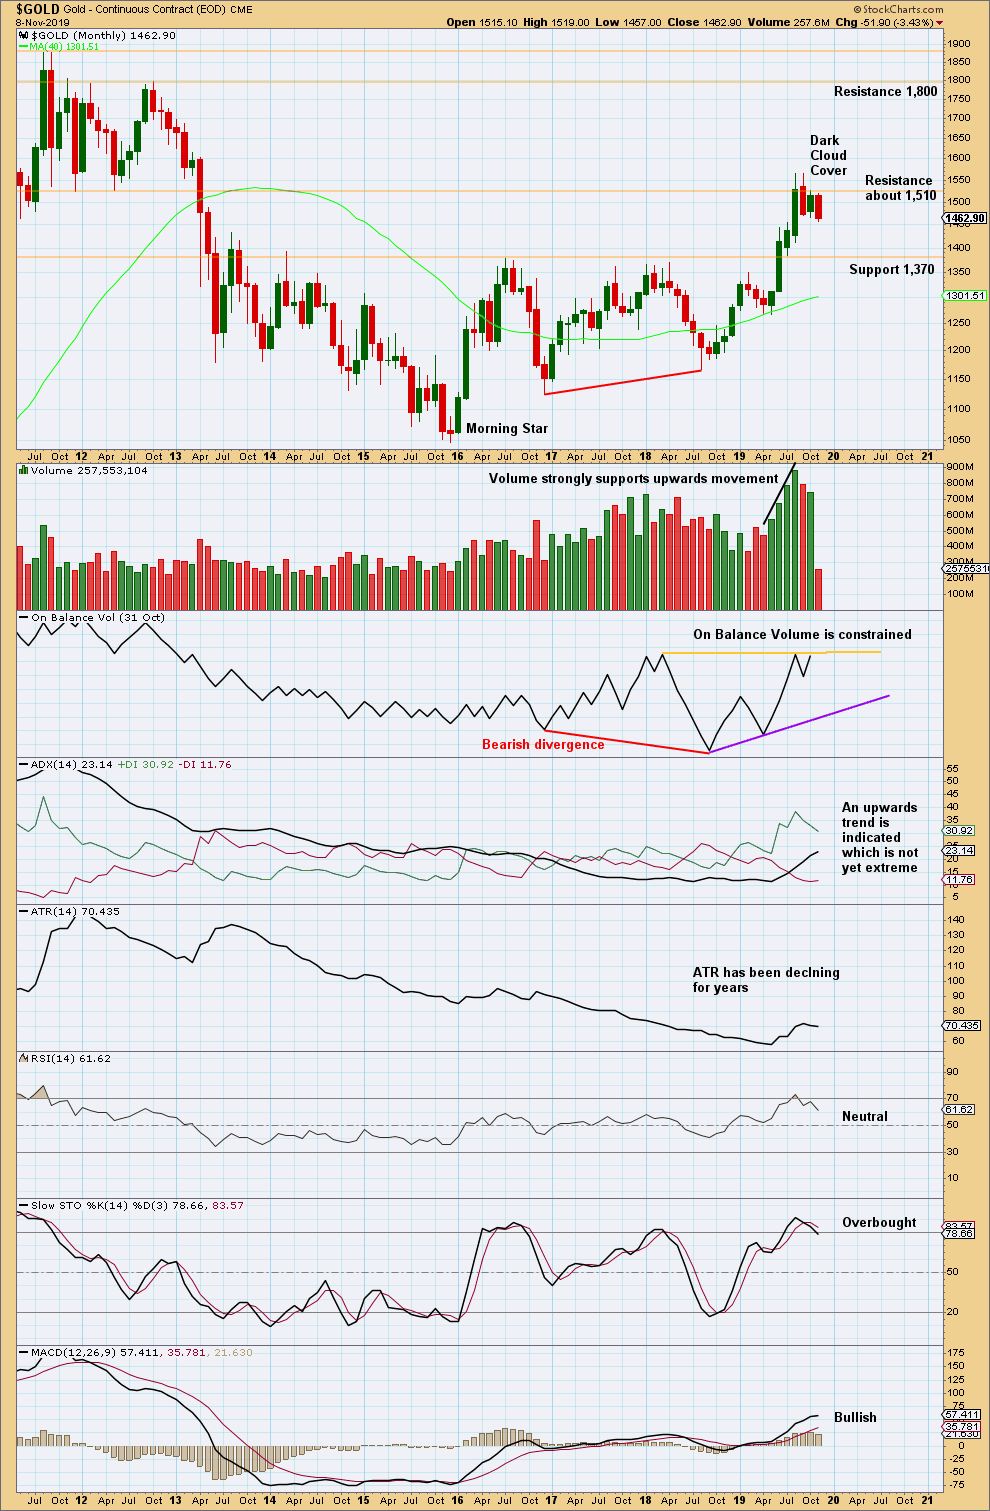
Overall, this chart is bullish. However, with RSI reaching overbought at the last high, upwards movement may be limited.
The last two months of sideways movement look like a consolidation within an ongoing upwards trend.
Some suspicion regarding the current upwards trend may be warranted by bearish divergence between price and On Balance Volume at the last lows. Also, at the last high price has made a substantial new high above April 2018, but On Balance Volume is flat.
WEEKLY CHART
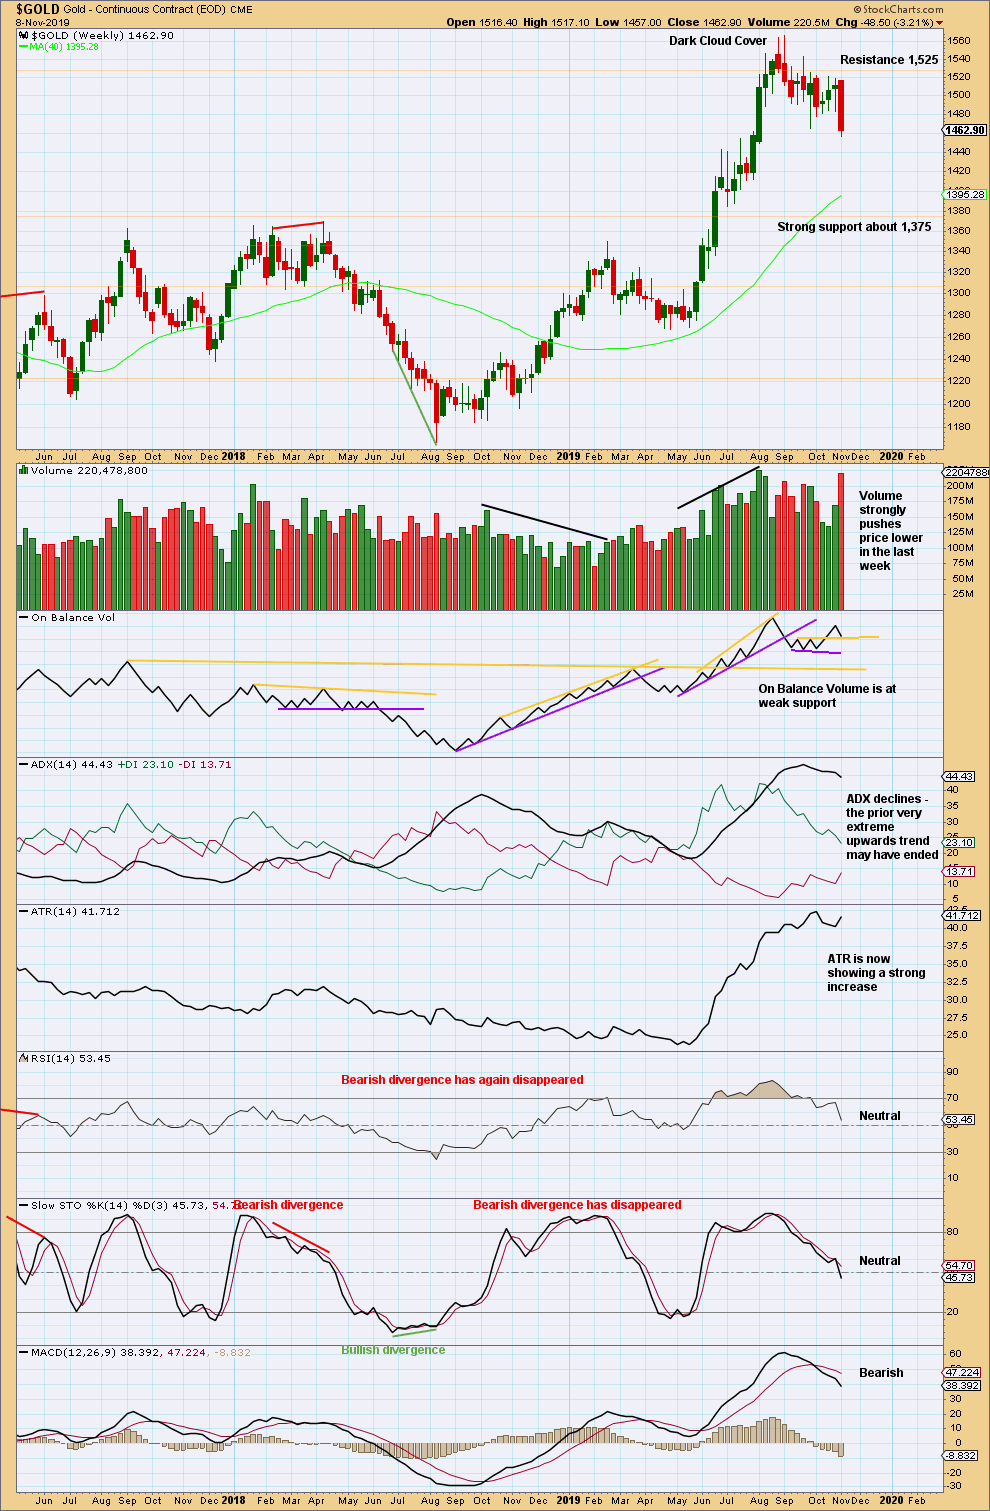
Click chart to enlarge. Chart courtesy of StockCharts.com.
When trends reach very extreme, candlestick reversal patterns should be given weight. The Dark Cloud Cover bearish reversal pattern is given more bearish weight from the long upper wick.
Last week is very strongly bearish and strongly supports the main Elliott wave count.
DAILY CHART
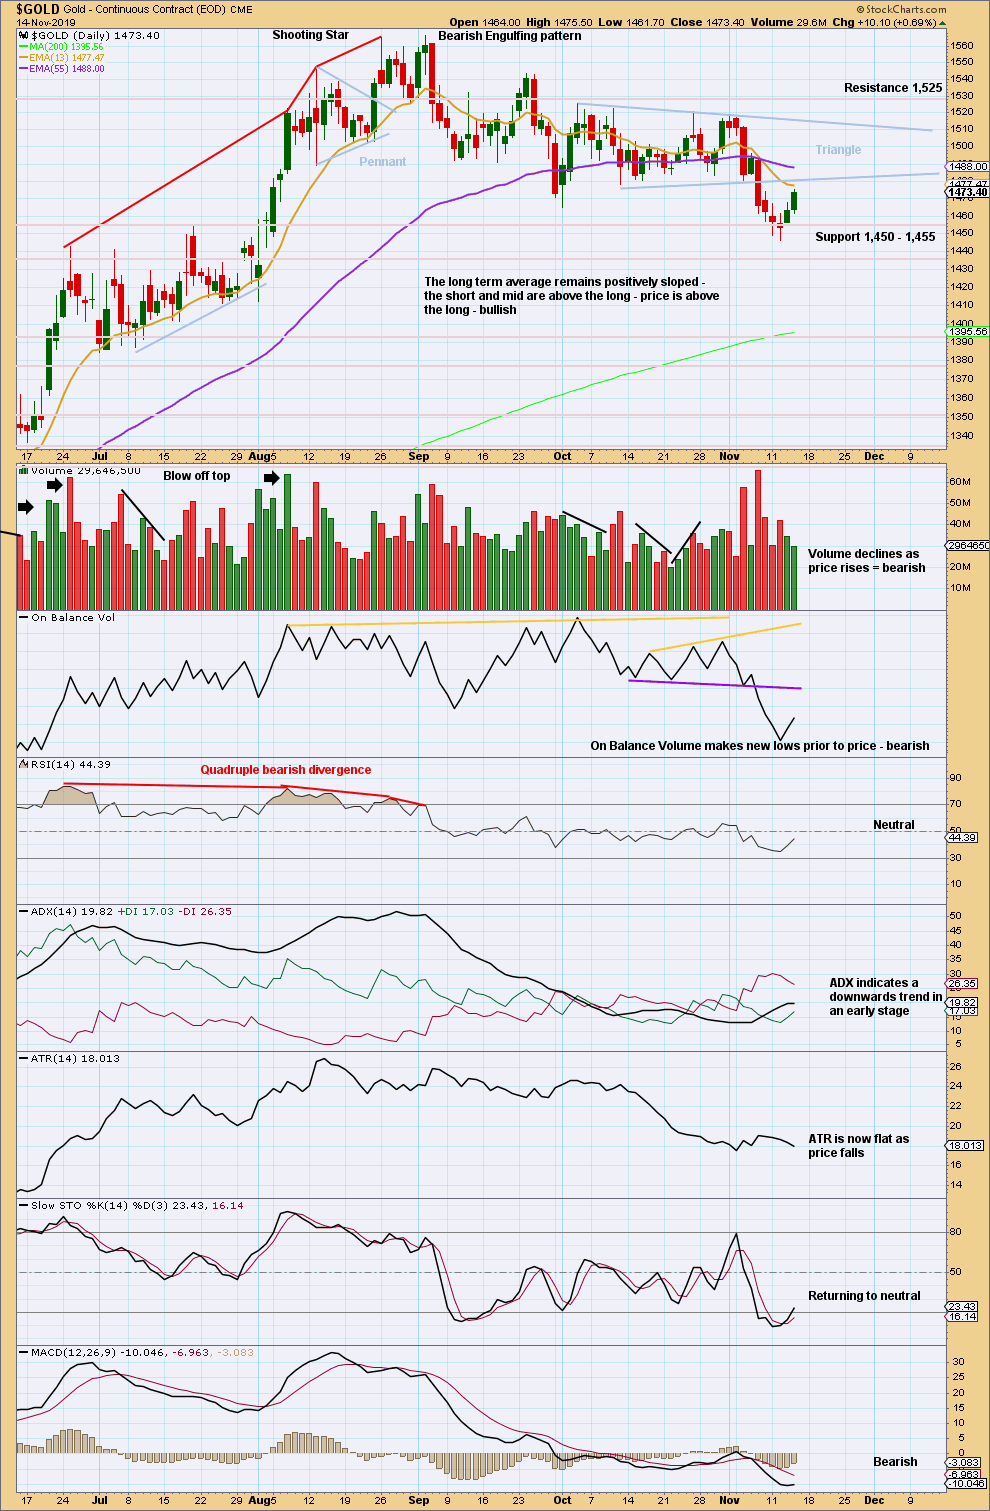
Click chart to enlarge. Chart courtesy of StockCharts.com.
Since the last high on the 4th of September, there is now a series of swing lows and swing highs.
After a breakout from the triangle, the target is to be about 1,431.
The downwards breakout from the triangle had strong support from volume pushing price lower, so confidence may be had in the breakout. This bounce of the last two sessions looks like a very typical back test of resistance at prior support of the lower triangle trend line. If the bounce continues a little higher, then it may reach the trend line about 1,480.
This bounce so far looks like a counter trend movement with declining volume. The only small concern today would be that this daily candlestick has a larger real body than yesterday’s; there is a very little strength here indicating it is possible the bounce is not quite complete.
GDX WEEKLY CHART
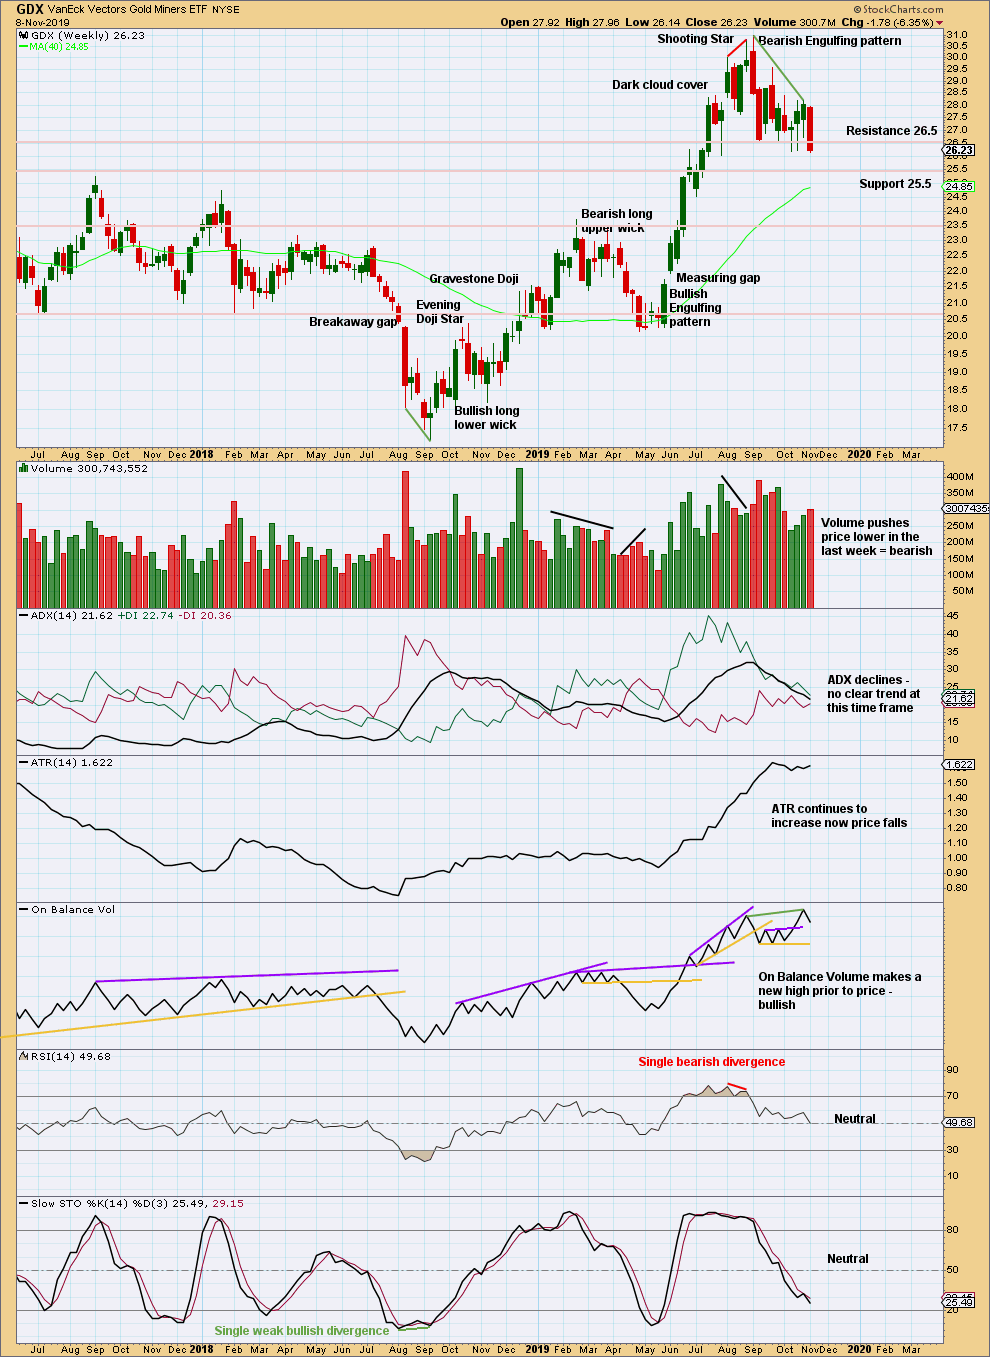
Click chart to enlarge. Chart courtesy of StockCharts.com.
Last weekly candlestick for GDX is very bearish and switches the short-term and mid-term picture to bearish.
GDX DAILY CHART
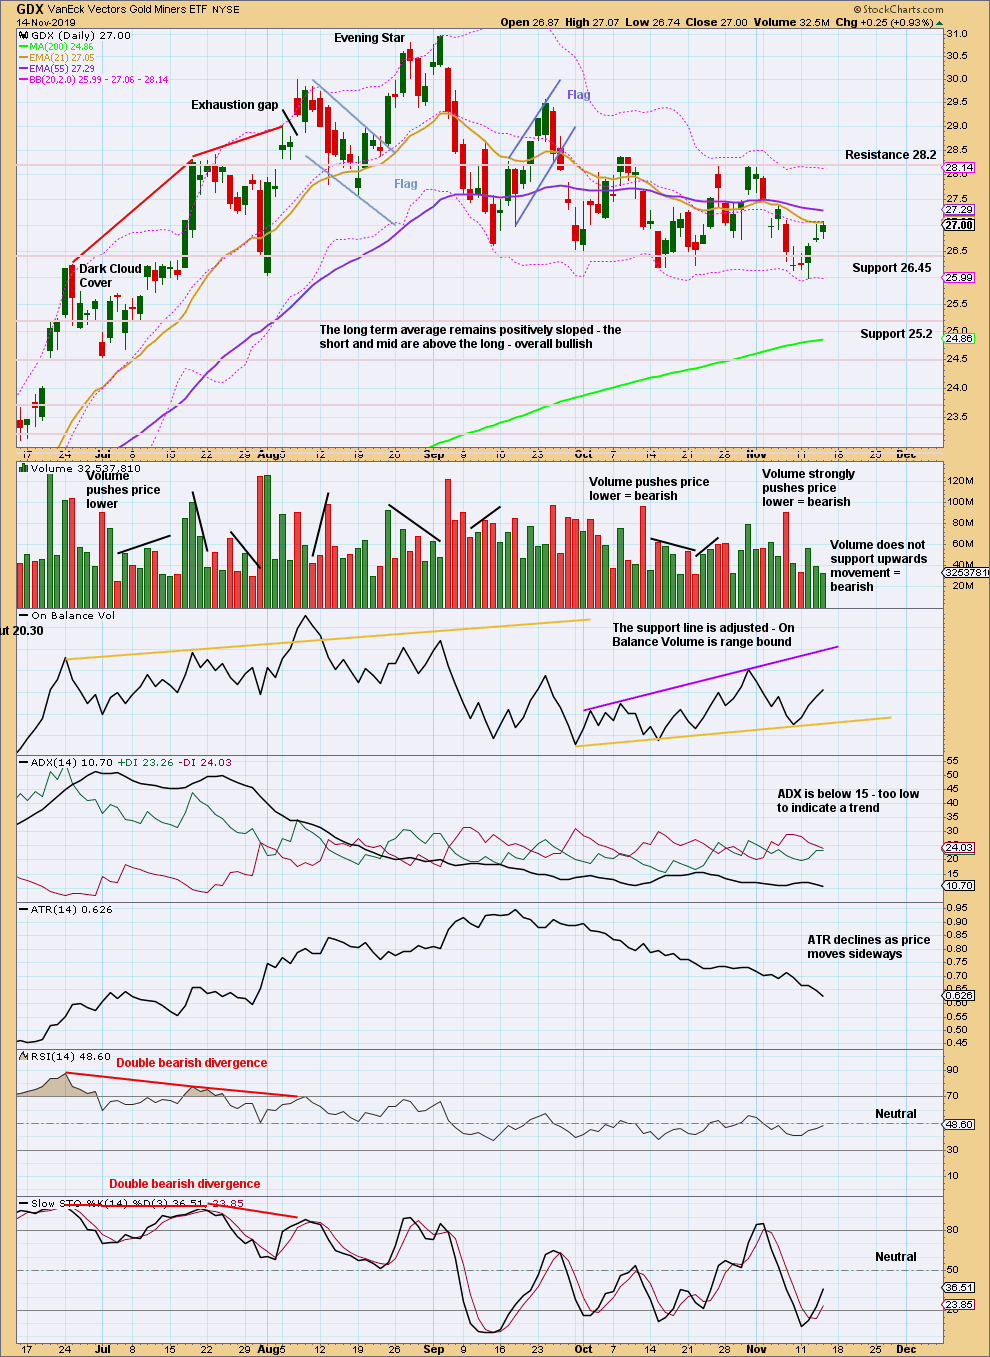
Click chart to enlarge. Chart courtesy of StockCharts.com.
GDX has made a new swing low. There is now a series of three lower highs and four lower lows from the high on the 4th of September. It still looks like GDX may have had a trend change. This view should remain dominant while the last swing high at 28.18 on the 31st of October remains intact.
A further decline in volume for another upwards day shows further weakness in this bounce. It may be over here or in just one more day.
Published @ 05:36 p.m. EST.
—
Careful risk management protects your trading account(s).
Follow my two Golden Rules:
1. Always trade with stops.
2. Risk only 1-5% of equity on any one trade.
—
New updates to this analysis are in bold.
Cot report shows that producers are decreasing short positions and increasing long positions. While investors are increasing short positions and decreasing Longs. Watch out for a possible bear trap. I’m staying long silver for now anyway.
You could be right – although we have (in my opinion) going lower in Gold and Silver short term
I think you are not alone, that appears to be the consensus too me!
Is it true that cot reports are often show early positioning?
hourly bear chart updated
Anyone else not getting email notifications off Lara?
Not sure I ever was – what notifications ?
I’m getting the after market daily emails, but it would be nice to get notifications when a comment or a reply to a comment is posted here in the forum section. Lara, is there such a notification service with this site, or do we have to check in every time to see if there are any replies to our comments?
I shall pass this message onto Cesar, he’s the webmaster about here.
Great, thanks Lara.
Oh, almost forgot to ask, Lara; When I was a $40/month member, there were more comments made on the weekly USOIL analysis postings. But as an $80/month member I don’t have access to them. I not interested in the weekly S&P analysis, but since USOIL weekly is bundled together with the GOLD and S&P analysis, members who post comment Re: USOIL only show up on the Weekly GOLD, S&P, USOIL, not the individual USOIL analysis. Is there a way that I could get access to the comment section on the Weekly analysis? Thanks. (I mainly follow USOIL for now. Still not comfortable enough with GOLD yet. )
When I publish an updated chart for Oil I will put it in both Lara’s Weekly and the US Oil (individual) post. So you shouldn’t be missing out on that.
This week, currently, there’s only 5 comments on Lara’s Weekly and none of them are about US Oil.
If you have any questions for me on Oil you may ask them here or on the Oil analysis, which I do try to check daily for comments.
Keith, do you mean notifications of analysis being published?
I know we have that set up and should be working, Cesar can look into that if it’s not working for you.
I mean the analyst Lara, not even getting that through my emails. Haven’t for about a week now.
Looks like that hourly channel broke, may be a nice few days for the bears