
A bounce was expected to continue on up towards a short-term target at 1,483. Price has continued higher reaching 1,475.05.
Summary: The bounce may now be over and the downwards trend may resume. The Elliott wave target is at 1,348.
A target calculated from the triangle is about 1,431.
For the very short term, a new swing high above 1,514.29 would add some confidence in a more bullish outlook. The target would then be at 1,567, 1,635 or 1,693.
For the bigger picture, the bearish Elliott wave count expects a new downwards trend to last one to several years has begun. The alternate bearish wave count looks at the possibility that one final high to 1,559 is required first.
The bullish Elliott wave count expects a primary degree fourth wave has completed and the upwards trend has resumed.
Grand SuperCycle analysis is here.
Monthly charts were last published here.
BEARISH ELLIOTT WAVE COUNT
WEEKLY CHART
Click chart to enlarge.
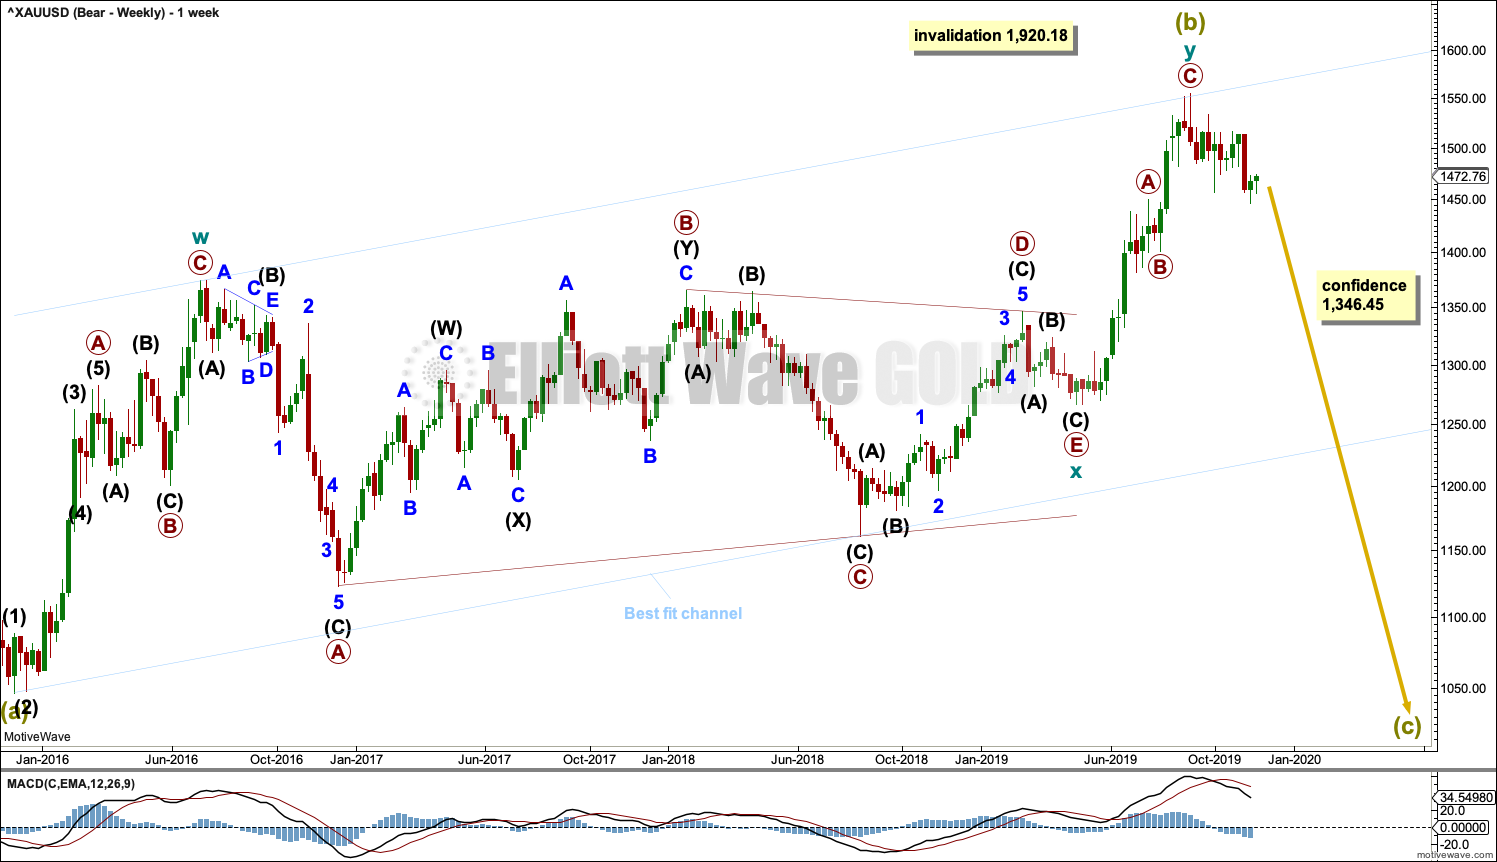
It is possible that Super Cycle wave (b) is nearly complete as a double zigzag.
The first zigzag in the double is labelled cycle wave w. The double is joined by a three in the opposite direction, a triangle labelled cycle wave x. The second zigzag in the double is labelled cycle wave y.
The purpose of the second zigzag in a double is to deepen the correction. Cycle wave y has achieved this purpose.
A new low below 1,346.45 would add strong confidence to this wave count. At that stage, the bullish Elliott wave count would be invalidated.
A wide best fit channel is added in light blue. This channel contains all of Super Cycle wave (b) and may provide resistance and support. Copy this channel over to daily charts.
Super Cycle wave (c) must subdivide as a five wave structure, most likely an impulse. It may last several years. It would be very likely to make new lows below the end of Super Cycle wave (a) at 1,046.27 to avoid a truncation.
DAILY CHART
Click chart to enlarge.
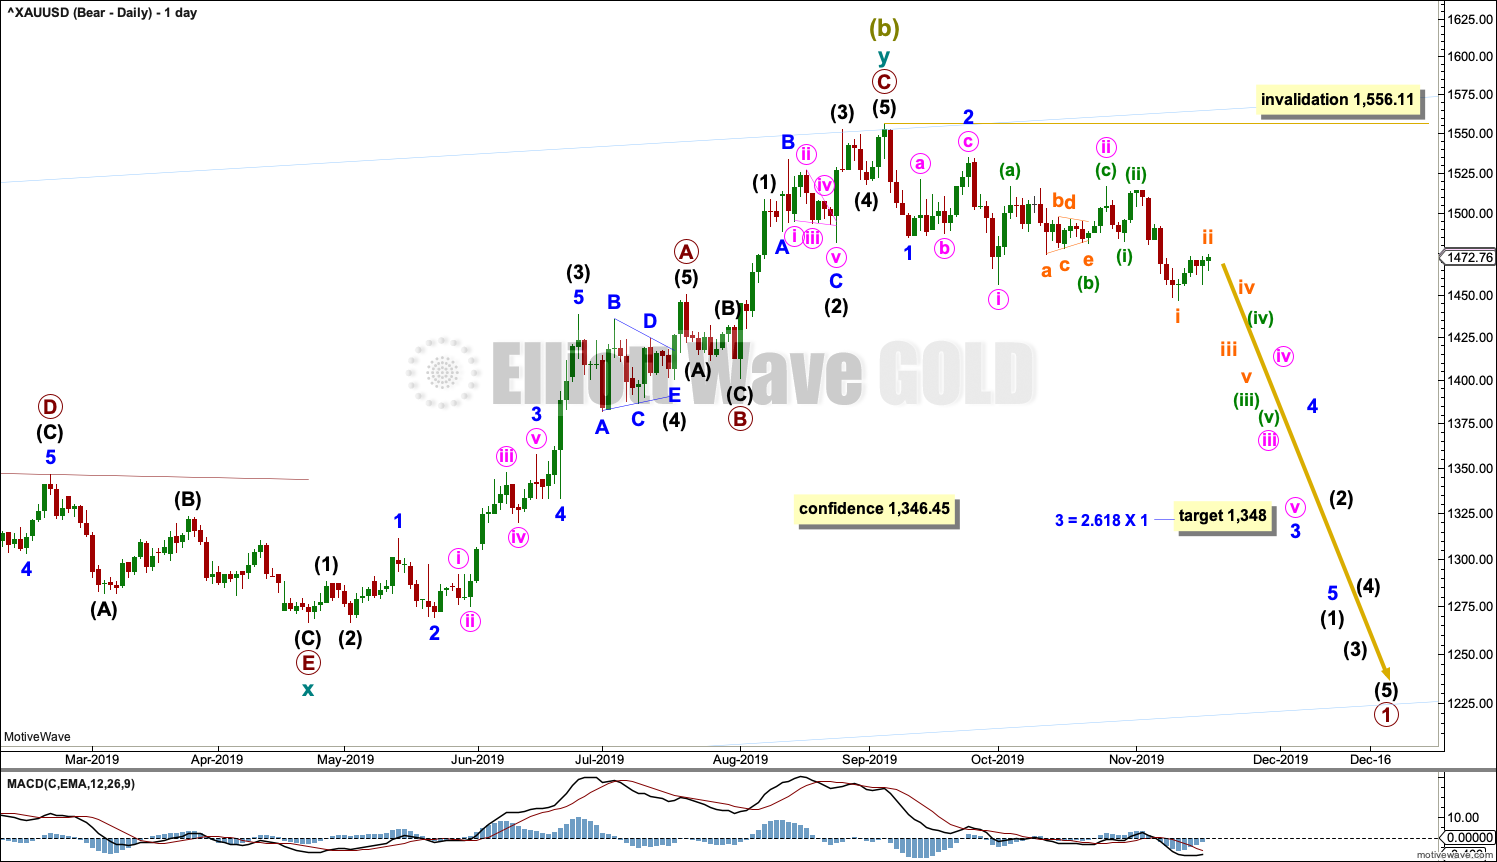
Classic analysis now reasonably supports this wave count.
Cycle wave y may be a complete zigzag. Within both of primary waves A and C, there is good proportion between intermediate waves (2) and (4). Within both of primary waves A and C, there is good alternation in structure of intermediate waves (2) and (4).
Within cycle wave y, there is no Fibonacci Ratio between primary waves A and C.
If there has been a trend change at Super Cycle degree, then a five down needs to develop on the daily and weekly charts. So far that is incomplete. It will be labelled intermediate wave (1).
HOURLY CHART
Click chart to enlarge.
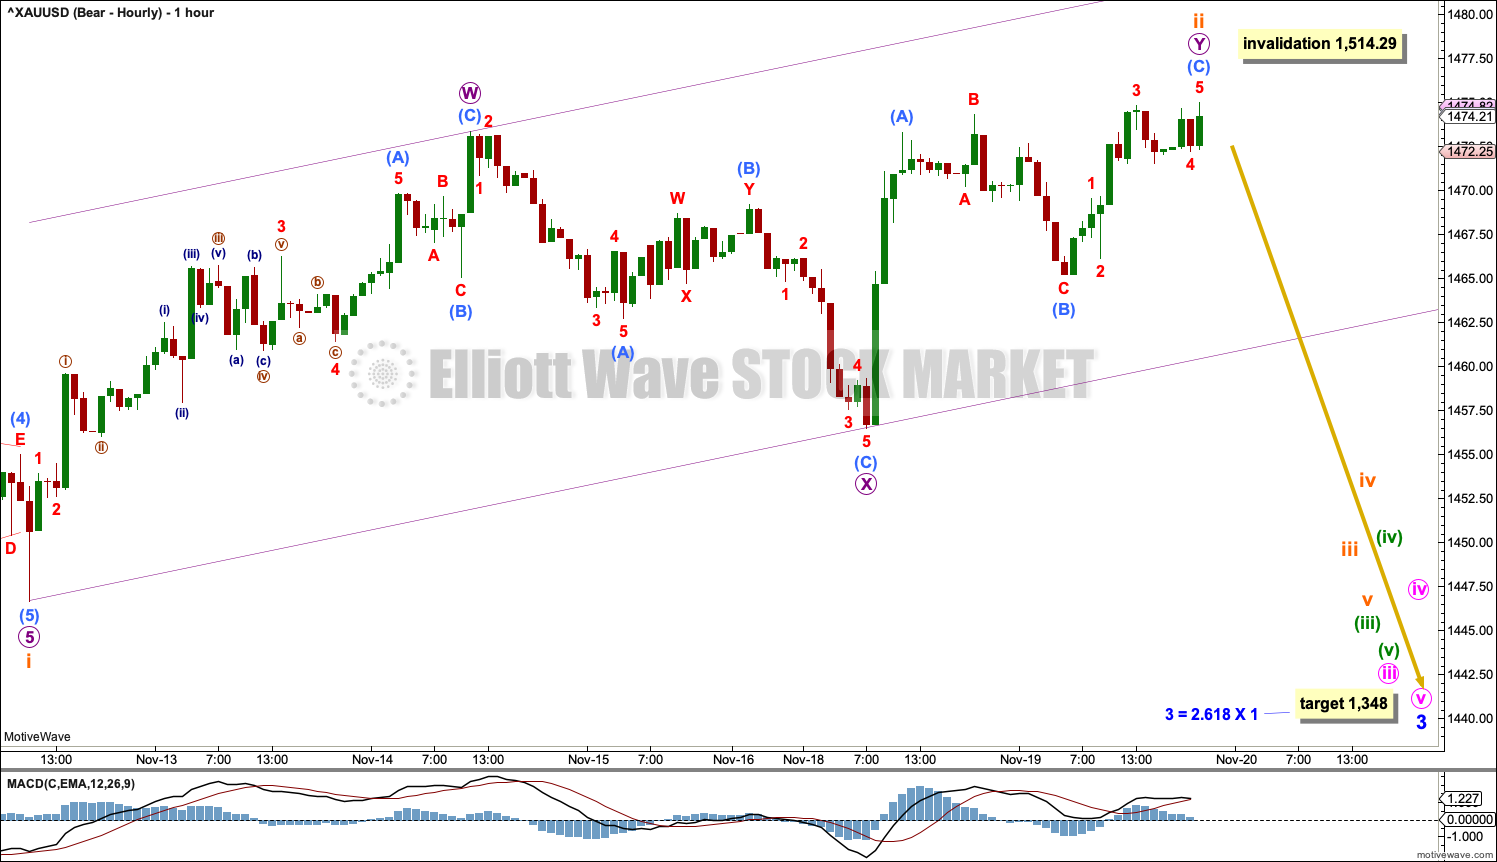
Subminuette wave ii may be complete as a double zigzag.
Draw a channel about subminuette wave ii. When this channel is breached by downwards movement, that may be taken as indication that subminuette wave ii should be over and subminuette wave iii should have begun. The next wave down may be a third wave at four degrees; it may exhibit a strong increase in downwards momentum.
If it continues higher, then subminuette wave ii may not move beyond the start of subminuette wave i above 1,514.29.
ALTERNATE DAILY CHART
Click chart to enlarge.
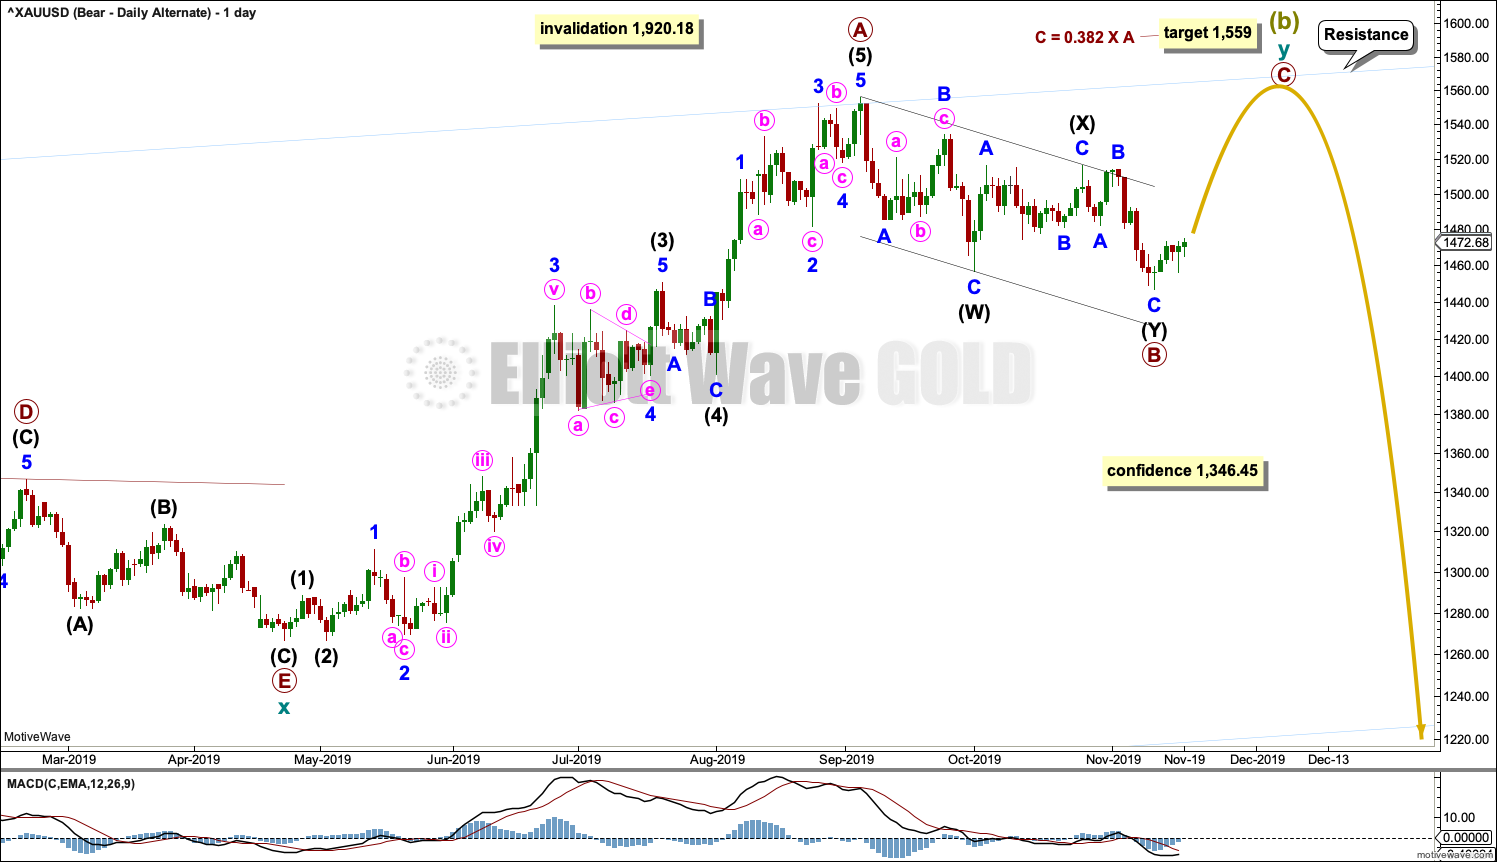
It is possible that the double zigzag for Super Cycle wave (b) may be incomplete and may yet require one more high.
Within cycle wave y, primary wave A may have been over at the last high. Primary wave B may now be complete as a double zigzag. Primary wave B may not move beyond the start of primary wave A below 1,266.61.
Primary wave C would be expected to find strong resistance and end at the upper edge of the blue best fit channel copied over from the weekly chart.
BULLISH ELLIOTT WAVE COUNT
WEEKLY CHART
Click chart to enlarge.
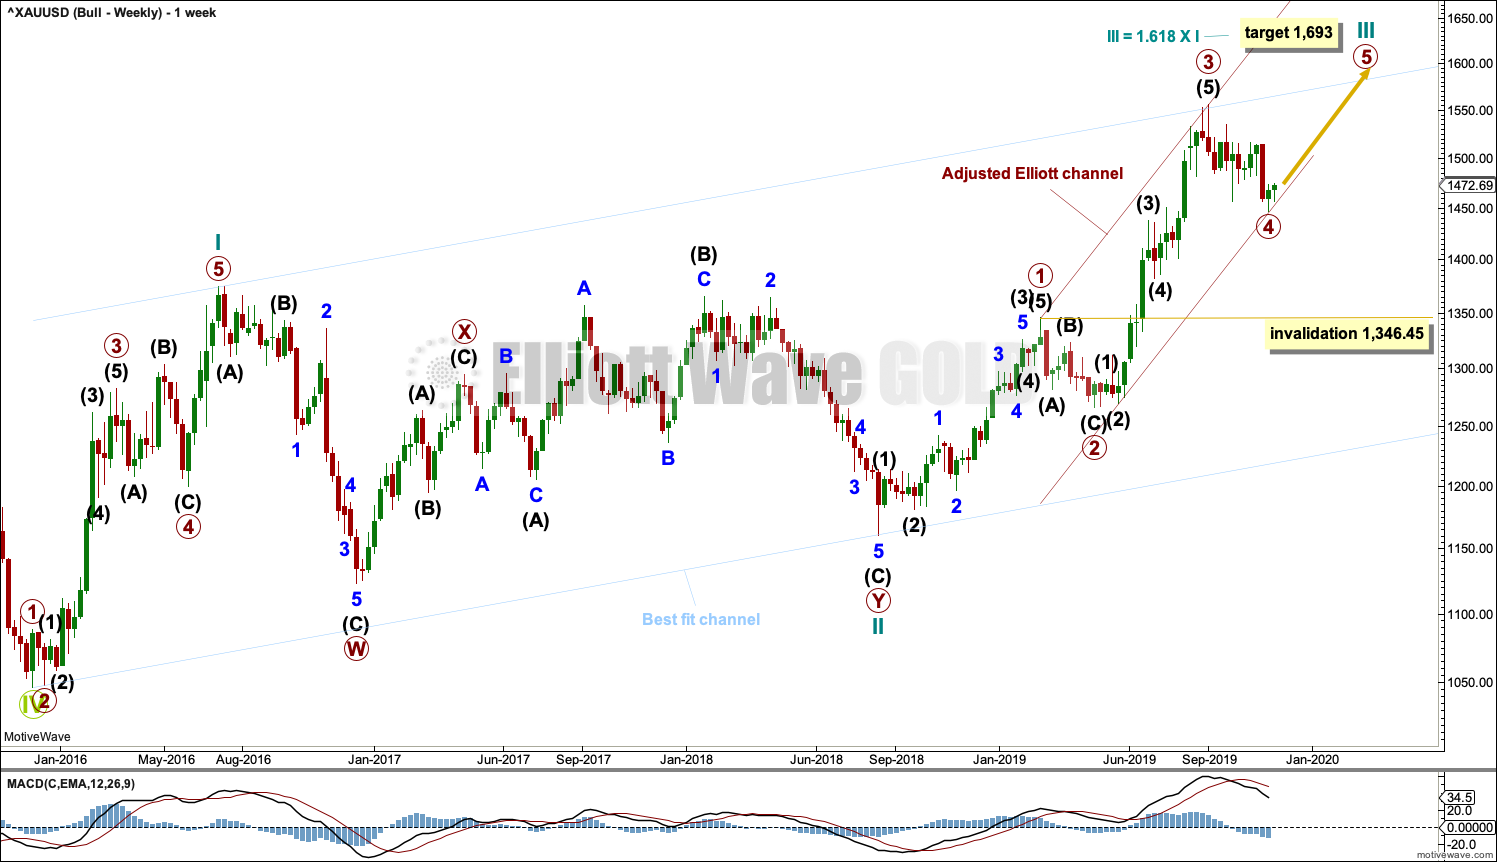
This wave count sees the the bear market complete at the last major low for Gold in November 2015.
If Gold is in a new bull market, then it should begin with a five wave structure upwards on the weekly chart. However, the biggest problem with this wave count is the structure labelled cycle wave I because this wave count must see it as a five wave structure, but it looks more like a three wave structure.
Commodities often exhibit swift strong fifth waves that force the fourth wave corrections coming just prior and just after to be more brief and shallow than their counterpart second waves. It is unusual for a commodity to exhibit a quick second wave and a more time consuming fourth wave, and this is how cycle wave I is labelled. This wave count still suffers from this very substantial problem, and for this reason the bearish wave count is still considered because it has a better fit in terms of Elliott wave structure.
Cycle wave II subdivides well as a double combination: zigzag – X – expanded flat.
Cycle wave III may have begun. Within cycle wave III, primary waves 1 and 2 may now be complete. Primary wave 3 has now moved above the end of primary wave 1 meeting a core Elliott wave rule. It has now moved far enough to allow room for primary wave 4 to unfold and remain above primary wave 1 price territory. Primary wave 4 may not move into primary wave 1 price territory below 1,346.45.
Cycle wave III so far for this wave count would have been underway now for 66 weeks. It exhibits some support from volume and increasing ATR. This wave count has some support from classic technical analysis.
The channel drawn about cycle wave III is an adjusted Elliott channel. The lower edge is pulled lower.
Add the wide best fit channel to weekly and daily charts.
DAILY CHART
Click chart to enlarge.
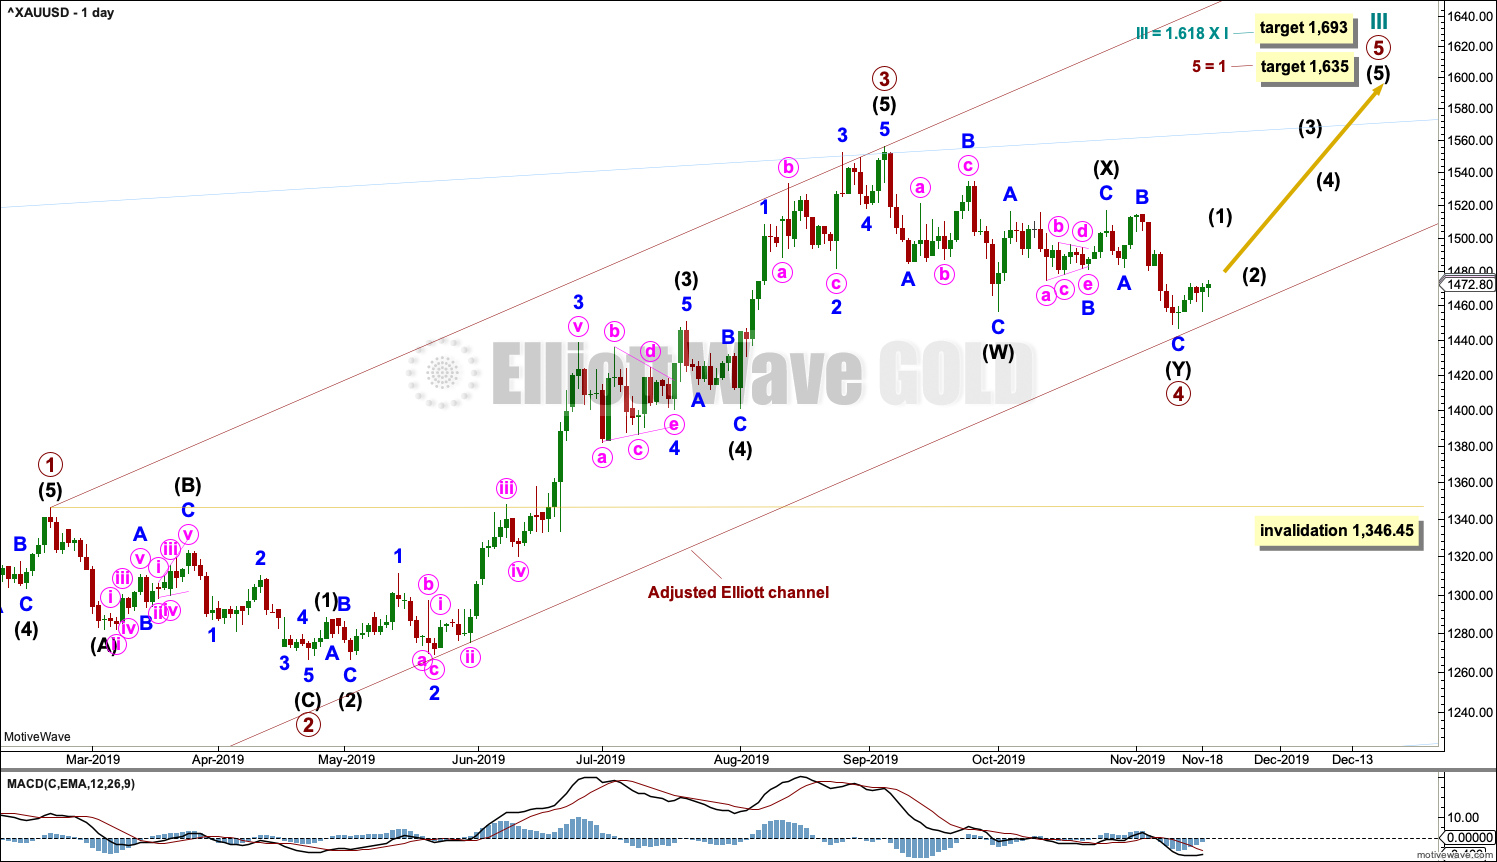
Primary wave 4 may be complete as a double zigzag. Primary wave 4 may have lasted 49 sessions, just six more than primary wave 2, which lasted 43 sessions. The proportion remains very good for this part of the wave count.
A target for cycle wave III is calculated also now at primary degree. If price reaches the first target and keeps rising, then the second higher target may be used.
If it continues any further, then primary wave 4 may not move into primary wave 1 price territory below 1,346.45.
HOURLY CHART
Click chart to enlarge.
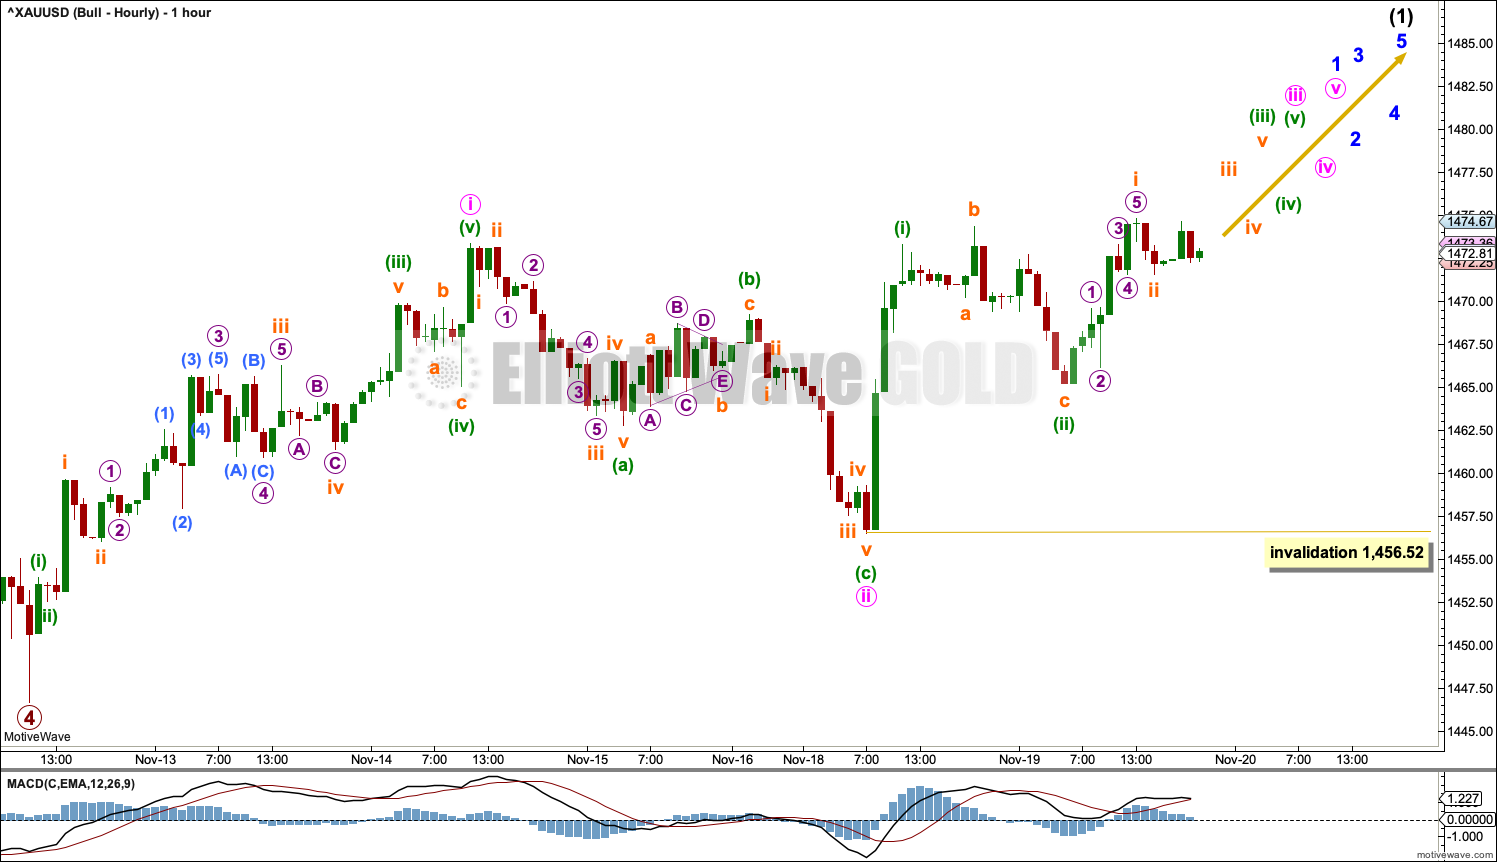
Primary wave 5 may have begun. A first wave may now be complete within primary wave 5, labelled minute wave i.
Minute wave ii may now be complete as a zigzag.
Within minute wave iii, minuette wave (ii) may not move beyond the start of minuette wave (i) below 1,456.52.
This bullish wave count now expects there may be three overlapping first and second waves complete. An increase in upwards momentum would be expected.
TECHNICAL ANALYSIS
MONTHLY CHART
Click chart to enlarge. Chart courtesy of StockCharts.com.
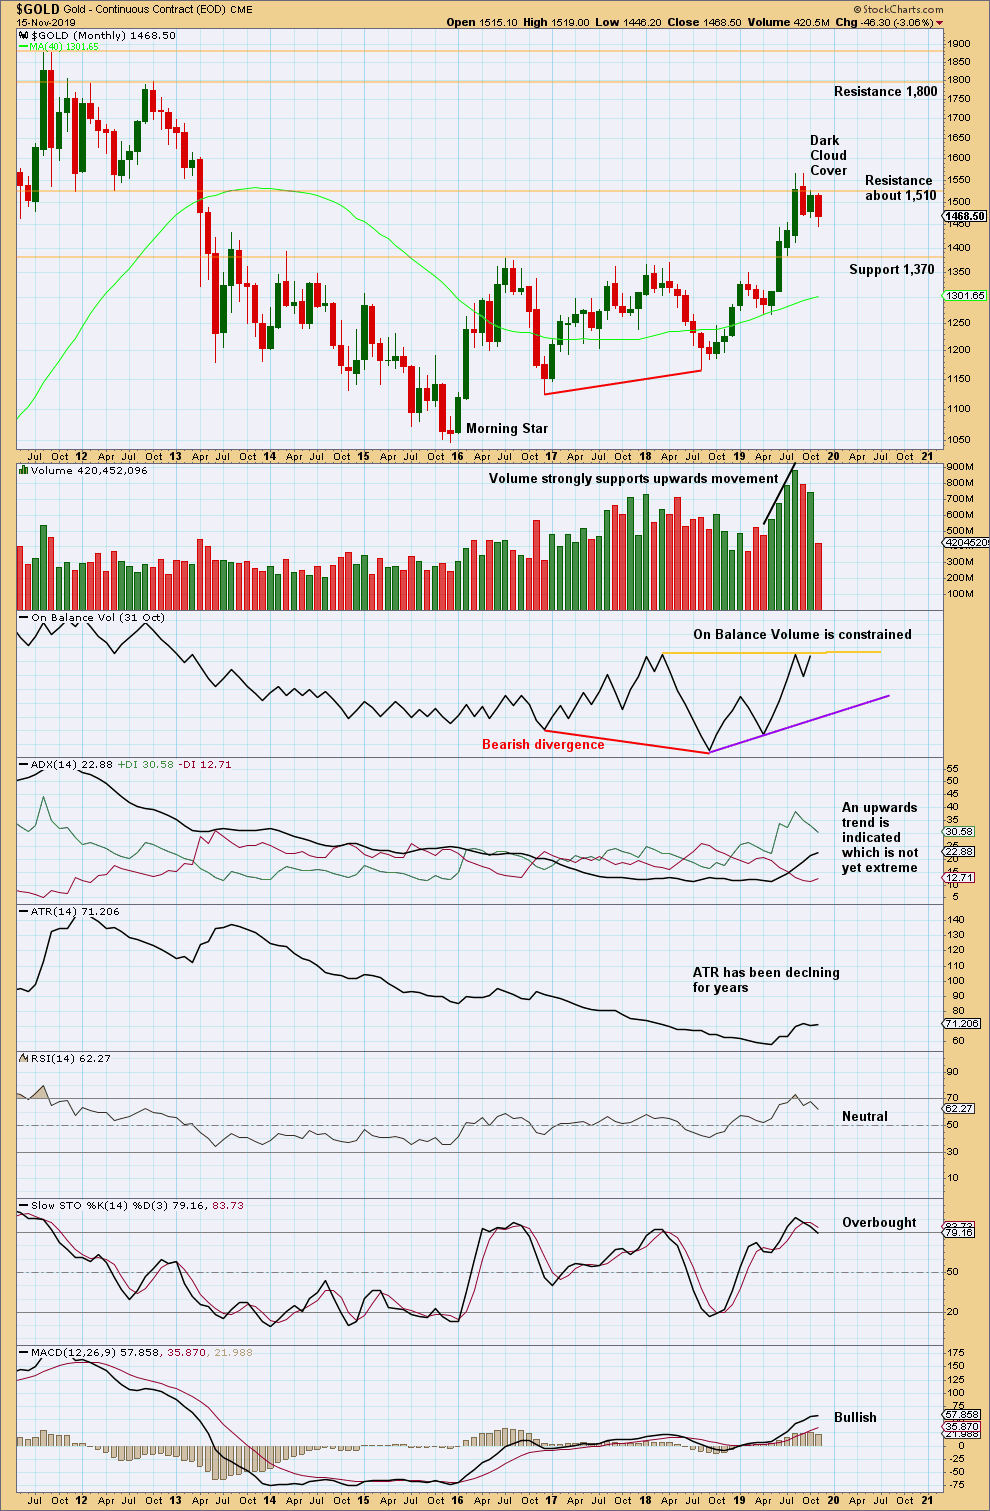
Overall, this chart is bullish. However, with RSI reaching overbought at the last high, upwards movement may be limited.
The last two months of sideways movement look like a consolidation within an ongoing upwards trend.
Some suspicion regarding the current upwards trend may be warranted by bearish divergence between price and On Balance Volume at the last lows. Also, at the last high price has made a substantial new high above April 2018, but On Balance Volume is flat.
WEEKLY CHART
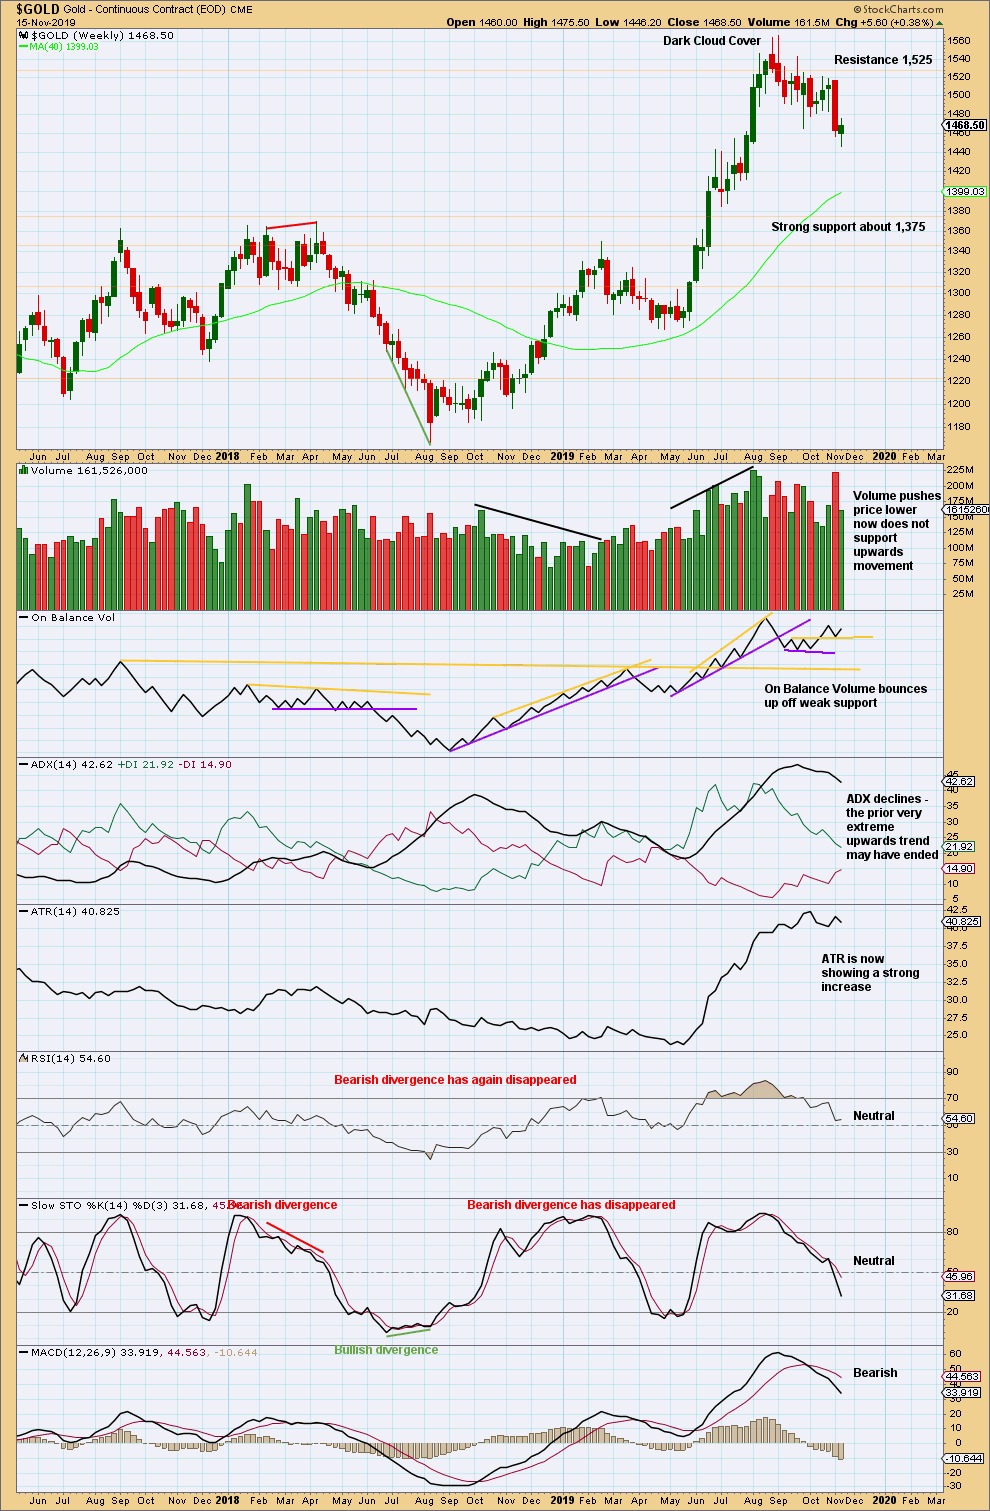
Click chart to enlarge. Chart courtesy of StockCharts.com.
When trends reach very extreme, candlestick reversal patterns should be given weight. The Dark Cloud Cover bearish reversal pattern is given more bearish weight from the long upper wick.
A very strong downwards week with strong support from volume three weeks ago supports a bearish view. Now a small range downwards week closes green with the balance of volume upwards. Upwards movement last week does not have support from volume and lacks range; this looks like a small pause within a developing downwards trend.
DAILY CHART
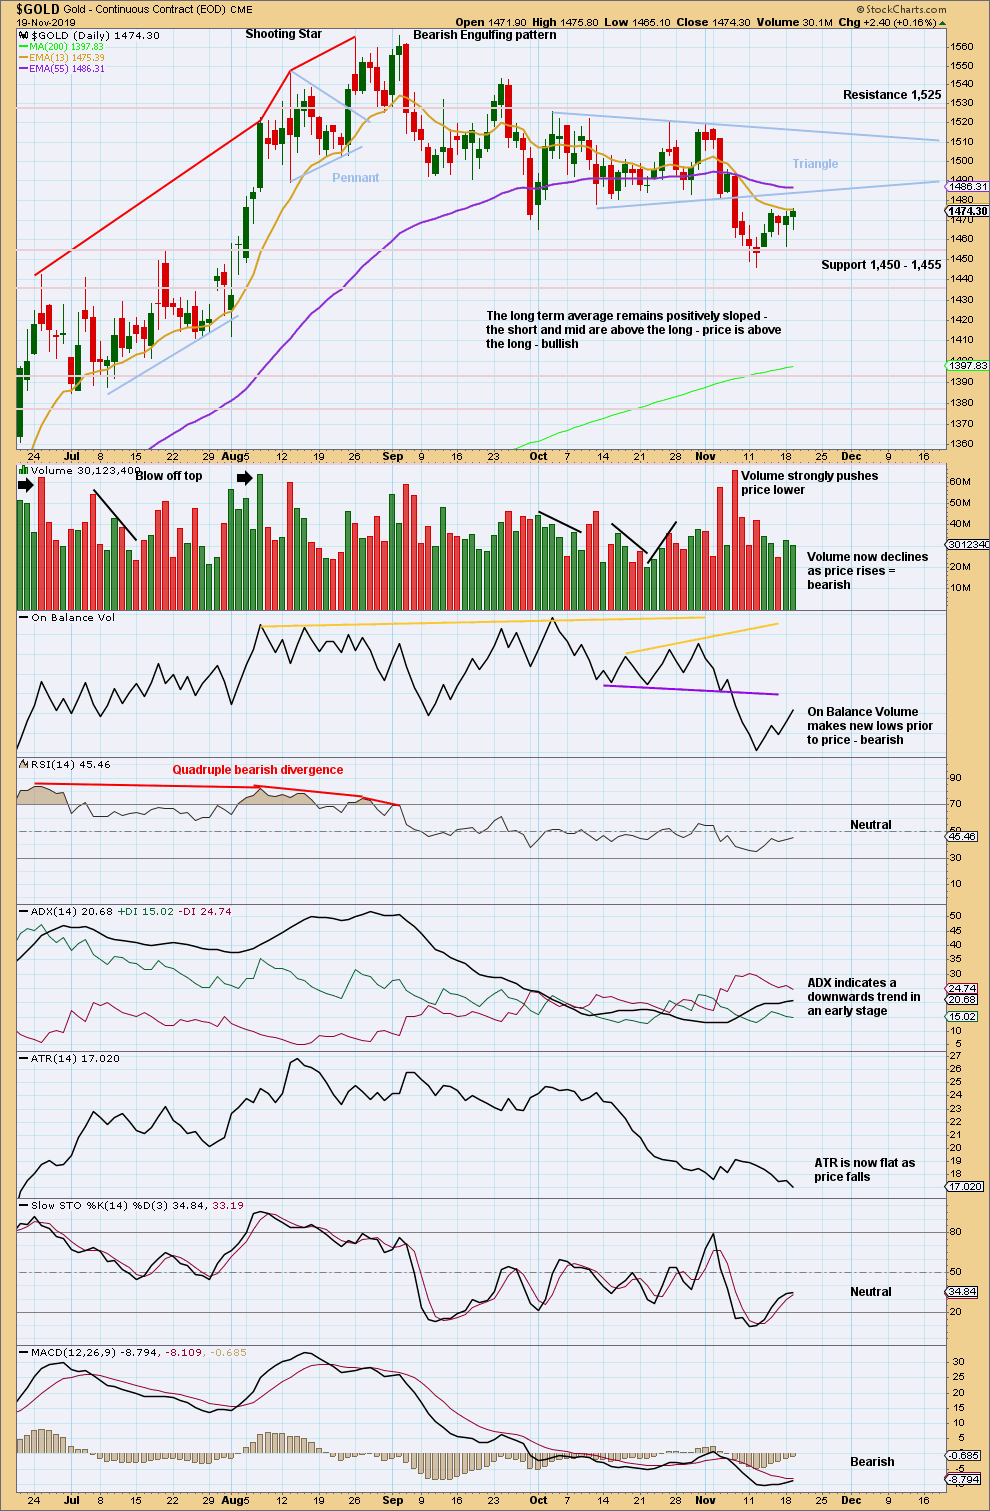
Click chart to enlarge. Chart courtesy of StockCharts.com.
Since the last high on the 4th of September, there is now a series of swing lows and swing highs.
After a breakout from the triangle, the target is to be about 1,431.
The downwards breakout from the triangle had strong support from volume pushing price lower, so confidence may be had in the breakout. This bounce of the last few sessions looks like a very typical back test of resistance at prior support of the lower triangle trend line. If the bounce continues a little higher, then it may reach the trend line about 1,485.
This bounce so far looks like a counter trend movement. Today a decline in volume and range suggest upwards movement is weakening, but the long lower wick suggests it may not be quite over.
GDX WEEKLY CHART
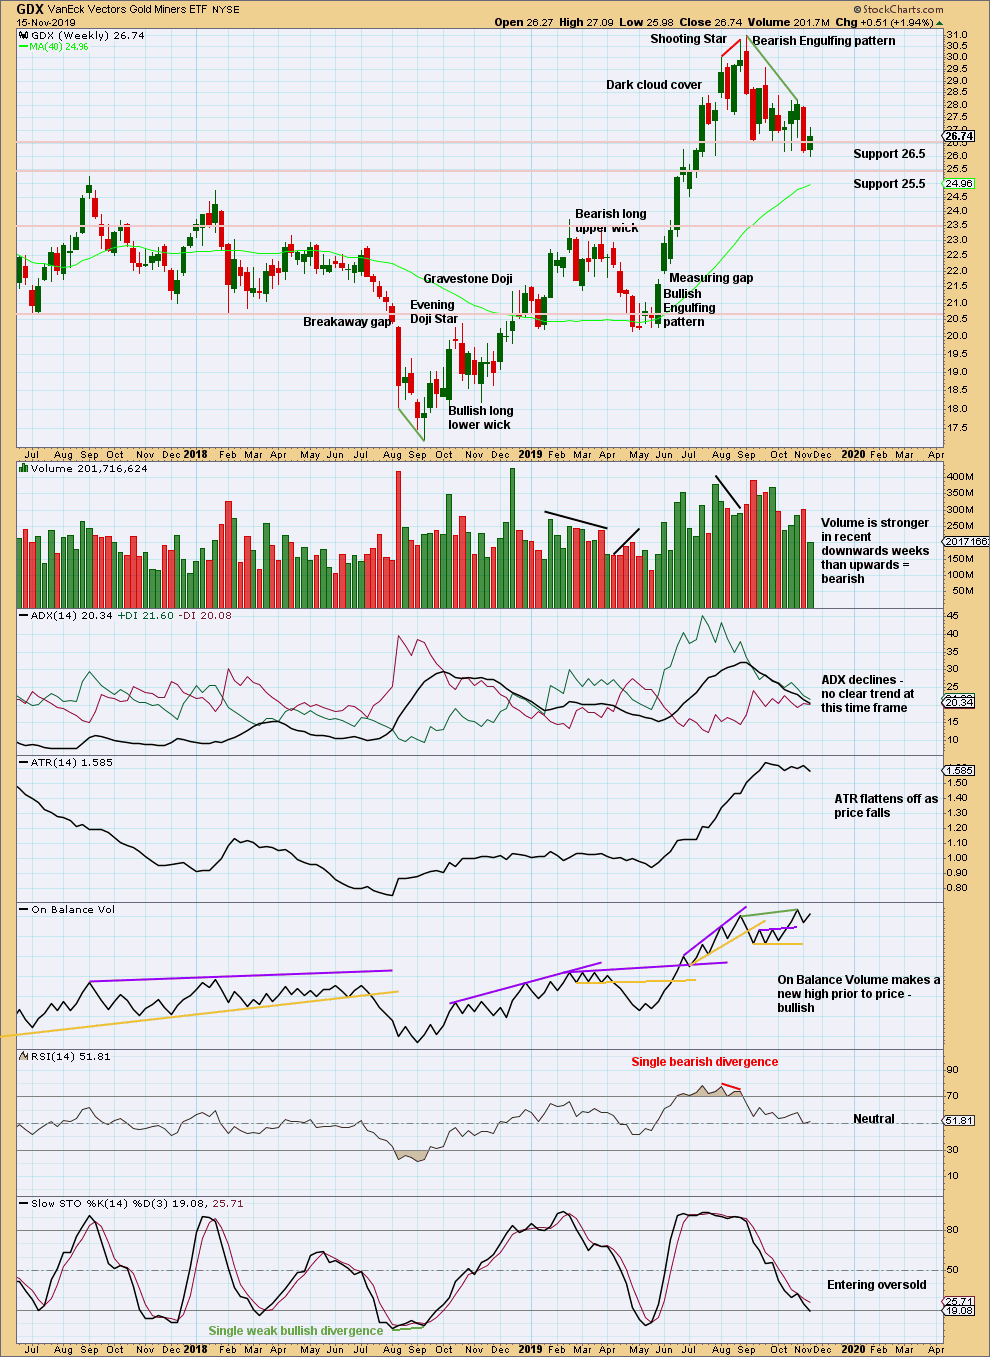
Click chart to enlarge. Chart courtesy of StockCharts.com.
GDX, like Gold, often begins a new trend slowly with overlapping and flat or declining ATR. From the last major high at 30.96 a few weeks ago, there has been a strong Bearish Engulfing pattern and strong downwards weeks with greater range and volume than upwards weeks. GDX may have had a trend change.
GDX DAILY CHART
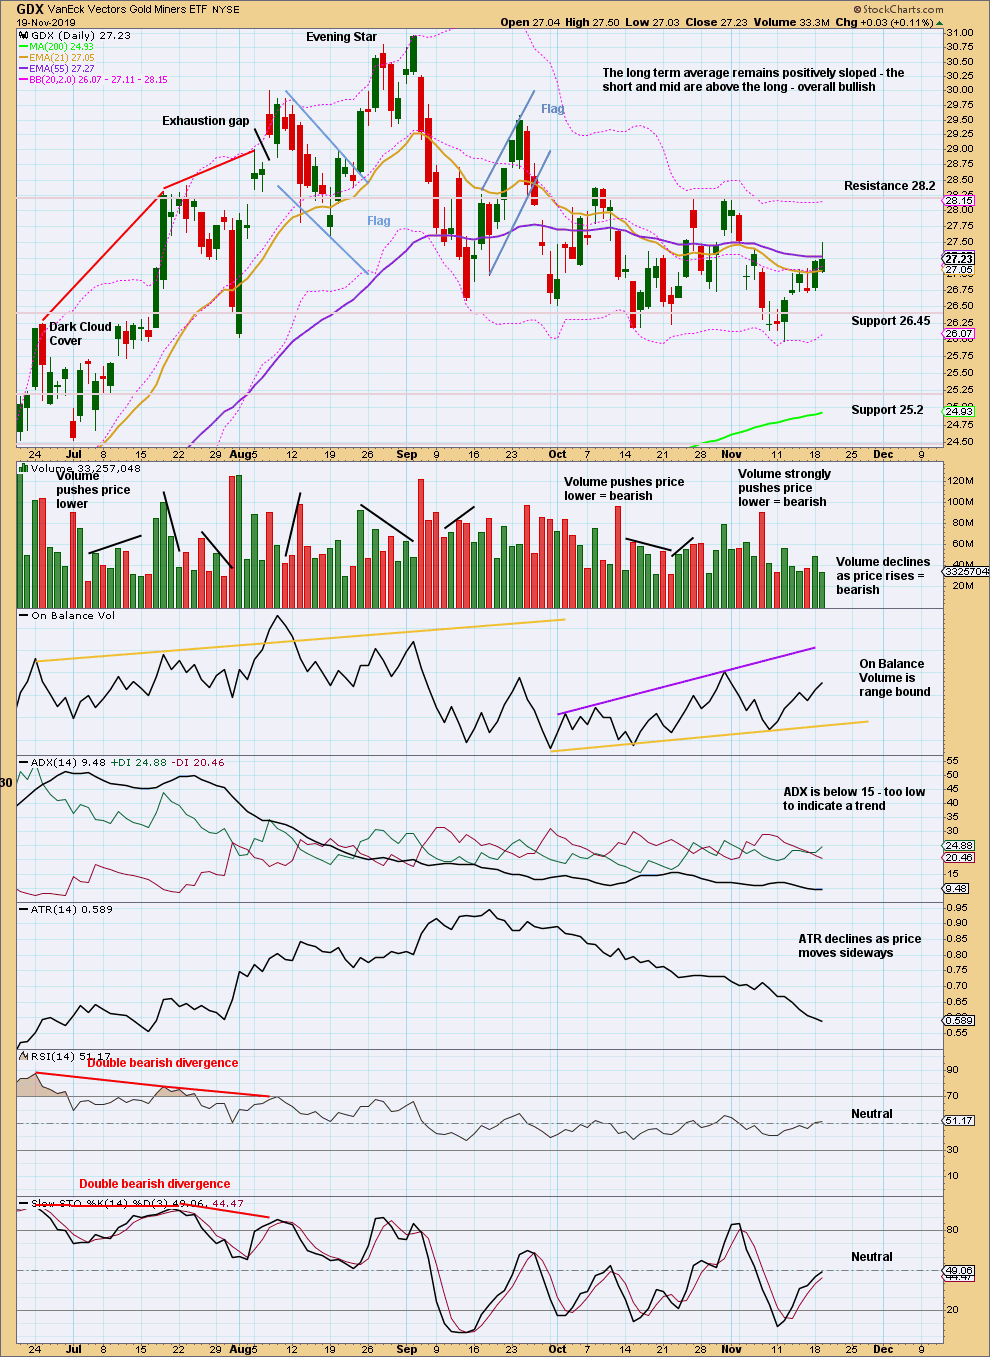
Click chart to enlarge. Chart courtesy of StockCharts.com.
GDX has made a new swing low. There is now a series of three lower highs and four lower lows from the high on the 4th of September. It still looks like GDX may have had a trend change. This view should remain dominant while the last swing high at 28.18 on the 31st of October remains intact.
A decline in volume and a long upper wick today suggest the bounce may be over.
Published @ 09:34 p.m. EST.
—
Careful risk management protects your trading account(s).
Follow my two Golden Rules:
1. Always trade with stops.
2. Risk only 1-5% of equity on any one trade.
—
New updates to this analysis are in bold.
Interesting day with the markets spiking down finally. Still think gold will surprise to the upside.
I’m of that opinion too.
The long upper wick on this last hourly candlestick is extremely bearish for this time frame.
Could be in bull territory here.
Hi Lara
I’m still not getting emails of the analysis off you. I’ve also sent you a message on the website.
Kind Regards
Keith
Hey Keith, check your Junk emails box perhaps. For some reason my EWG emails are lately coming there instead of my regular Inbox.
I’m sorry that’s still not working Keith. I have passed the message onto Cesar.
We are travelling this week and not at home, so that may be why it’s been missed. I promise it shall be addressed today.