
The downwards trend was expected to resume this week, which is exactly what is happening.
Summary: The downwards trend may resume. The Elliott wave target is at 1,348.
A target calculated from the triangle is about 1,431.
For the very short term, a new swing high above 1,514.29 would add some confidence in a more bullish outlook. The target would then be at 1,567, 1,635 or 1,693.
For the bigger picture, the bearish Elliott wave count expects a new downwards trend to last one to several years has begun. The alternate bearish wave count looks at the possibility that one final high to 1,559 is required first.
The bullish Elliott wave count expects a primary degree fourth wave has completed and the upwards trend has resumed.
Grand SuperCycle analysis is here.
Monthly charts were last published here.
BEARISH ELLIOTT WAVE COUNT
WEEKLY CHART
Click chart to enlarge.
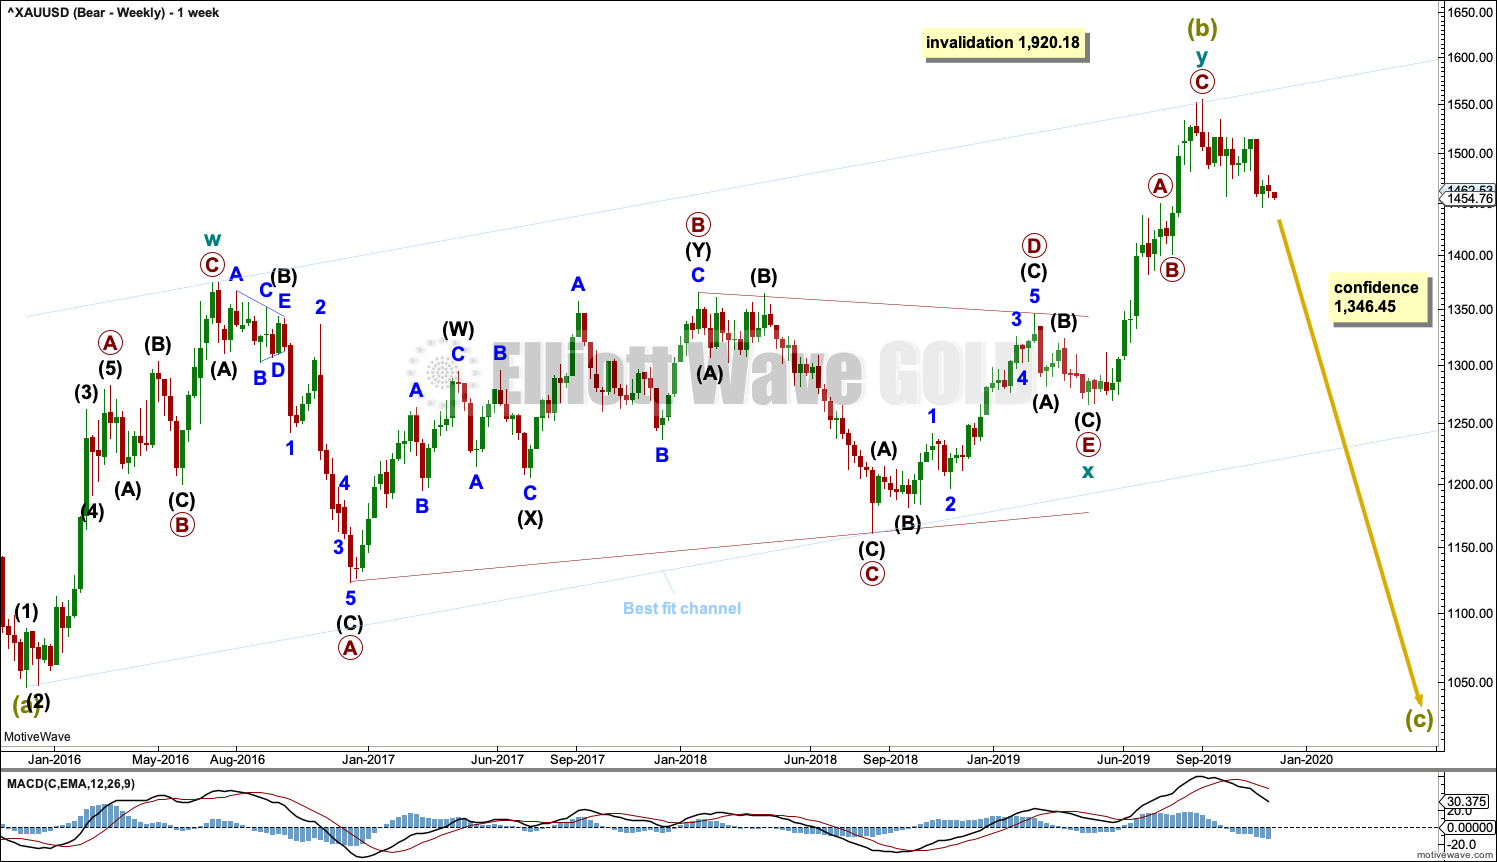
It is possible that Super Cycle wave (b) is complete as a double zigzag.
The first zigzag in the double is labelled cycle wave w. The double is joined by a three in the opposite direction, a triangle labelled cycle wave x. The second zigzag in the double is labelled cycle wave y.
The purpose of the second zigzag in a double is to deepen the correction. Cycle wave y has achieved this purpose.
A new low below 1,346.45 would add strong confidence to this wave count. At that stage, the bullish Elliott wave count would be invalidated.
A wide best fit channel is added in light blue. This channel contains all of Super Cycle wave (b) and may provide resistance and support. Copy this channel over to daily charts.
Super Cycle wave (c) must subdivide as a five wave structure, most likely an impulse. It may last several years. It would be very likely to make new lows below the end of Super Cycle wave (a) at 1,046.27 to avoid a truncation.
DAILY CHART
Click chart to enlarge.
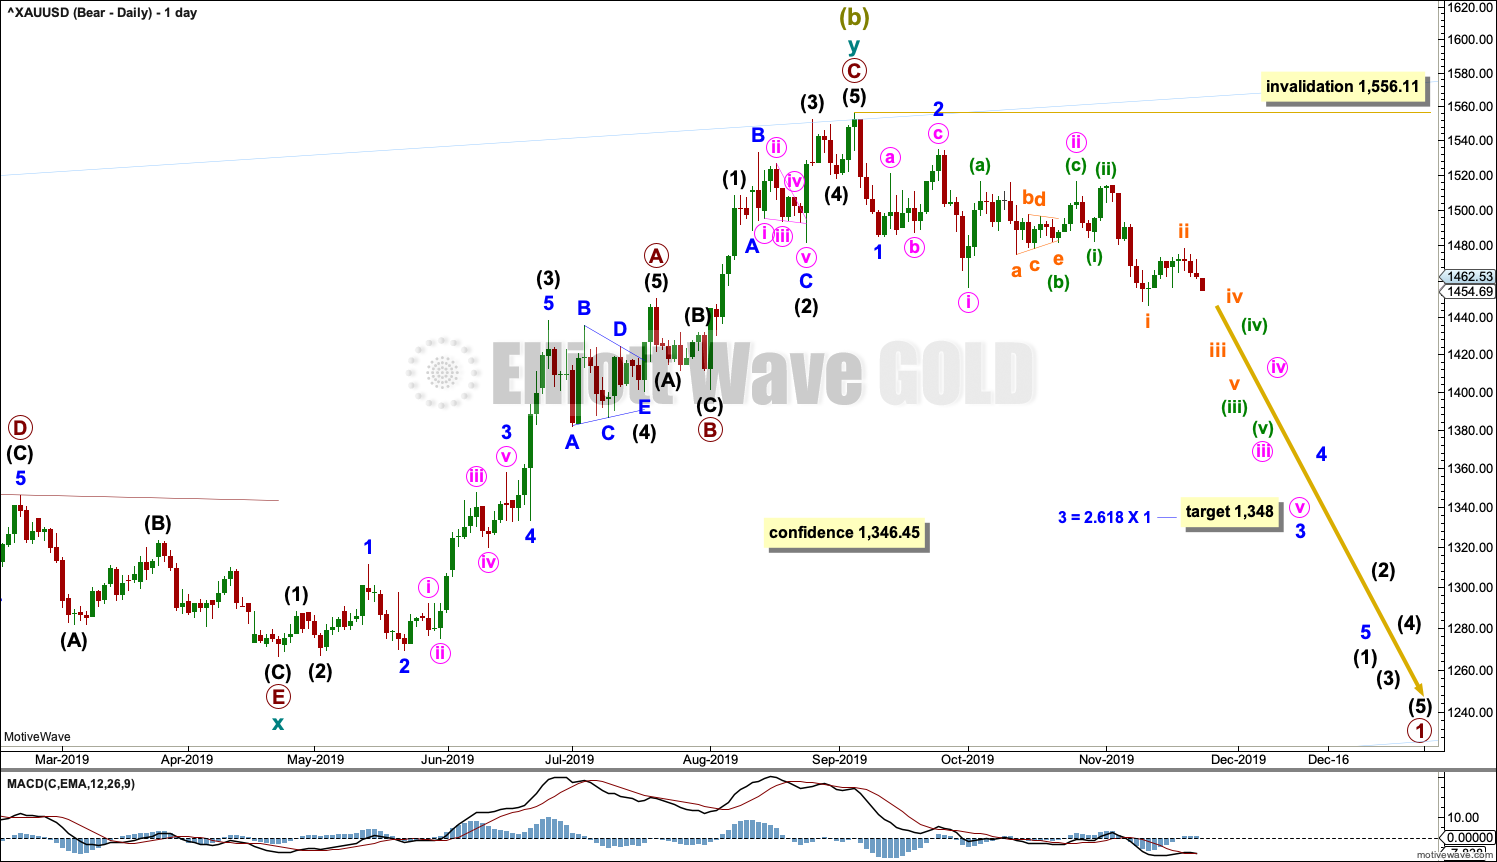
Classic analysis now reasonably supports this wave count.
Cycle wave y may be a complete zigzag. Within both of primary waves A and C, there is good proportion between intermediate waves (2) and (4). Within both of primary waves A and C, there is good alternation in structure of intermediate waves (2) and (4).
Within cycle wave y, there is no Fibonacci Ratio between primary waves A and C.
If there has been a trend change at Super Cycle degree, then a five down needs to develop on the daily and weekly charts. So far that is incomplete. It will be labelled intermediate wave (1).
HOURLY CHART
Click chart to enlarge.
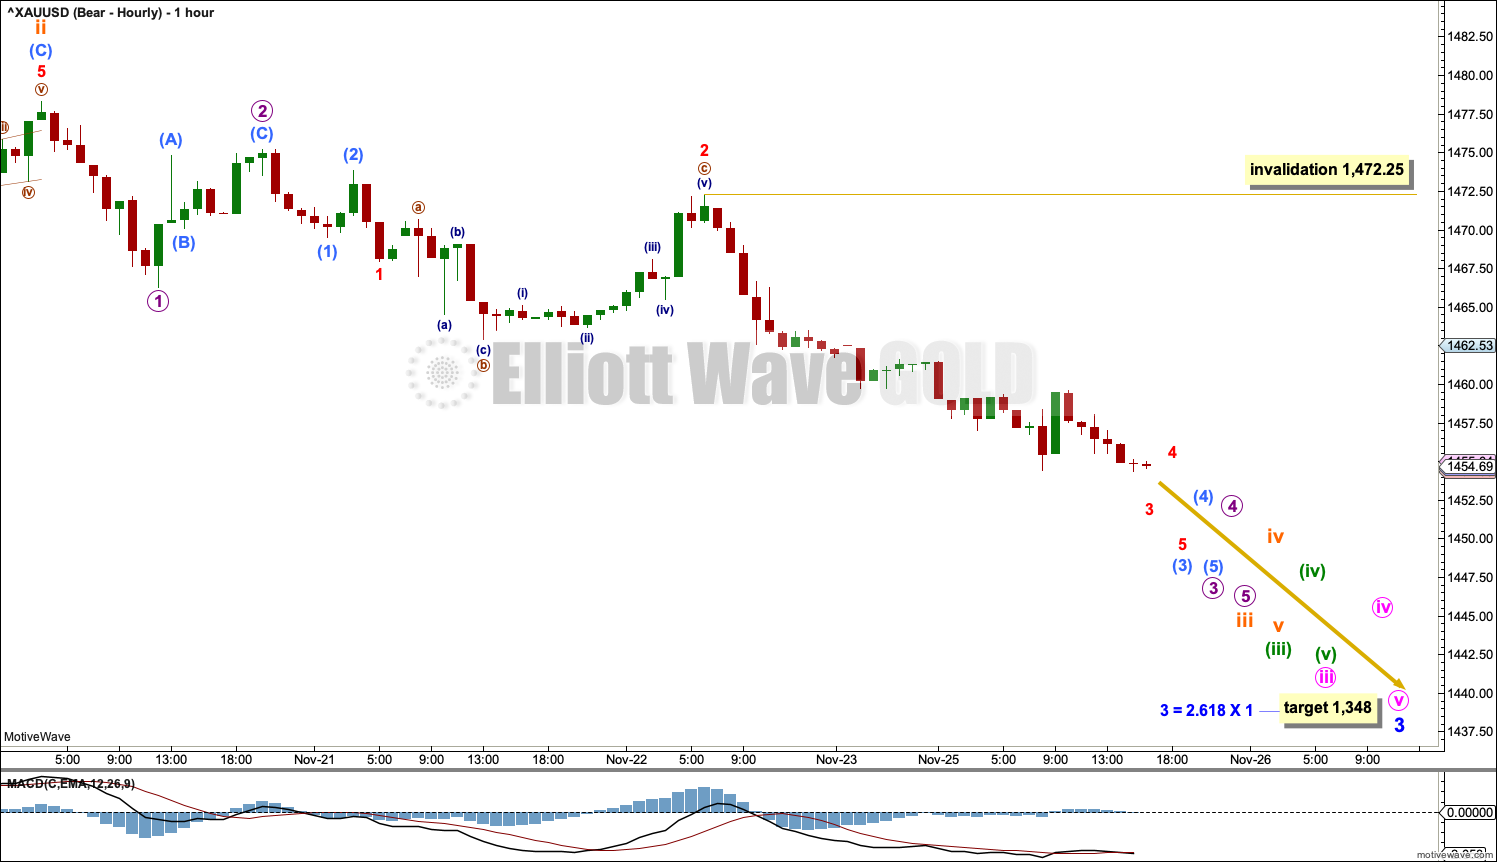
Subminuette wave ii may be complete as a double zigzag.
There may now be a series of seven complete first and second waves. A strong downwards breakout may come in the next day or so.
Gold typically exhibits swift and strong fifth waves. This tendency is especially prevalent for fifth waves to end third wave impulses one degree higher. Look for the possibility of one or more of these third waves to end with strength.
ALTERNATE DAILY CHART
Click chart to enlarge.
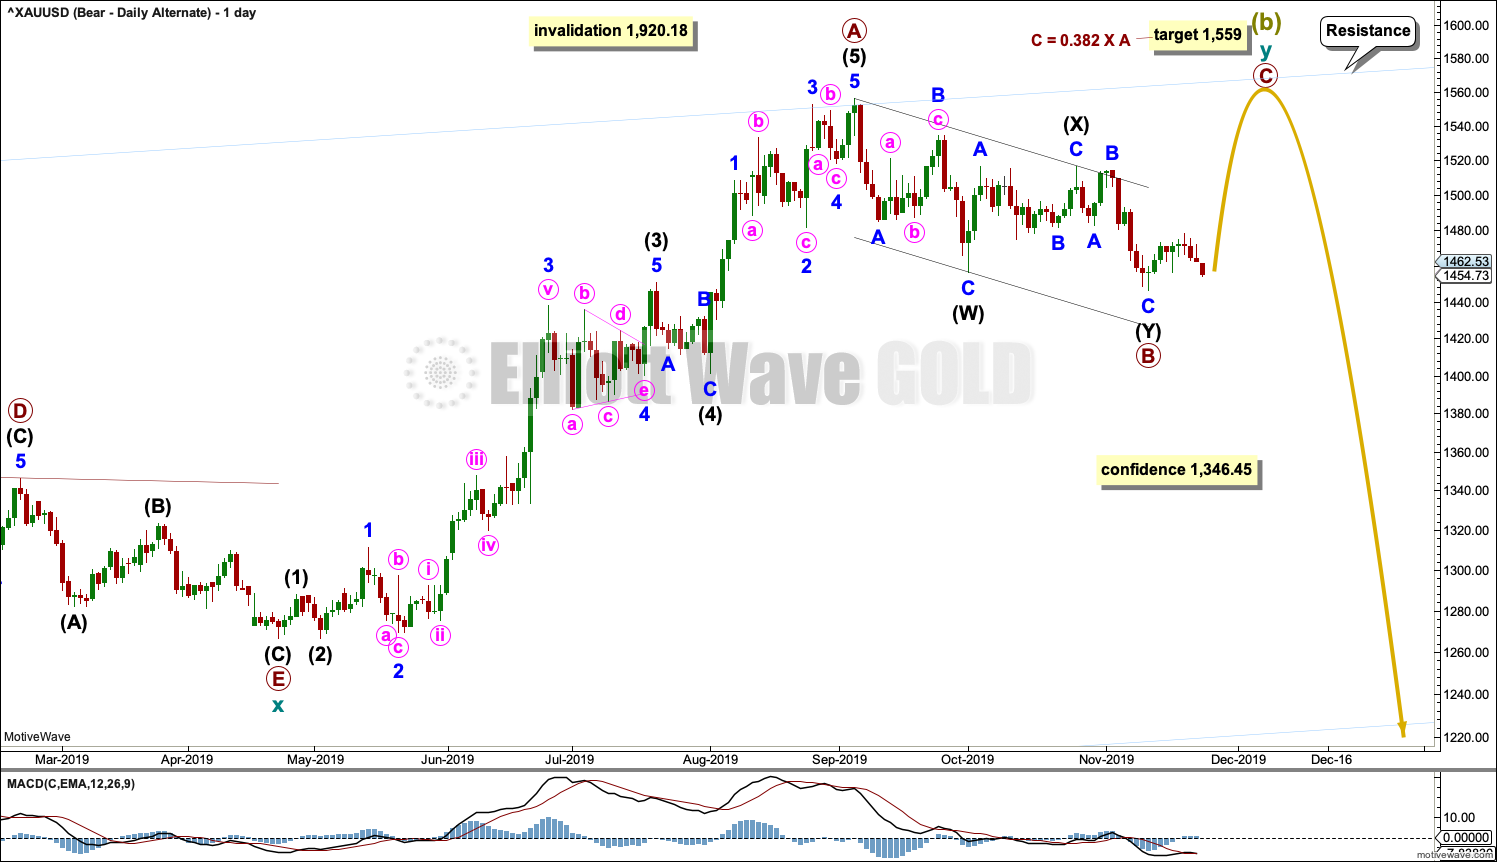
It is possible that the double zigzag for Super Cycle wave (b) may be incomplete and may yet require one more high.
Within cycle wave y, primary wave A may have been over at the last high. Primary wave B may now be complete as a double zigzag. Primary wave B may not move beyond the start of primary wave A below 1,266.61. However, while double zigzags are reasonably common structures, triple zigzags are fairly rare. The only structure which would allow for primary wave B to continue lower at this stage would be a triple zigzag. This wave count may be discarded if price makes a new low below 1,446.68.
Primary wave C would be expected to find strong resistance and end at the upper edge of the blue best fit channel copied over from the weekly chart.
BULLISH ELLIOTT WAVE COUNT
WEEKLY CHART
Click chart to enlarge.
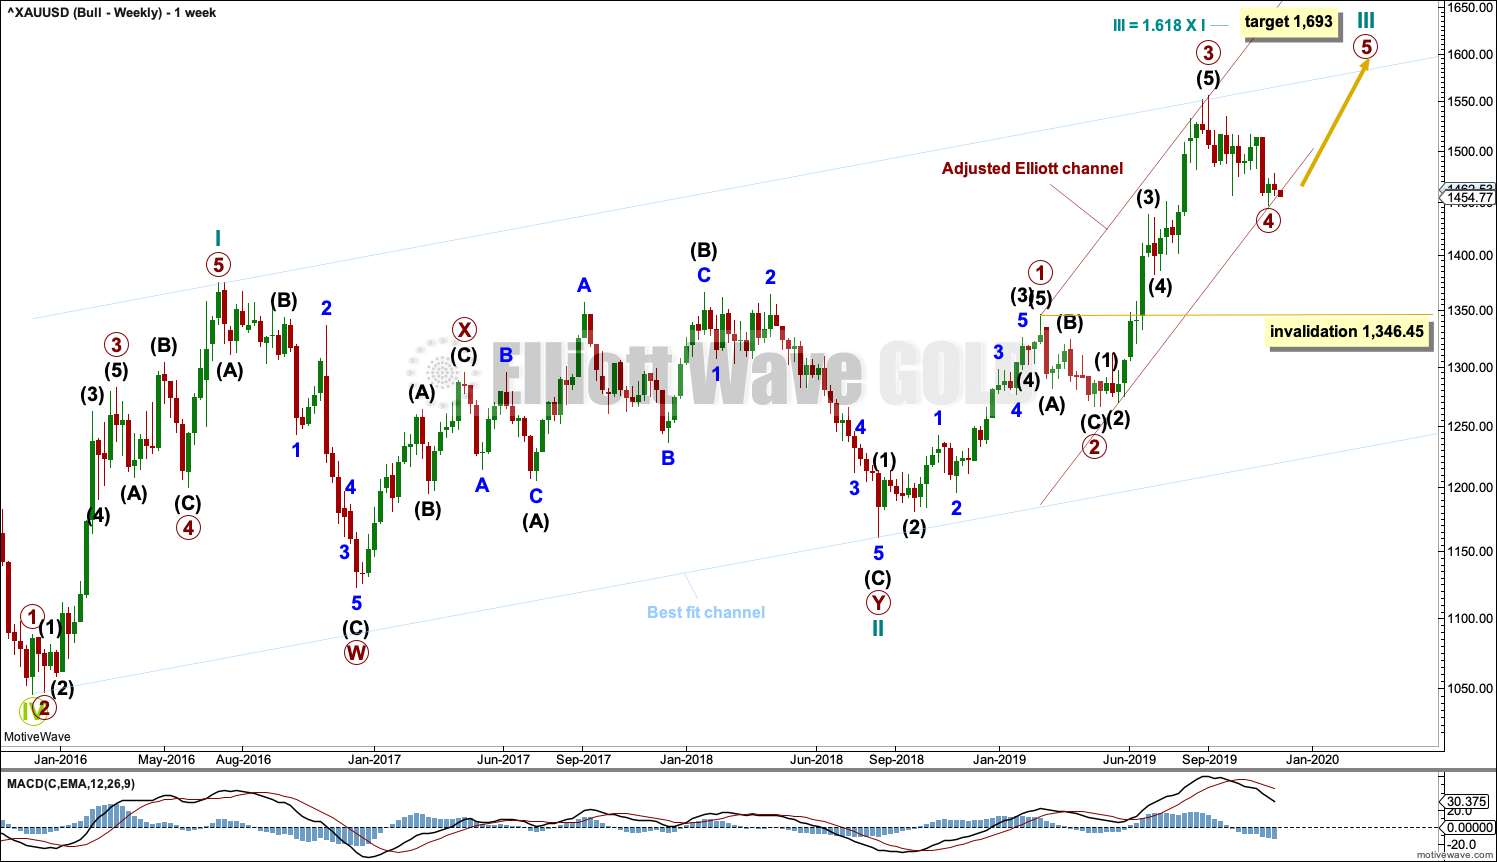
This wave count sees the the bear market complete at the last major low for Gold in November 2015.
If Gold is in a new bull market, then it should begin with a five wave structure upwards on the weekly chart. However, the biggest problem with this wave count is the structure labelled cycle wave I because this wave count must see it as a five wave structure, but it looks more like a three wave structure.
Commodities often exhibit swift strong fifth waves that force the fourth wave corrections coming just prior and just after to be more brief and shallow than their counterpart second waves. It is unusual for a commodity to exhibit a quick second wave and a more time consuming fourth wave, and this is how cycle wave I is labelled. This wave count still suffers from this very substantial problem, and for this reason the bearish wave count is still considered because it has a better fit in terms of Elliott wave structure.
Cycle wave II subdivides well as a double combination: zigzag – X – expanded flat.
Cycle wave III may have begun. Within cycle wave III, primary waves 1 and 2 may now be complete. Primary wave 3 has now moved above the end of primary wave 1 meeting a core Elliott wave rule. It has now moved far enough to allow room for primary wave 4 to unfold and remain above primary wave 1 price territory. Primary wave 4 may not move into primary wave 1 price territory below 1,346.45.
Cycle wave III so far for this wave count would have been underway now for 67 weeks. It exhibits some support from volume and increasing ATR. This wave count has some support from classic technical analysis.
The channel drawn about cycle wave III is an adjusted Elliott channel. The lower edge is pulled lower.
Add the wide best fit channel to weekly and daily charts.
DAILY CHART
Click chart to enlarge.
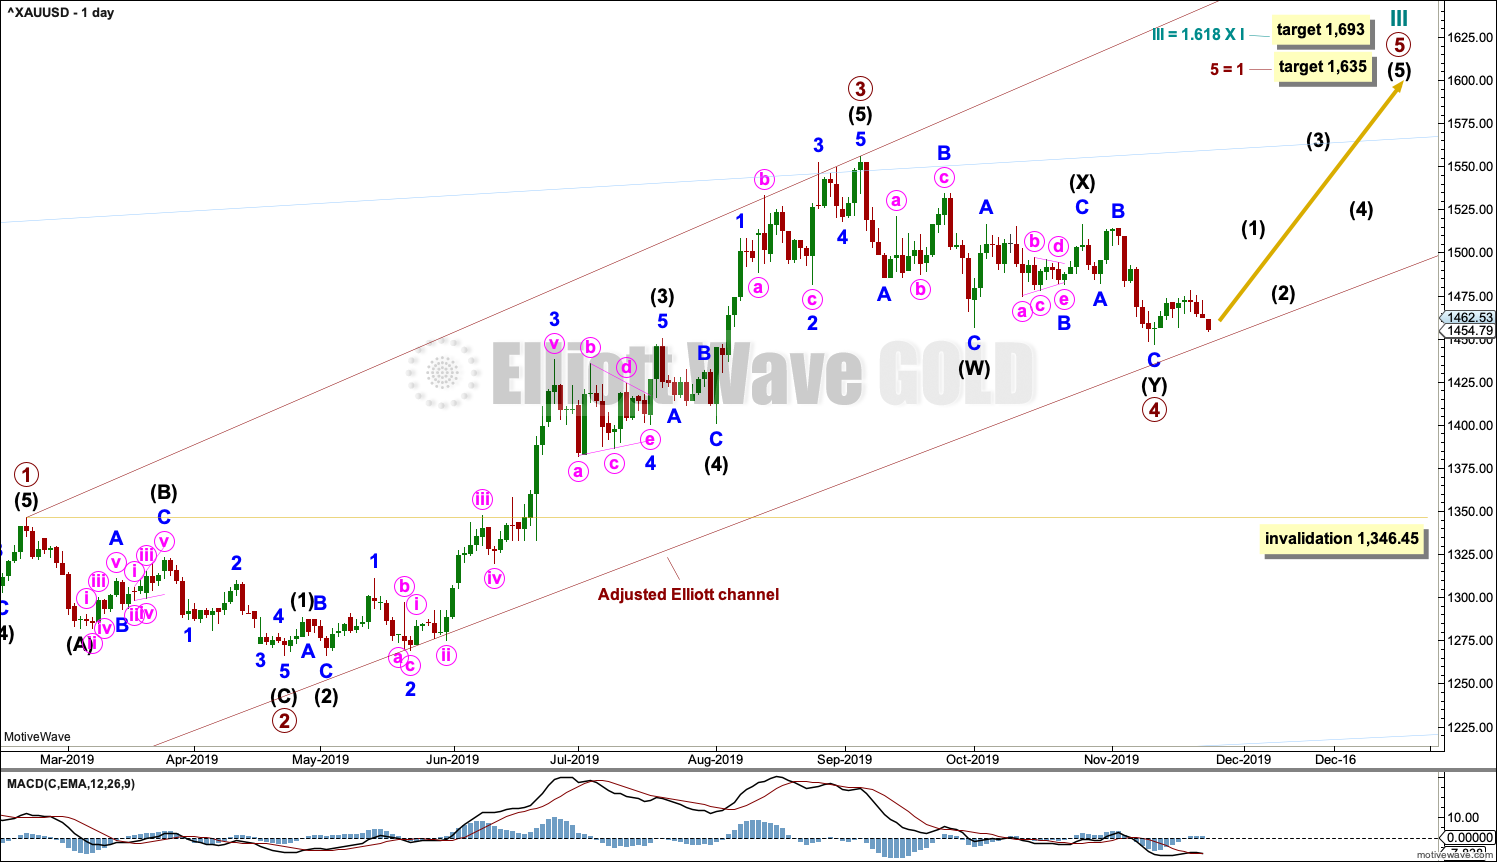
Primary wave 4 may be complete as a double zigzag. Primary wave 4 may have lasted 49 sessions, just six more than primary wave 2, which lasted 43 sessions. The proportion remains very good for this part of the wave count.
A target for cycle wave III is calculated also now at primary degree. If price reaches the first target and keeps rising, then the second higher target may be used.
If it continues any further, then primary wave 4 may not move into primary wave 1 price territory below 1,346.45.
HOURLY CHART
Click chart to enlarge.
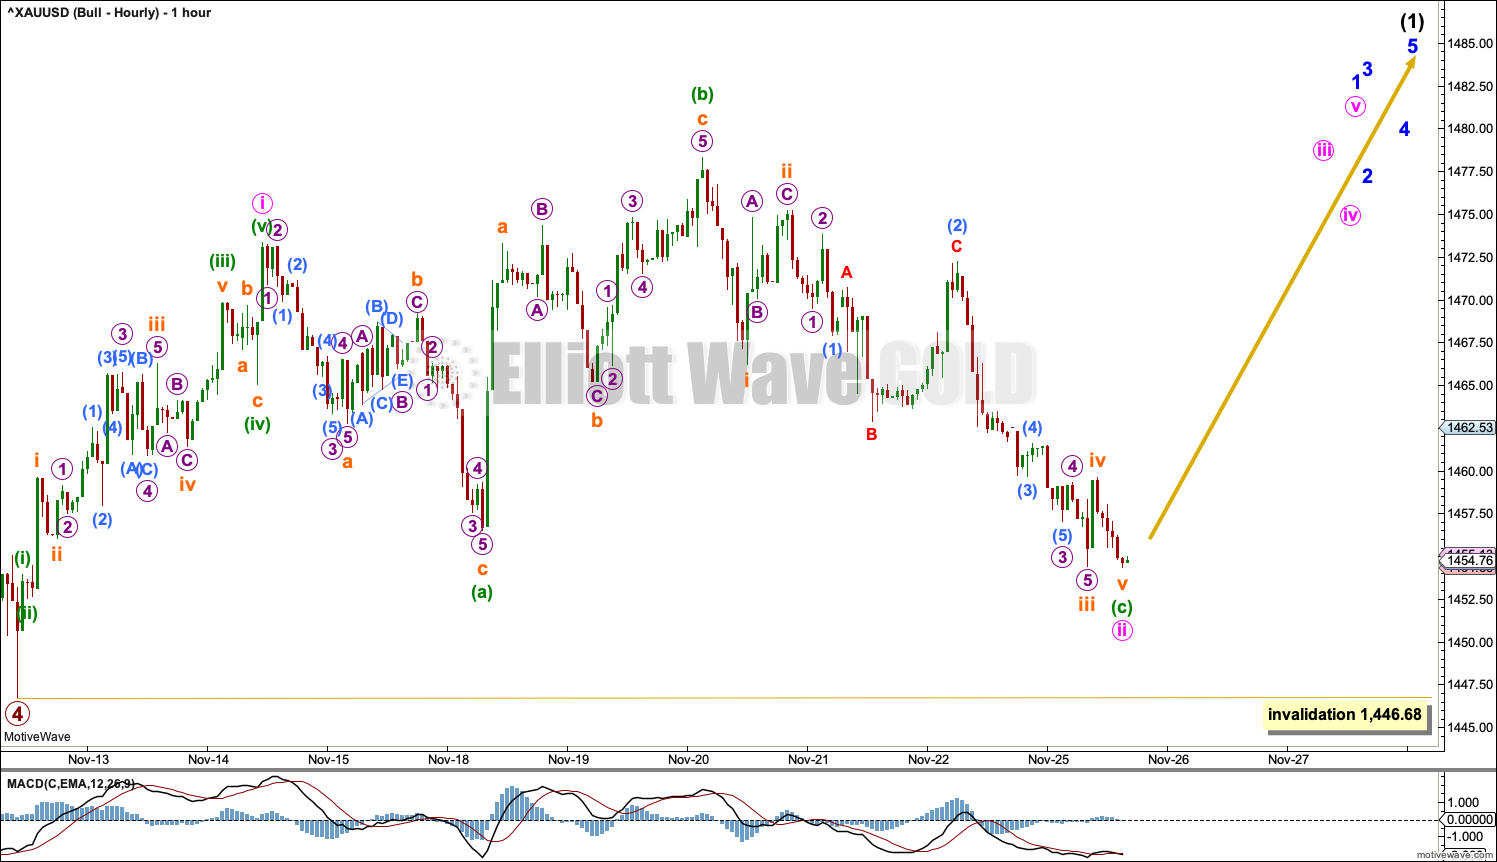
Primary wave 5 may have begun. Within primary wave 5, minor wave 1 of intermediate wave (1) may be unfolding higher as an impulse.
Within minor wave 1, minute wave i may be complete. Minute wave ii may have continued further today as an expanded flat correction. Minute wave ii may not move beyond the start of minute wave i below 1,446.68.
TECHNICAL ANALYSIS
MONTHLY CHART
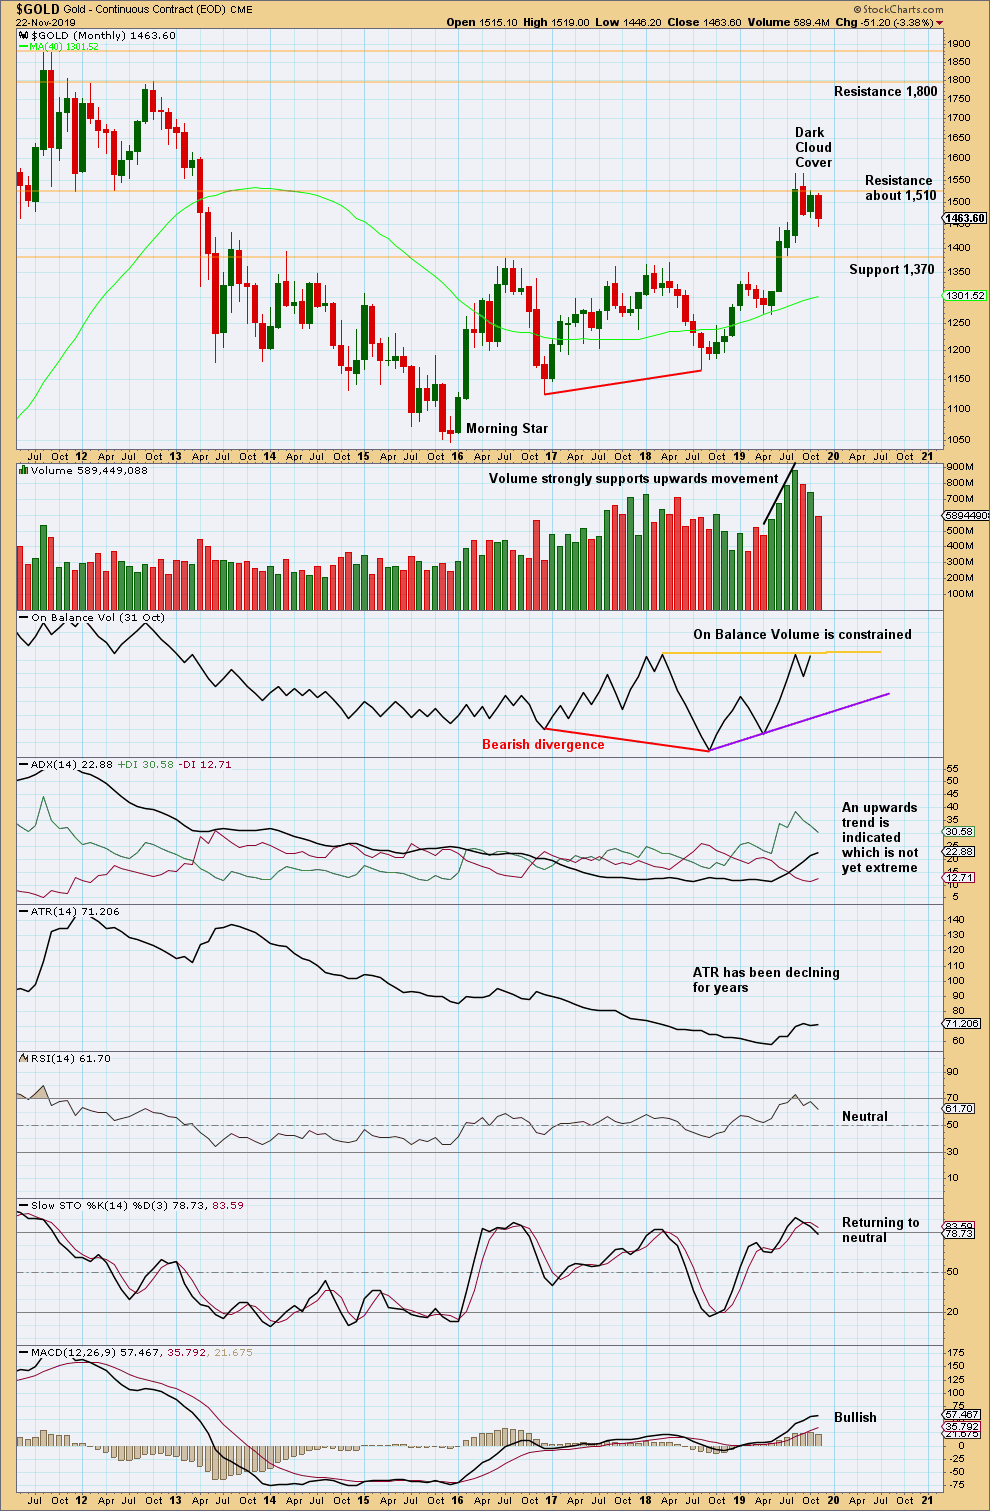
Click chart to enlarge. Chart courtesy of StockCharts.com.
Overall, this chart is bullish. However, with RSI reaching overbought at the last high, upwards movement may be limited.
The last two months of sideways movement look like a consolidation within an ongoing upwards trend.
Some suspicion regarding the current upwards trend may be warranted by bearish divergence between price and On Balance Volume at the last lows. Also, at the last high price has made a substantial new high above April 2018, but On Balance Volume is flat.
WEEKLY CHART
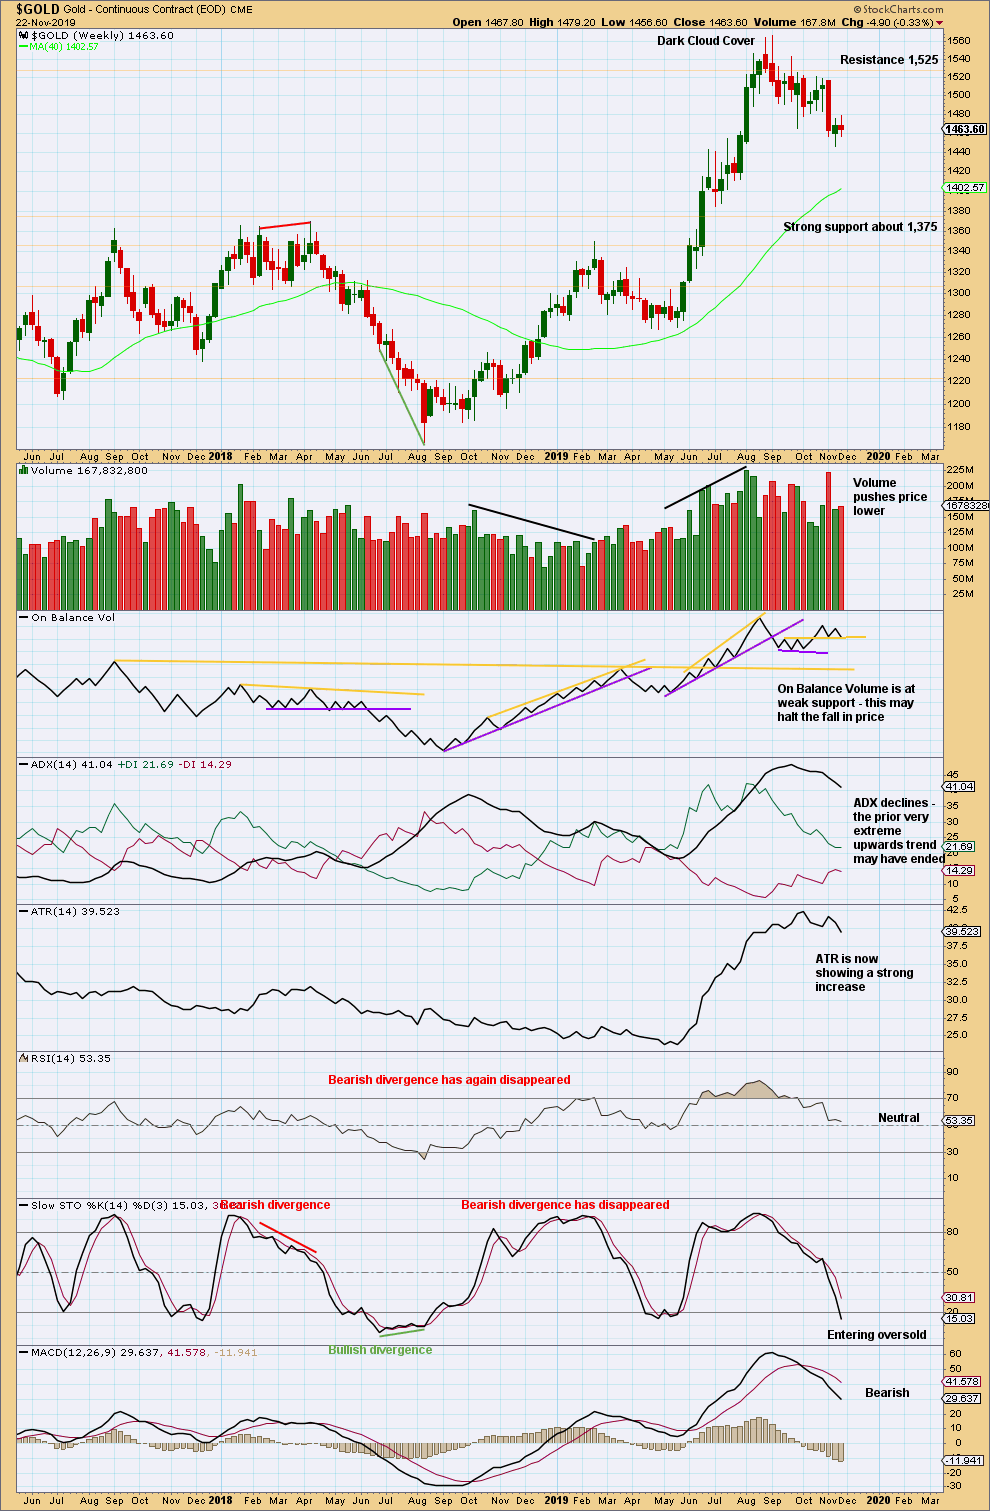
Click chart to enlarge. Chart courtesy of StockCharts.com.
When trends reach very extreme, candlestick reversal patterns should be given weight. The Dark Cloud Cover bearish reversal pattern is given more bearish weight from the long upper wick.
A very strong downwards week with strong support from volume four weeks ago supports a bearish view. The last week completes a small range Spinning Top pattern. This looks like a small pause within a developing downwards trend.
DAILY CHART
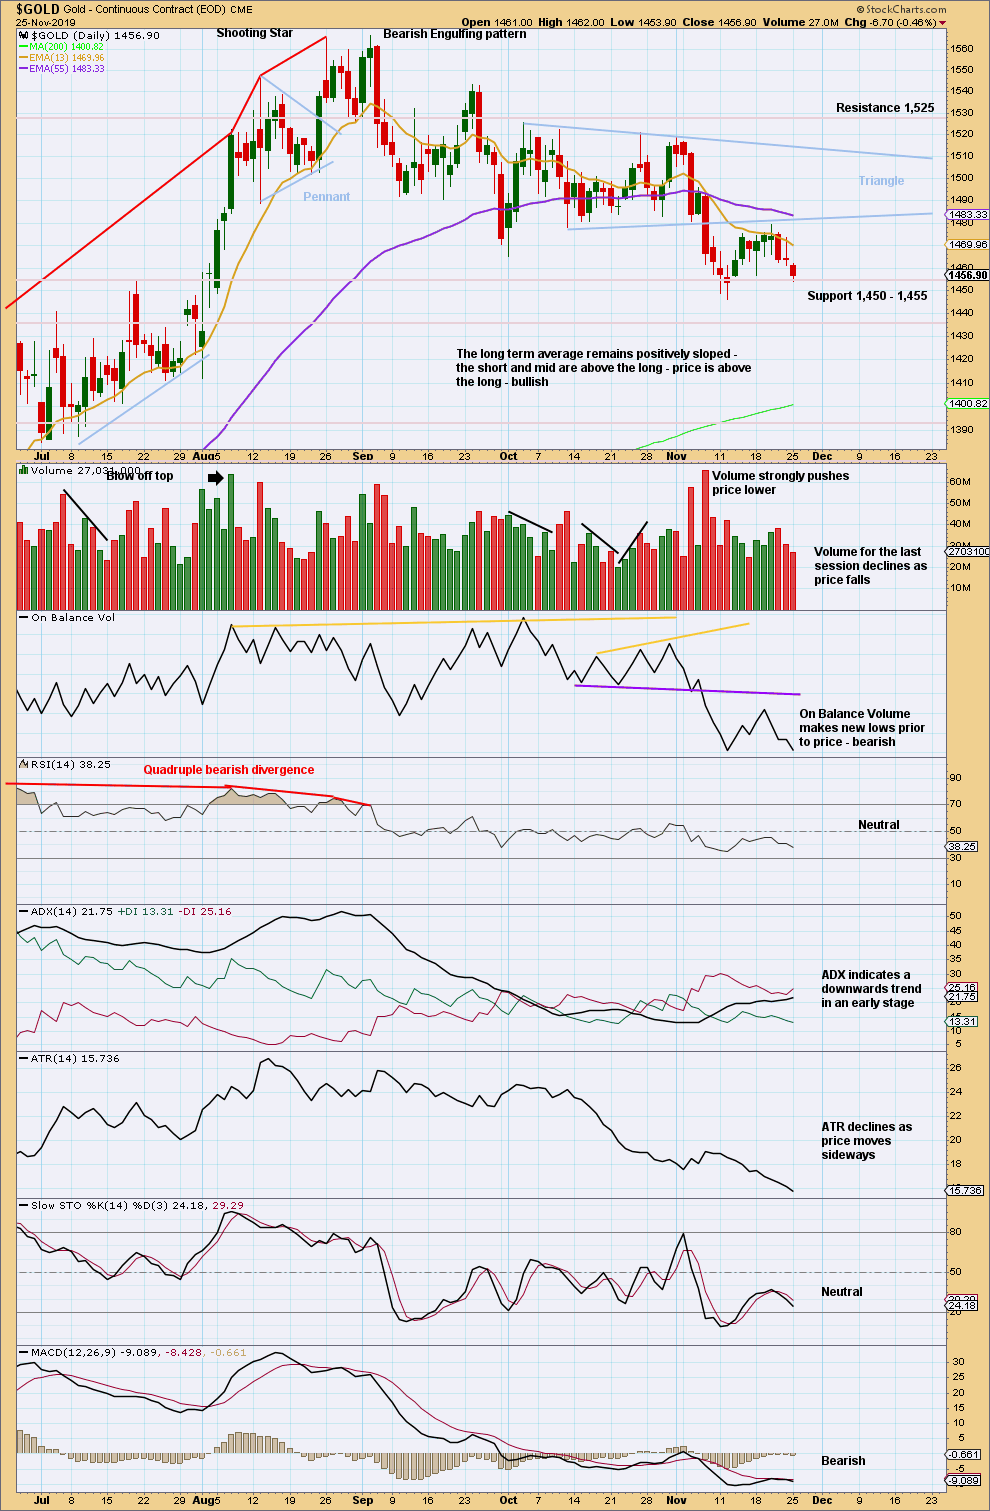
Click chart to enlarge. Chart courtesy of StockCharts.com.
Since the last high on the 4th of September, there is now a series of swing lows and swing highs.
After a breakout from the triangle, the target is to be about 1,431.
The downwards breakout from the triangle had strong support from volume pushing price lower, so confidence may be had in the breakout. A back test of resistance at the lower triangle trend line has now completed; resistance has successfully held there. It looks reasonable to now expect new lows from Gold in coming days. This chart strongly supports the bearish Elliott wave count.
Some decline in volume for two downwards sessions suggests a short-term bounce may unfold about support prior to a break through.
GDX WEEKLY CHART
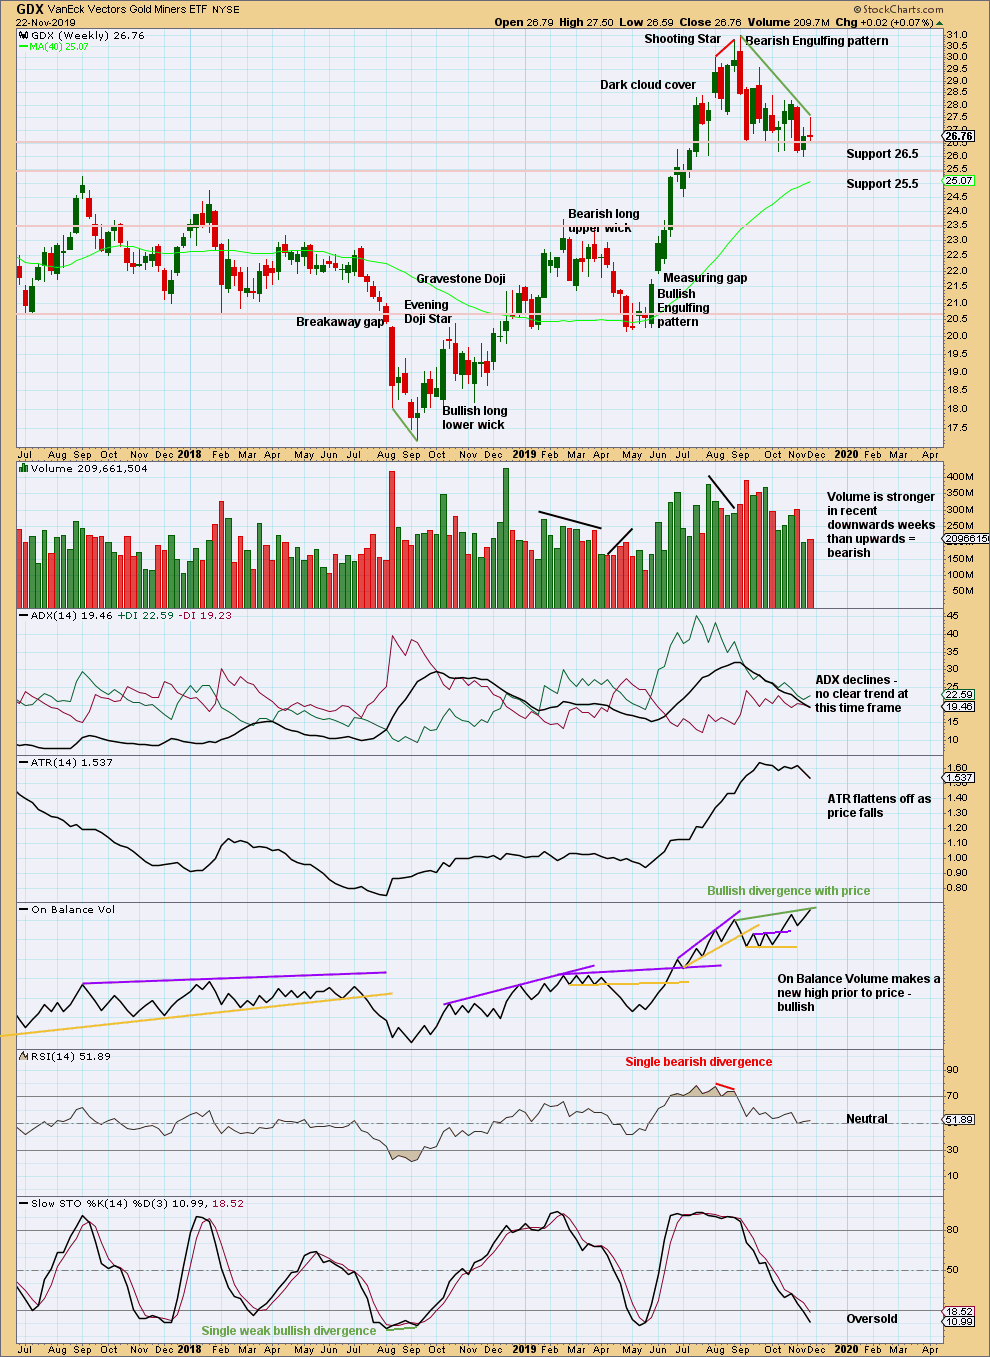
Click chart to enlarge. Chart courtesy of StockCharts.com.
GDX, like Gold, often begins a new trend slowly with overlapping and flat or declining ATR. From the last major high at 30.96 a few weeks ago, there has been a strong Bearish Engulfing pattern and strong downwards weeks with greater range and volume than upwards weeks. GDX may have had a trend change.
GDX DAILY CHART
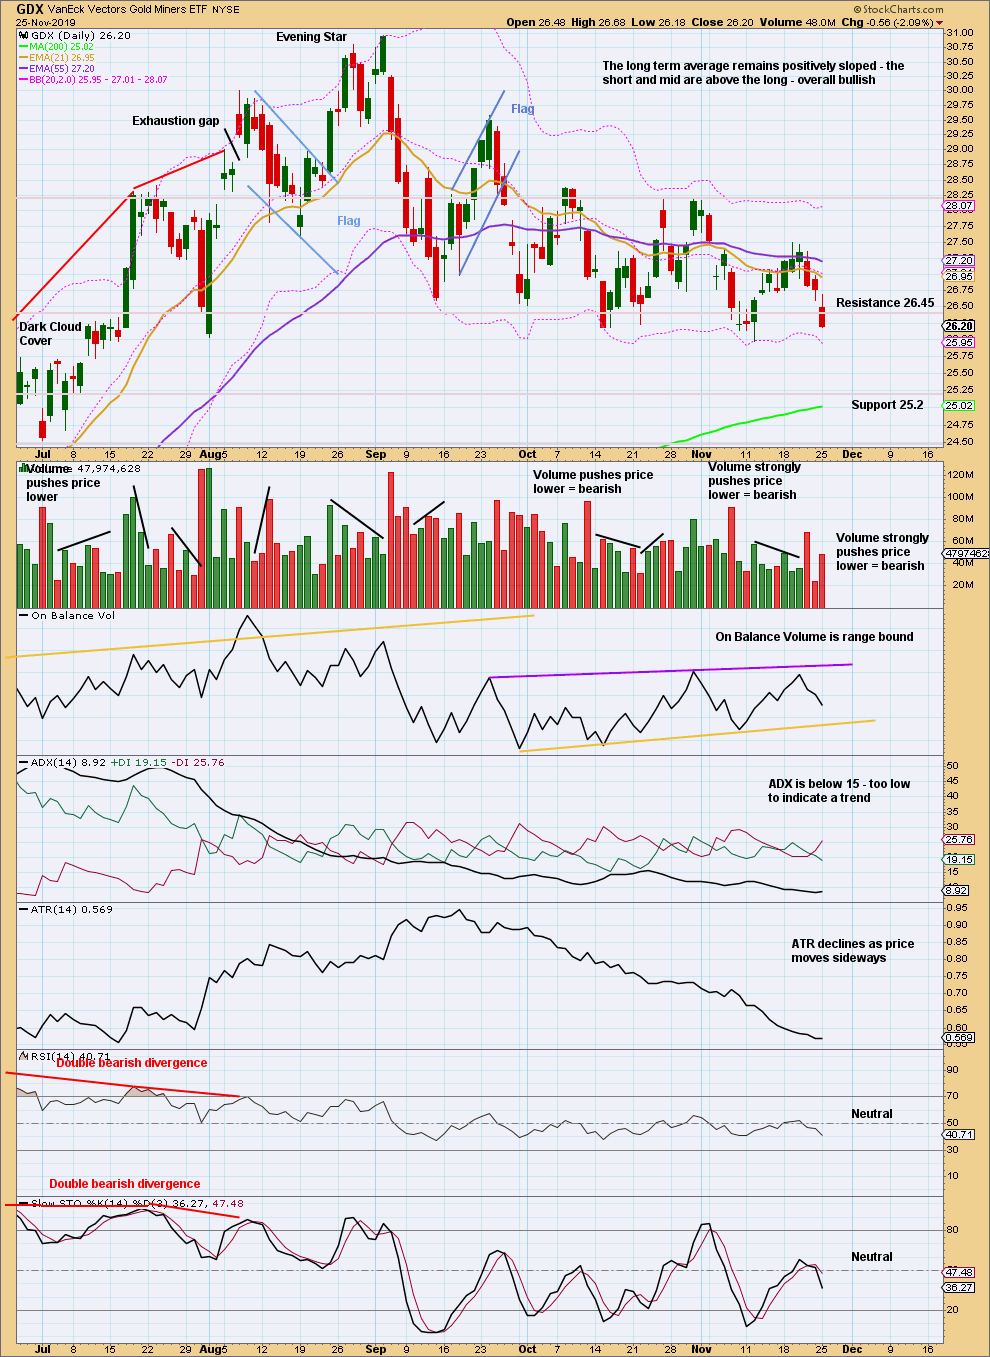
Click chart to enlarge. Chart courtesy of StockCharts.com.
GDX has made a new swing low. There is now a series of four lower swing highs and four lower swing lows from the high on the 4th of September. It still looks like GDX may have had a trend change. This view should remain dominant while the last swing high at 28.18 on the 31st of October remains intact.
It looks like the bounce is over and the downwards trend may now resume. With RSI and Stochastics back well within neutral territory, there is again room for price to fall.
Published @ 04:53 p.m. EST.
—
Careful risk management protects your trading account(s).
Follow my two Golden Rules:
1. Always trade with stops.
2. Risk only 1-5% of equity on any one trade.
—
New updates to this analysis are in bold.
hourly bear chart updated
another impulse lower looks to be forming, I’ve moved the degree of labelling within it down one
Disposed of my JDST at breakeven. Sitting on hands for now.
I don’t like the strength of today for going short. will wait till tomorrow and see further developments.