
SILVER: Elliott Wave and Technical Analysis | Charts – November 29, 2019
Summary: For the very short term, a counter trend bounce may move a little higher to begin next week. Overall, expect downwards movement as most likely to continue. The next target is at 15.385.
If the current small bounce continues higher, then it should not move above 17.606.
ELLIOTT WAVE COUNTS
Last updated monthly charts may be found here.
BEARISH WAVE COUNT
WEEKLY CHART
Click chart to enlarge.
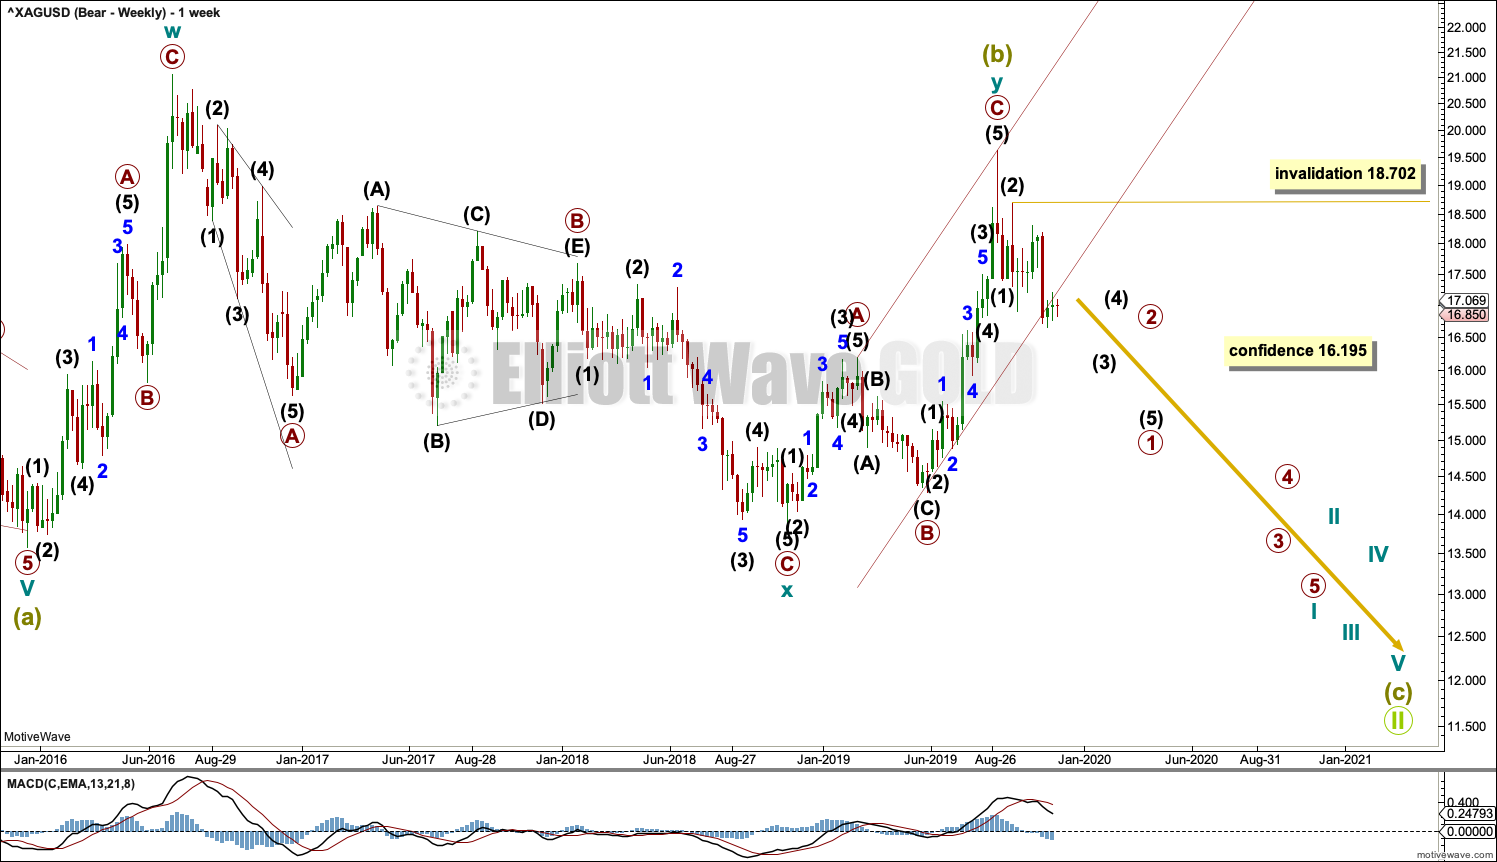
Super Cycle wave (b) may be a complete double zigzag.
The first zigzag in the double is labelled cycle wave w. The double is joined by a three in the opposite direction, a zigzag labelled cycle wave x that is atypically very deep.
The second zigzag in the double is labelled cycle wave y. Cycle wave y has failed by a very wide margin to achieve its purpose of deepening the correction, nor has cycle wave y managed to move beyond the end of cycle wave w. This is not technically a truncation (truncations refer only to C and fifth waves), but the effect is the same.
This wave count has strong support from classic analysis. That is the only reason why it is a main wave count despite the problems in terms of Elliott wave structure.
Super Cycle wave (c) should move beyond the end of Super Cycle wave (a) below 14.063 to avoid a truncation. Super Cycle wave (c) must subdivide as a five wave structure.
Within intermediate wave (3), no second wave correction may move beyond its start above 18.702.
DAILY CHART
Click chart to enlarge.
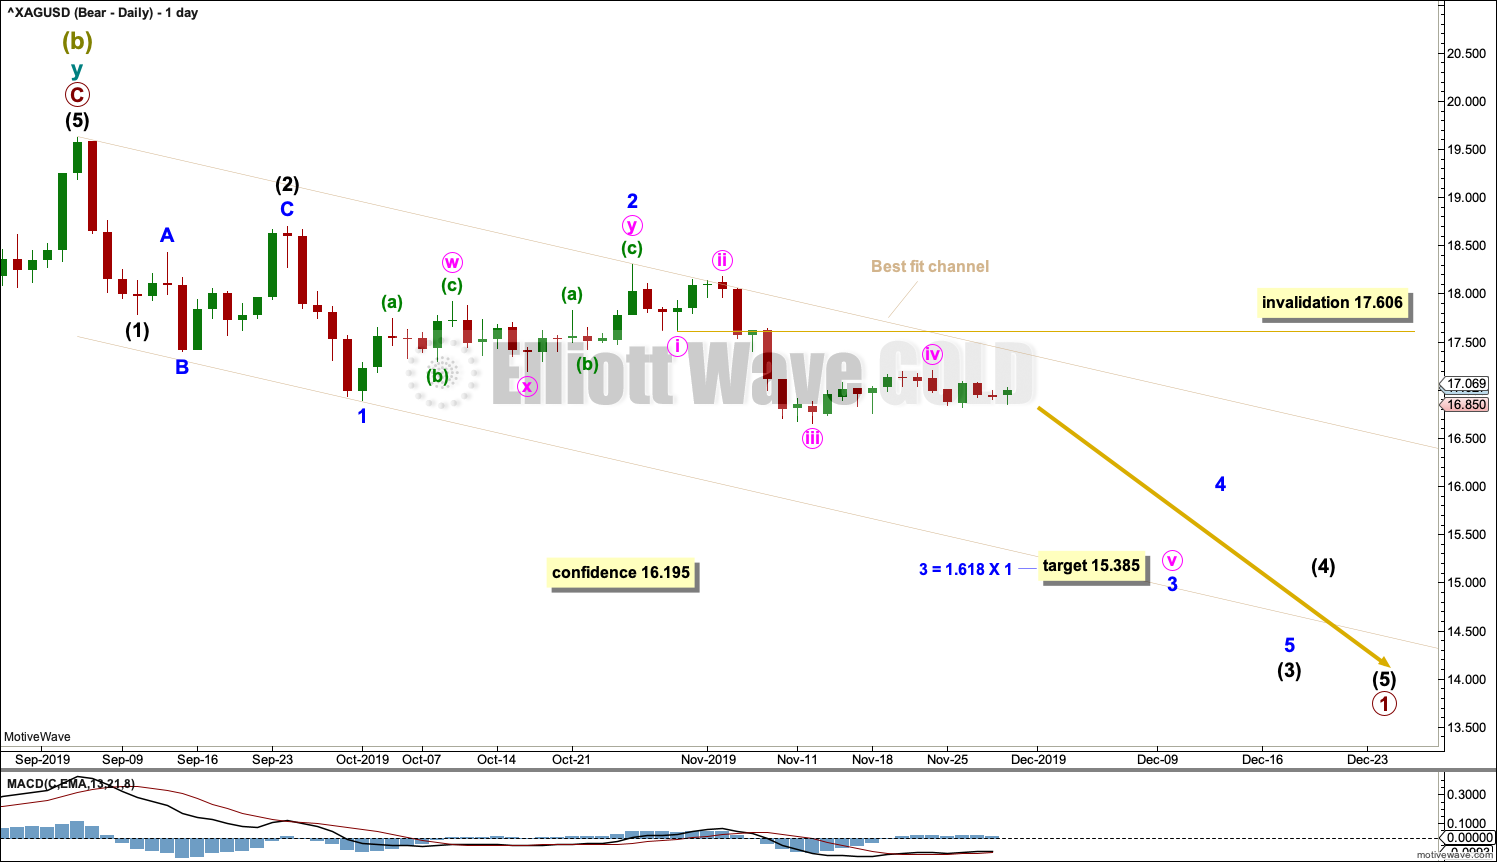
Within the new downwards trend, primary wave 1 may be incomplete.
Within primary wave 1, intermediate waves (1) and (2) may be complete. Intermediate wave (3) may have begun.
Within intermediate wave (3), minor waves 1 and 2 may be complete. Within minor wave 3, minute wave iv may not move into minute wave i price territory above 17.606.
Minute waves ii and iv still look mostly in proportion. Minute wave iv is longer lasting but not enough for the wave count to lose the right look. Minute wave iv has remained below minute wave i price territory.
Draw a channel about this downwards movement as shown. If price continues sideways or higher next week, then the upper edge of this channel may offer resistance.
Look out for the possibility that one or both of minute wave v and minor wave 5 may end with very strong downwards movements. Silver, typical of commodities, exhibits swift strong fifth waves. This tendency is especially prevalent in its fifth waves to end third wave impulses one degree higher.
ALTERNATE WEEKLY CHART
Click chart to enlarge.
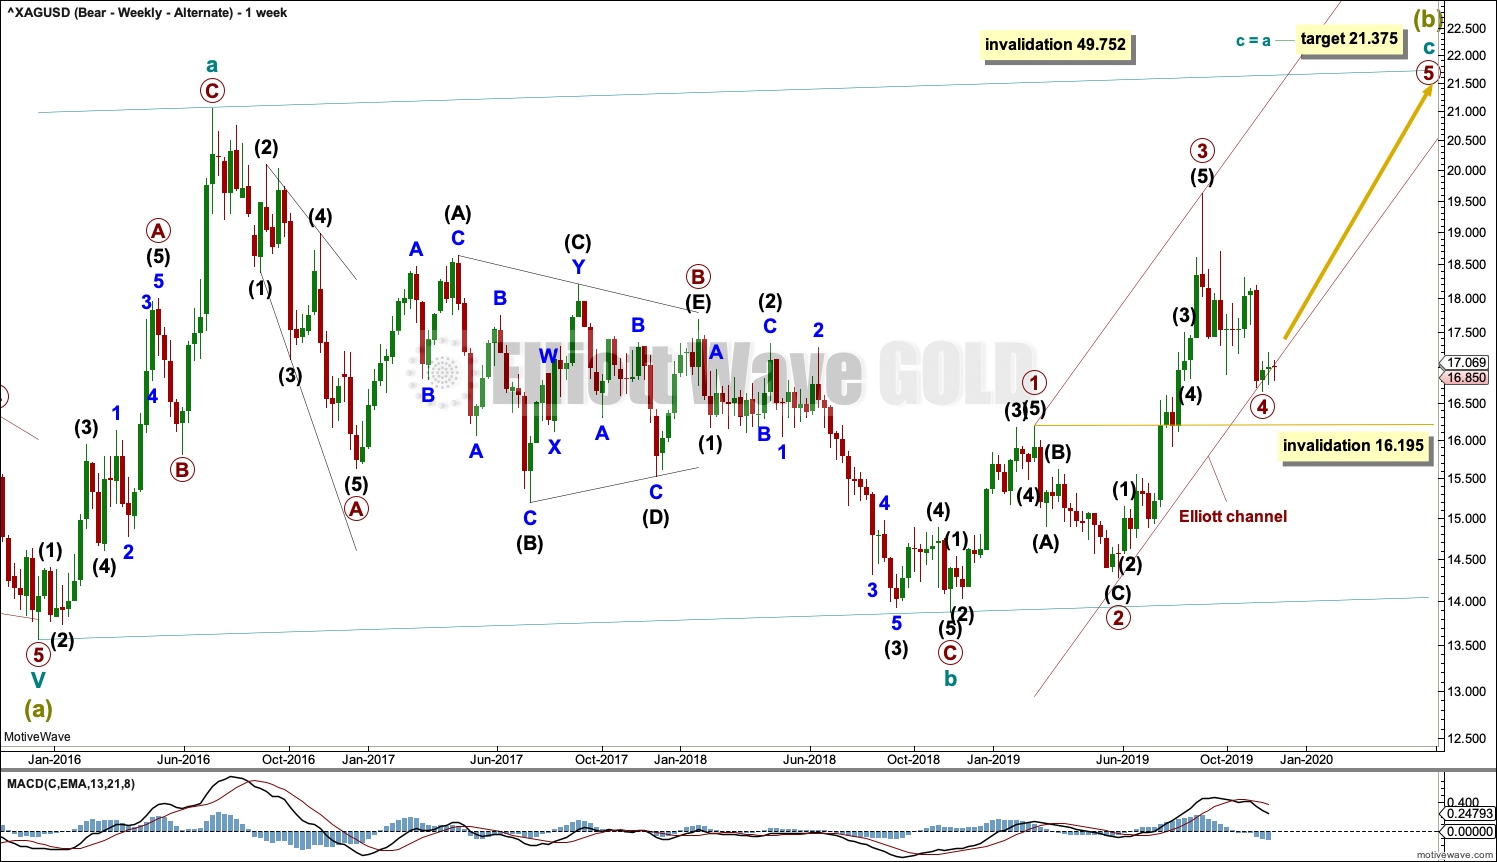
Super Cycle wave (b) may be an incomplete regular flat correction.
Within the regular flat correction, cycle wave a subdivides well as a zigzag and cycle wave b subdivides well as a zigzag, which is a 0.96 correction of cycle wave a.
Cycle wave c must complete as a five wave structure. Within cycle wave c, primary waves 1 through to 4 may be complete. If it continues any further, then primary wave 4 may not move into primary wave 1 price territory below 16.195.
Regular flat corrections often fit within parallel channels. Cycle wave c may end about resistance at the upper edge of the channel. The most common Fibonacci Ratio for cycle wave c within a regular flat would be equality in length with cycle wave a.
It would be extremely likely, for this wave count, for cycle wave c to move at least slightly above the end of cycle wave a at 21.062 to avoid a truncation.
Within cycle wave c, primary waves 1 and 3 both lasted 14 weeks, one longer than a Fibonacci 13. Primary wave 5 may last a total Fibonacci 8 or 13 weeks.
ALTERNATE DAILY CHART
Click chart to enlarge.
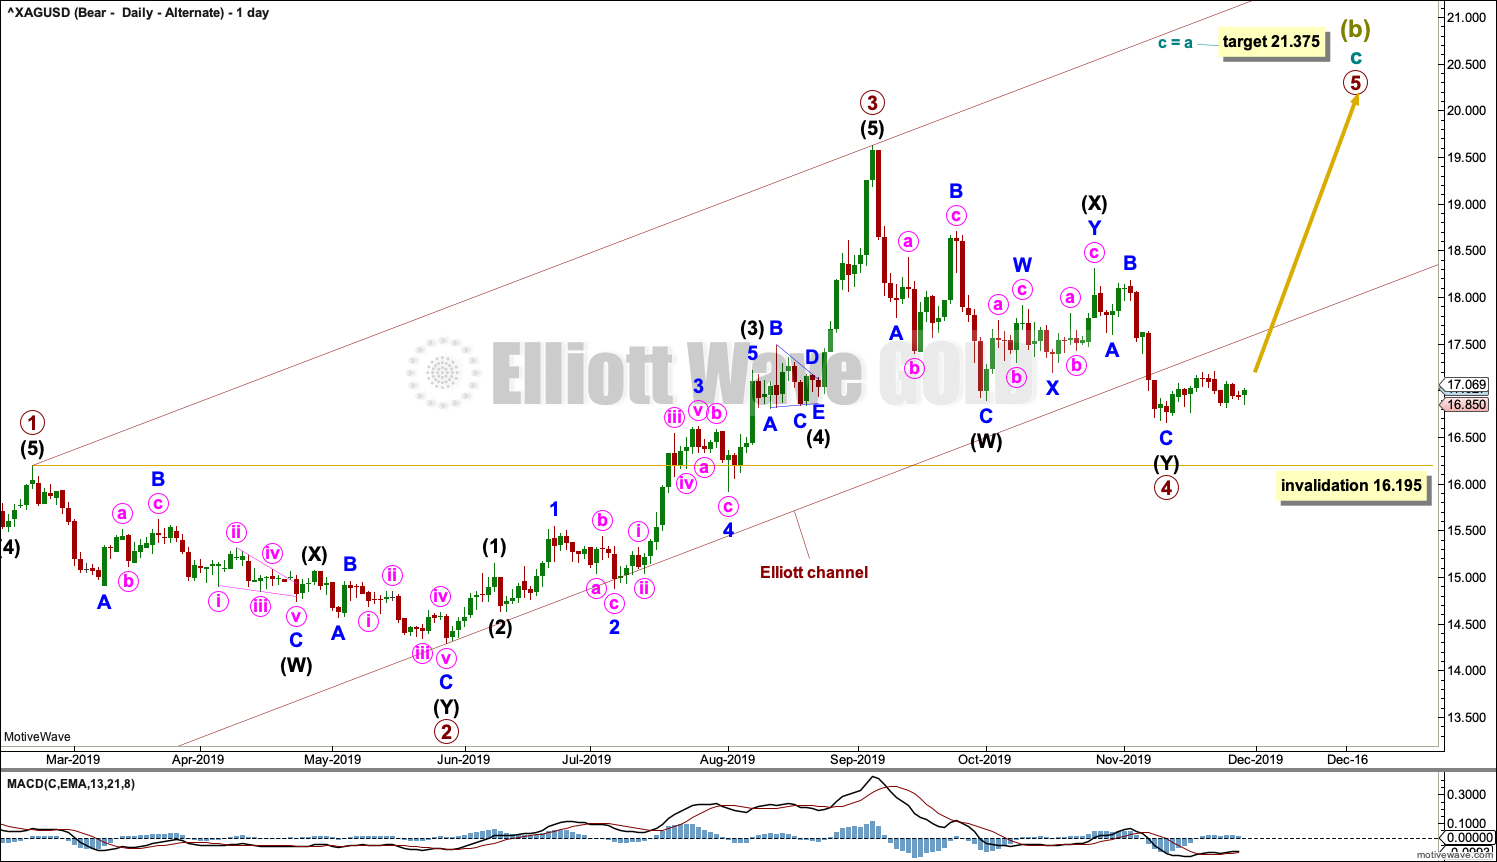
Cycle wave C may be subdividing as an impulse. Within the impulse, primary waves 1 to 4 may be complete. Primary wave 4 may have continued lower this week as a double zigzag.
If it continues any further, then primary wave 4 may not move into primary wave 1 price territory below 16.195.
Primary wave 2 lasted 69 sessions and subdivided as a deep 0.82 double zigzag. If it is complete as labelled, then primary wave 4 may have exhibited almost no alternation as a double zigzag and more shallow at 0.56 of primary wave 3.
Primary wave 4 would still be more brief than primary wave 2; fourth waves for Silver tend to be more brief than counterpart second waves.
Primary wave 5 must subdivide as a five wave structure.
BULLISH WAVE COUNT
WEEKLY CHART
Click chart to enlarge.
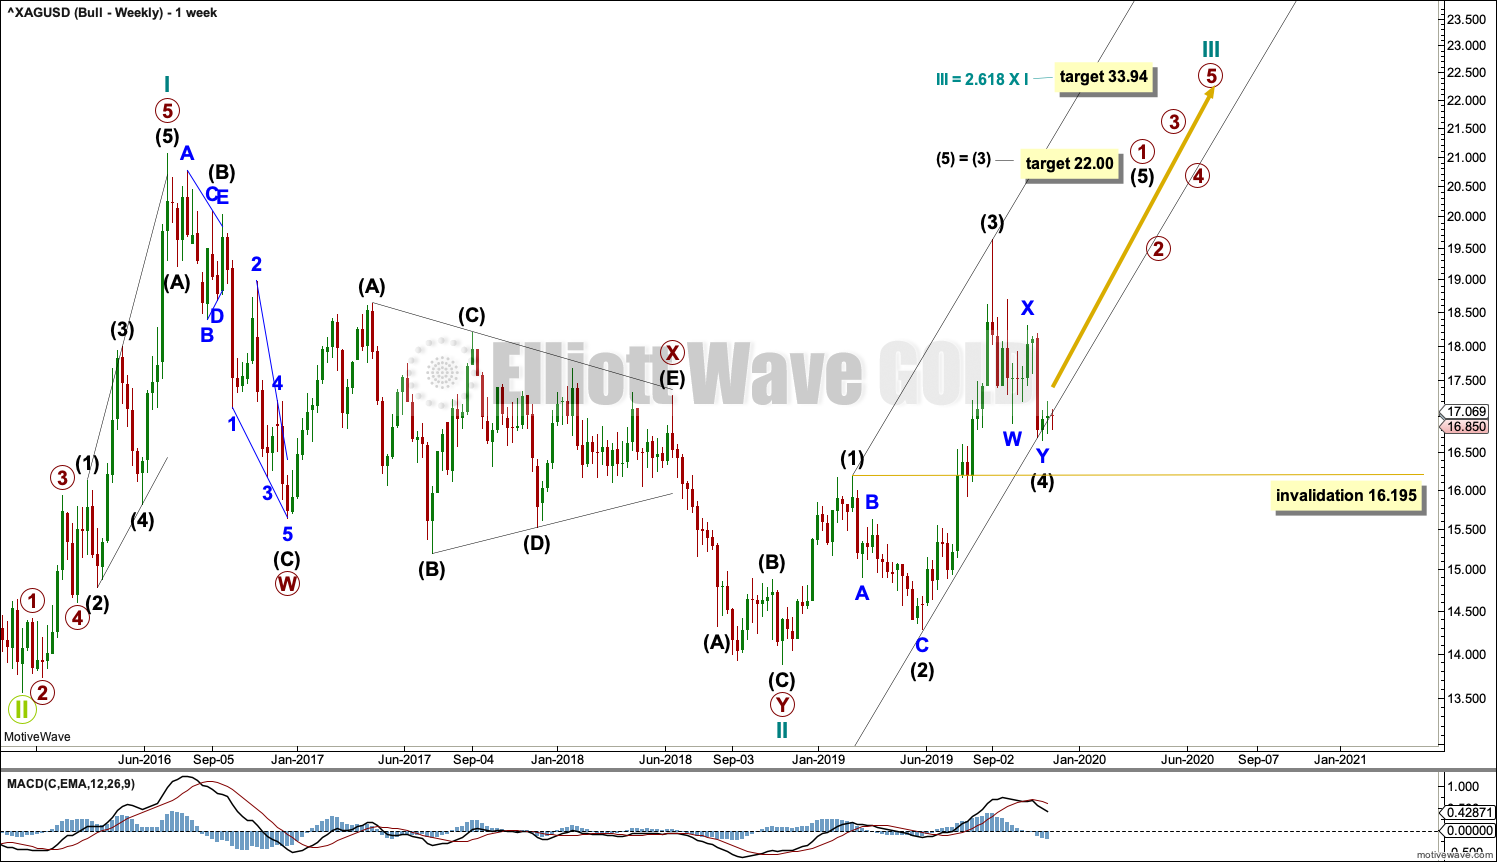
This bullish Elliott wave count sees a new bull market beginning for Silver at the low in December 2015.
A new bull market should begin with a five wave structure upwards. This is labelled cycle wave I.
Following five steps forward should be three steps back. This is labelled cycle wave II. The Elliott wave corrective structure of cycle wave II is labelled as a double zigzag, which is a fairly common structure.
Cycle wave III may only subdivide as an impulse. Within cycle wave III, only primary wave 1 may be unfolding. Within primary wave 1, intermediate wave (4) may not move into intermediate wave (1) price territory below 16.195.
Cycle wave III must move beyond the end of cycle wave I above 21.062. Cycle wave III must move far enough above this point to allow room for cycle wave IV to unfold and remain above cycle wave I price territory.
DAILY CHART
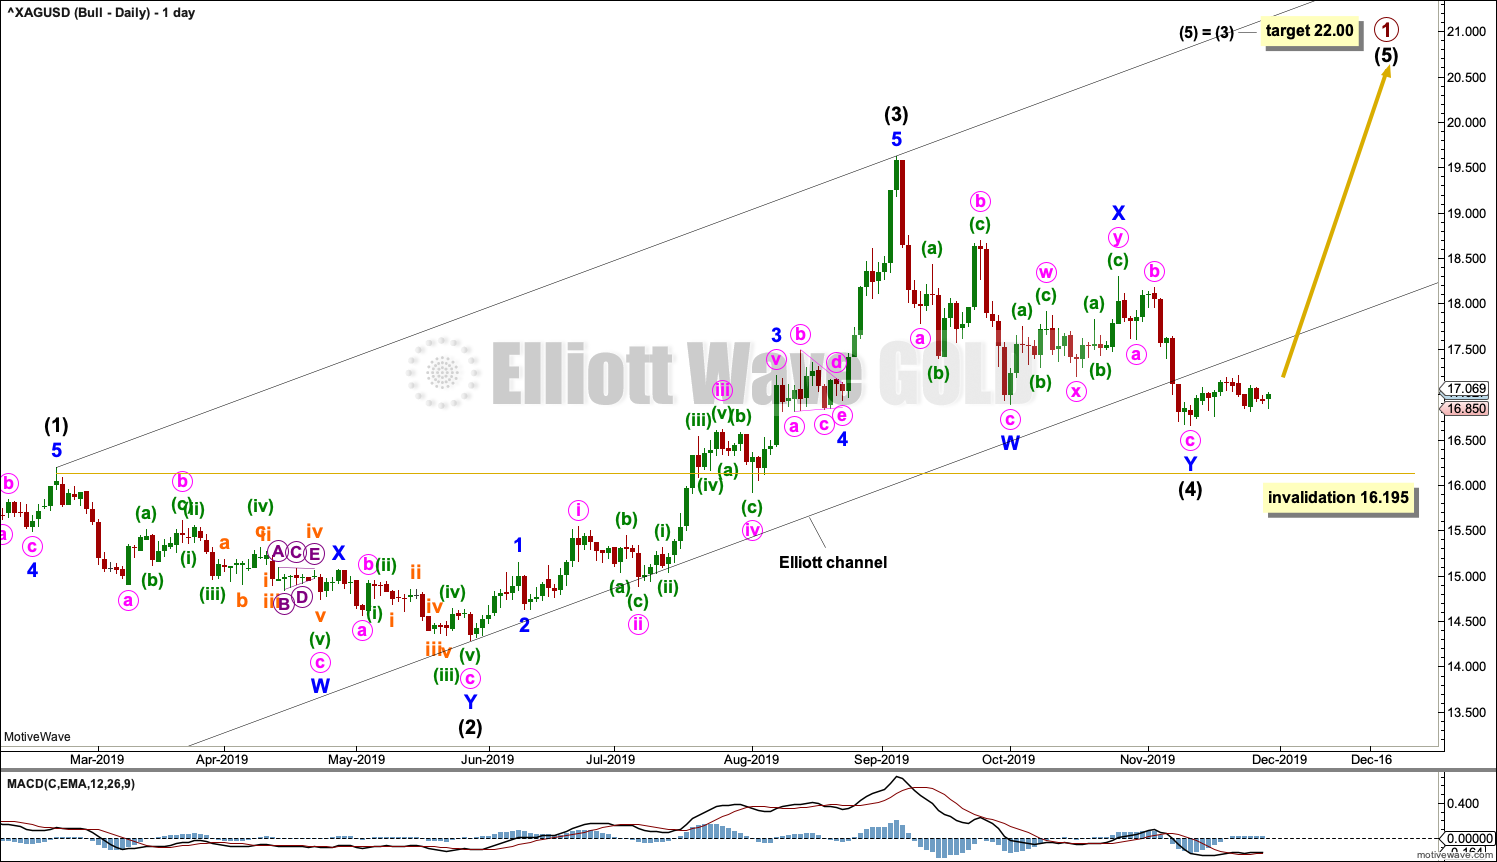
Click chart to enlarge.
Both this bullish Elliott wave count and the bearish alternate Elliott wave count now expect a fourth wave has completed. The targets for the next upwards movement are different.
TECHNICAL ANALYSIS
WEEKLY CHART
Click chart to enlarge. Chart courtesy of StockCharts.com.
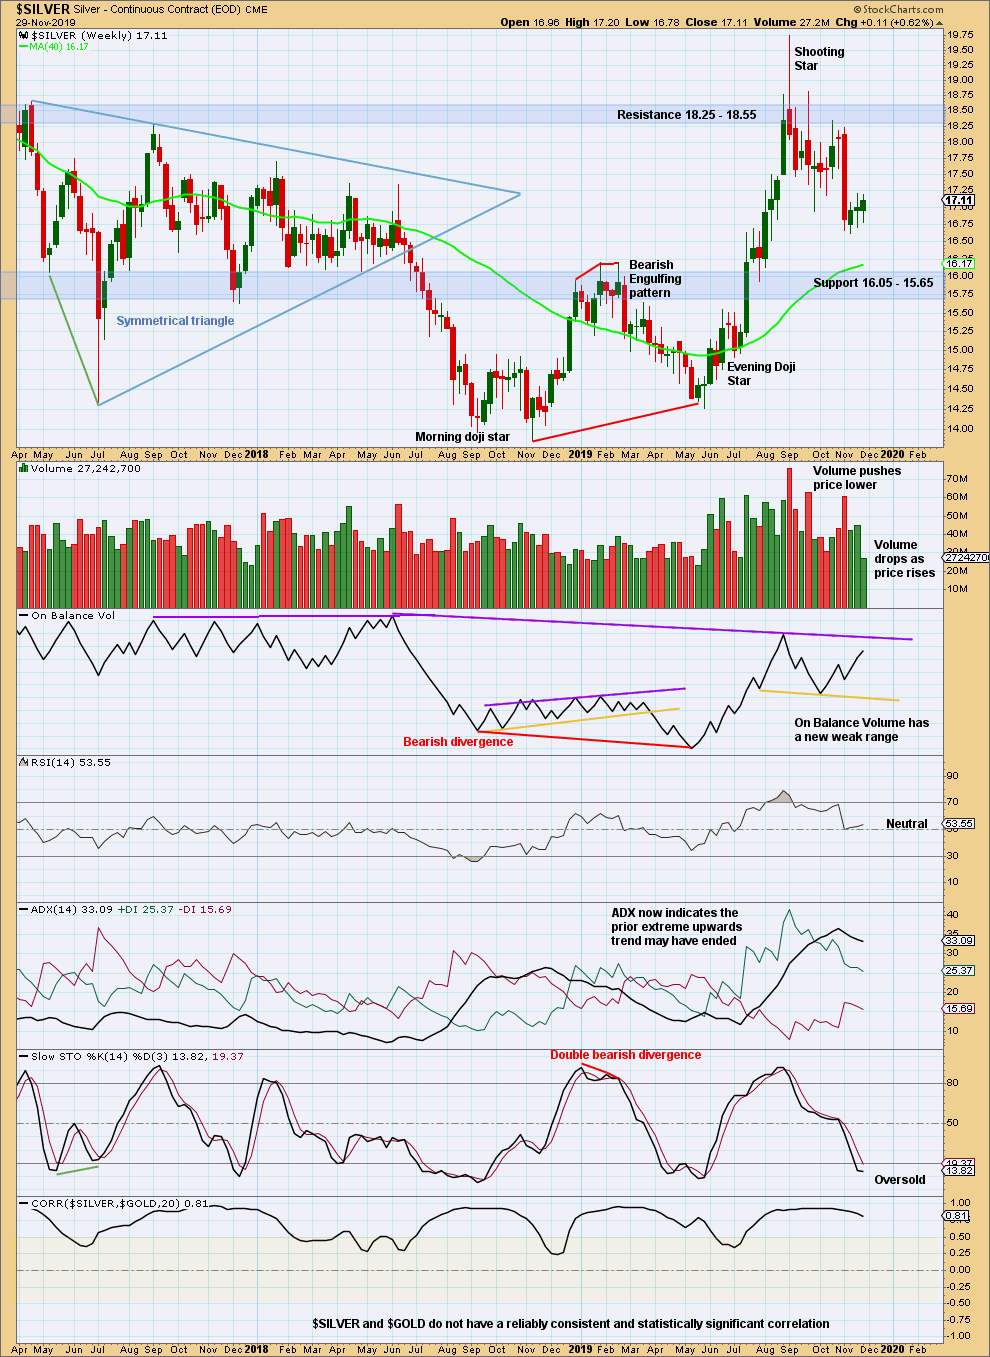
Silver is back within a strong area of resistance and support, identified by blue shaded areas.
There is bearish divergence for On Balance Volume between last major lows and last major highs. On Balance Volume has not confirmed new highs for Silver, but has made a lower high for the early September swing high.
The last three completed weeks look like a small pause within a developing downwards trend. With a strong decline this week from volume, it is possible the small bounce is complete.
DAILY CHART
Click chart to enlarge. Chart courtesy of StockCharts.com.
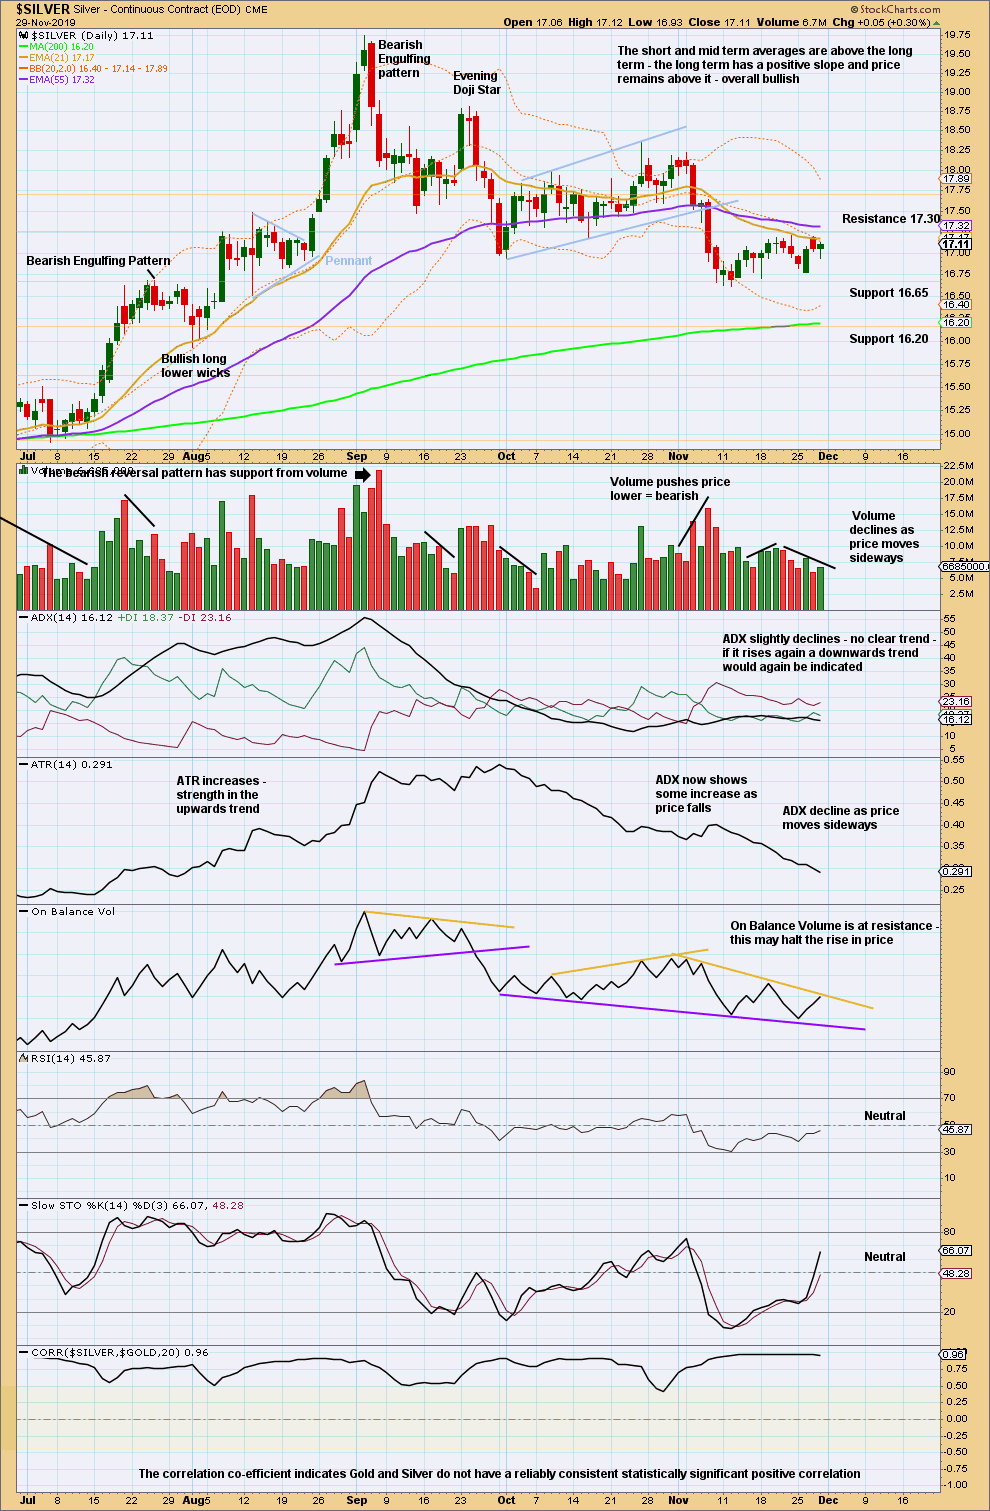
There is now a series of three lower swing lows and three lower swing highs from the major high on the 4th of September 2019. With some very strong downwards days within this movement, it does look like Silver has had a trend change and is developing a new downwards trend.
For the very short term, upwards days within last week had stronger volume than downwards days. A small counter trend bounce may be incomplete.
Published @ 07:30 p.m. EST on November 30, 2019.
—
Careful risk management protects your trading account(s).
Follow my two Golden Rules:
1. Always trade with stops.
2. Risk only 1-5% of equity on any one trade.
—
New updates to this analysis are in bold.
0 Comments