
Both bull and bear Elliott wave counts remain valid.
Summary: The bearish Elliott wave count expects a downwards trend has begun. The long-term target is at 74.47.
The bullish Elliott wave count expects a third wave up is beginning. The first target is at 138.62.
The price point which differentiates the two counts is 88.25. A new low below this point would invalidate the bullish count and provide confidence in the bearish count.
To the upside, a new high 99.66 would provide some confidence in the bullish count.
BEARISH ELLIOTT WAVE ANALYSIS
QUARTERLY CHART

Click chart to enlarge.
The wave count begins at 0.
This wave count assumes that the high labelled 0 ended a five wave impulse up. The Elliott wave structure of five steps forward should be followed by three steps back.
A huge double zigzag may be continuing lower.
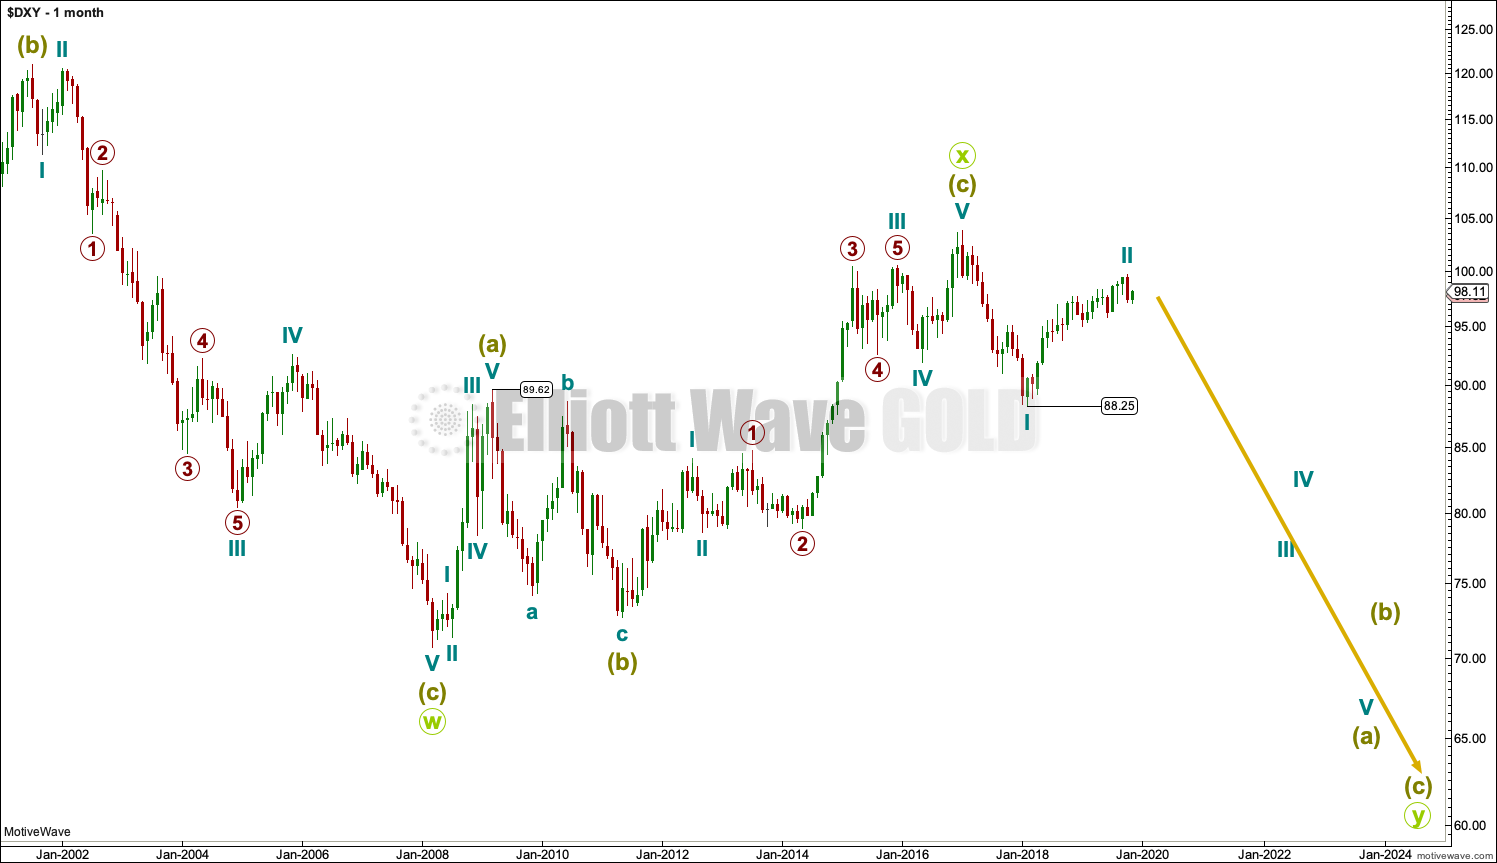
MONTHLY CHART
Click chart to enlarge.
Downwards movement from the high in January 2017 cannot be a fourth wave correction within an ongoing impulse higher because a new low below 89.62 would be back in first wave price territory.
That indicates the last big wave up may be a completed three, and for that reason this is my slightly preferred wave count.
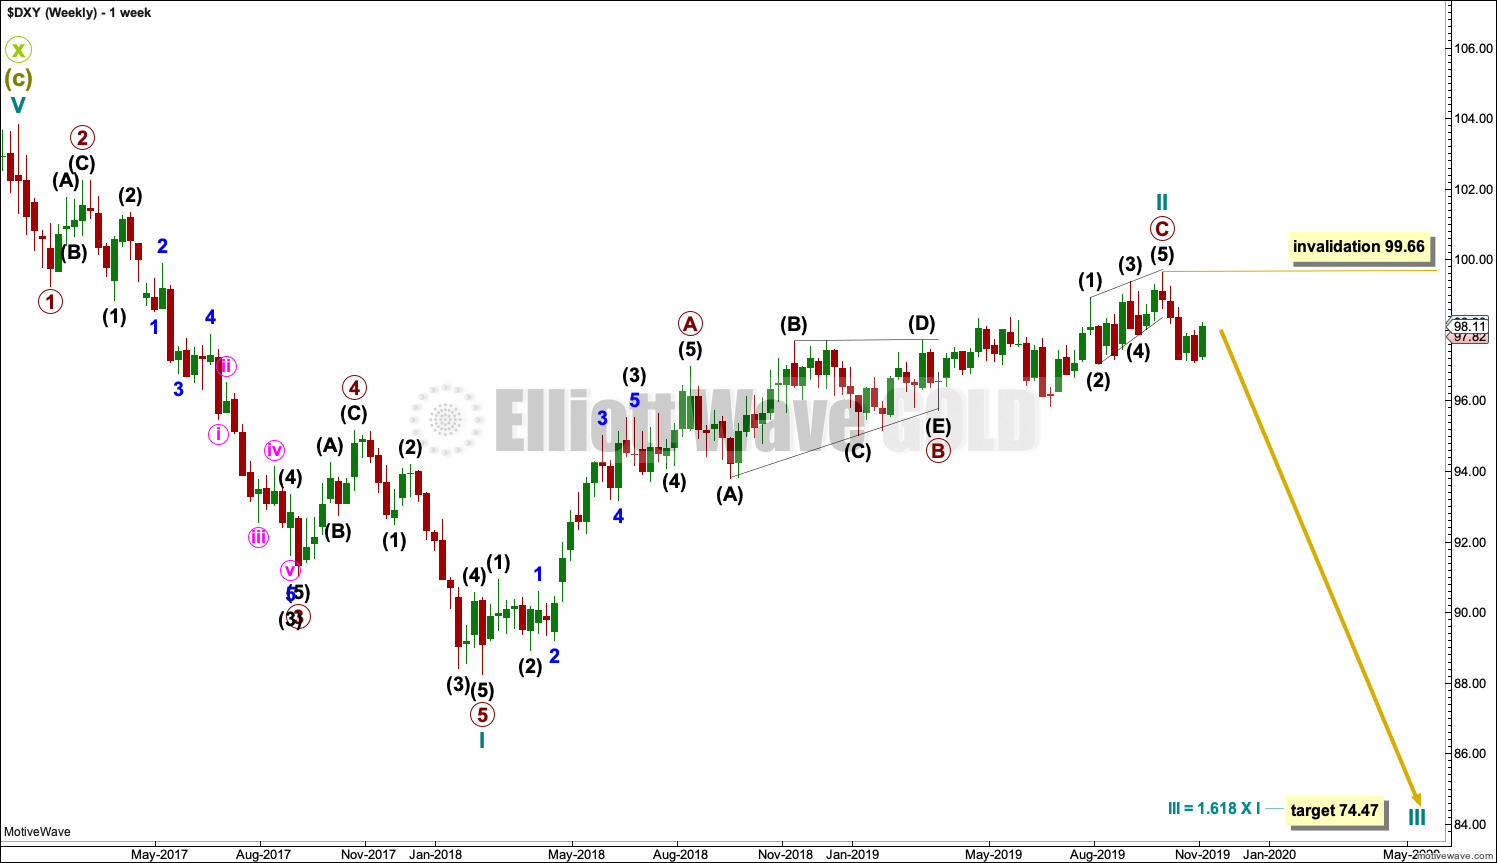
WEEKLY CHART
Click chart to enlarge.
Cycle wave I downwards fits very well as a five wave impulse. This may be reasonably expected to be followed by a three wave structure upwards.
For the USD Index, historically the first second wave correction within a new trend is usually extremely deep, about 0.80 to 0.90 of the first wave it corrects. In this instance, cycle wave II may be complete at 0.73 of cycle wave I.
Cycle wave II may be complete as a zigzag, which is the most common type of corrective structure.
Primary wave A may be a completed five wave impulse.
Primary wave B may be a completed running barrier triangle.
Primary wave C must subdivide as a five wave structure. It may be a complete ending contracting diagonal.
The target for cycle wave III expects a common Fibonacci ratio to cycle wave I. Within cycle wave III, no second wave correction may move beyond its start above 99.66.
BULLISH ELLIOTT WAVE ANALYSIS
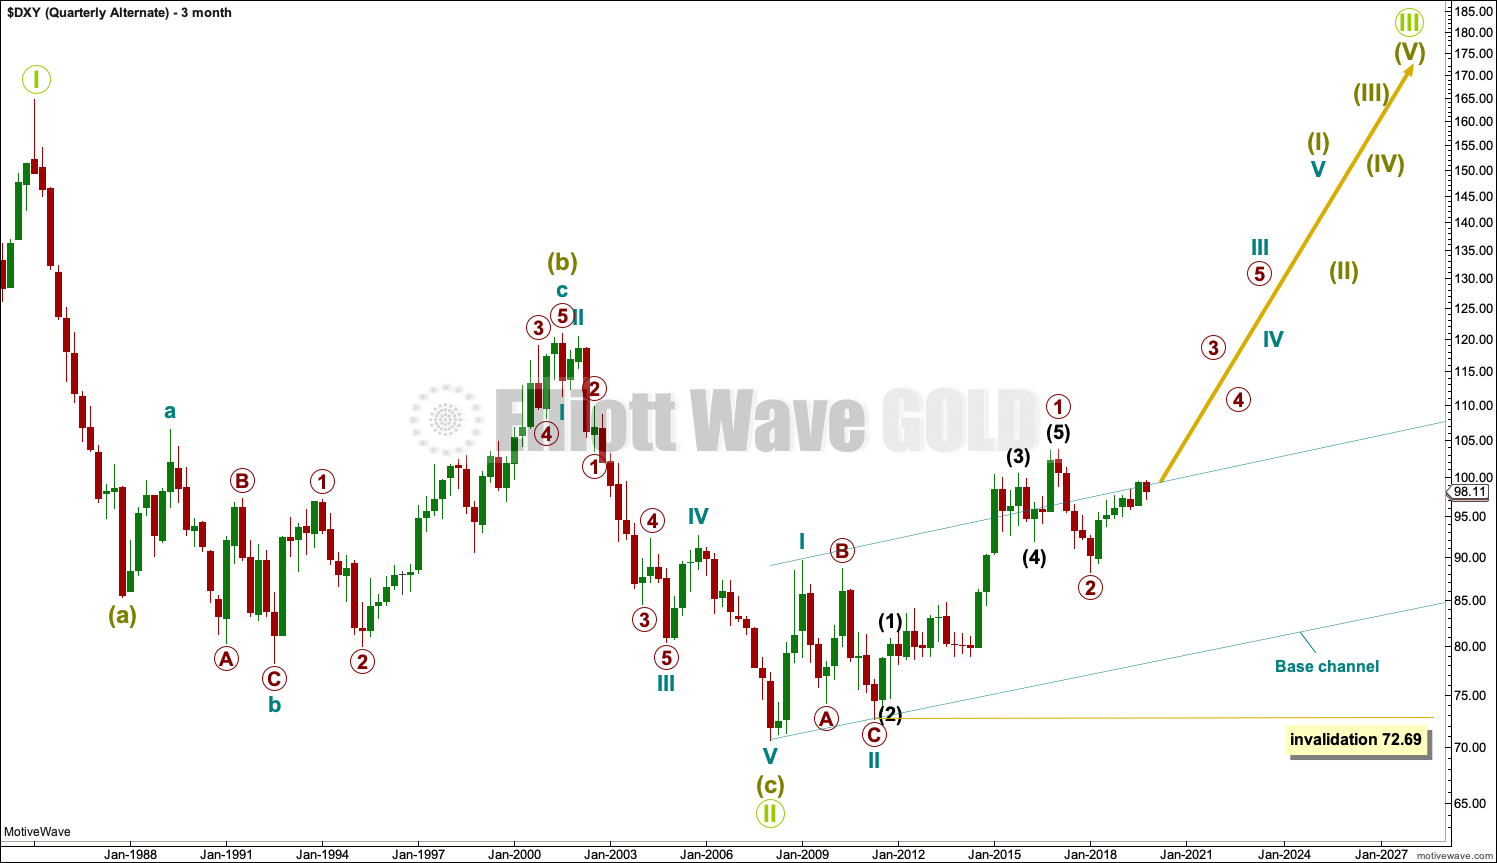
QUARTERLY CHART
Click chart to enlarge.
A single zigzag down to the last major low may still be complete.
A new upwards trend may continue. So far there may be two overlapping first and second waves. Primary wave 2 may not move beyond the start of primary wave 1 below 72.69.
Primary wave 2 should find strong support at the lower edge of the teal base channel if it gets down that low.
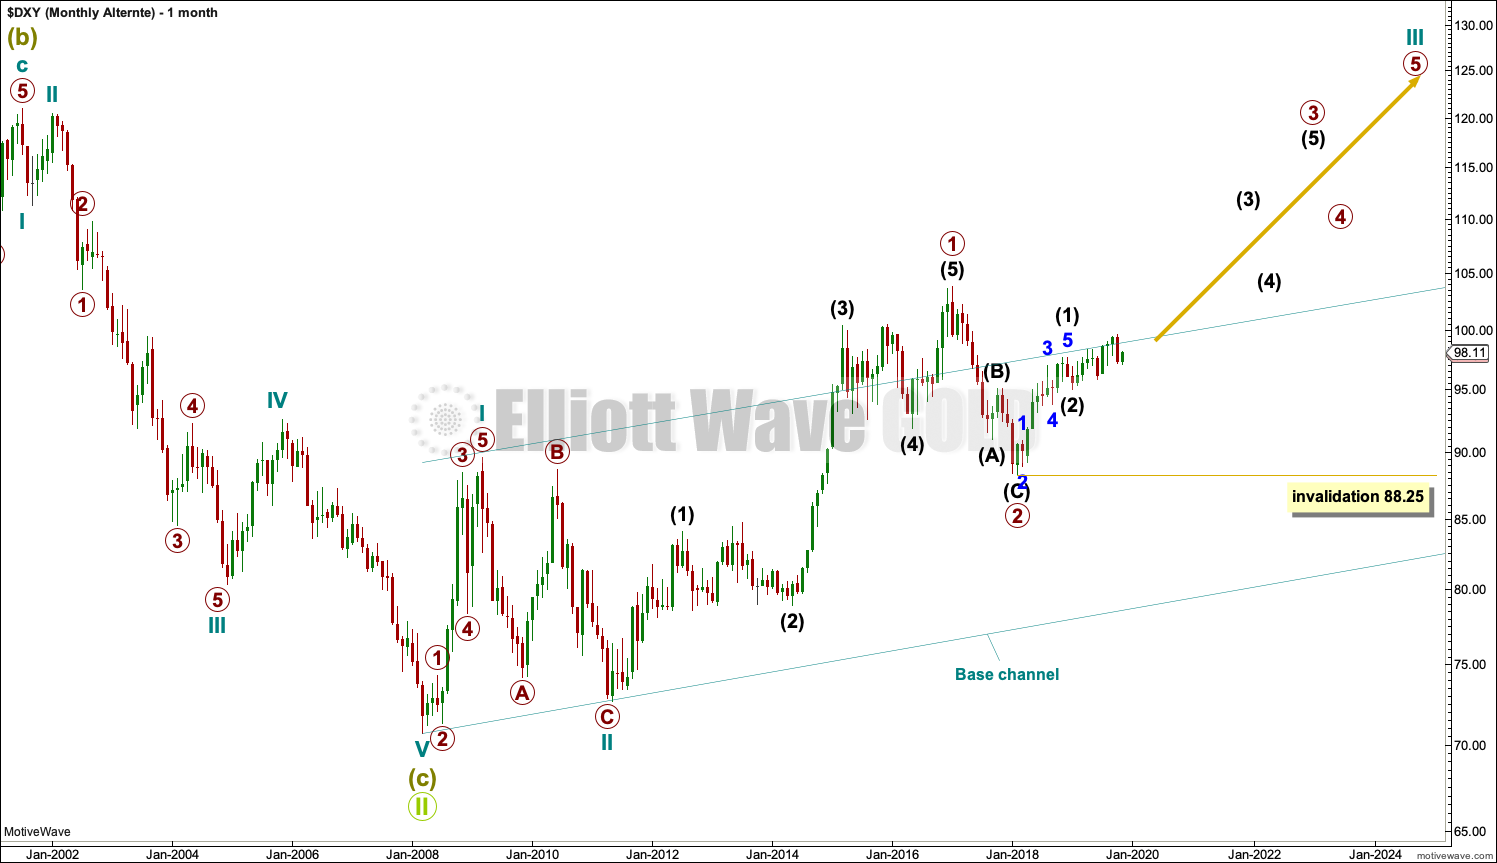
MONTHLY CHART
Click chart to enlarge.
Primary wave 2 may be a complete zigzag. However, this wave down can also be seen as a five and primary wave 2 may yet continue lower.
WEEKLY CHART
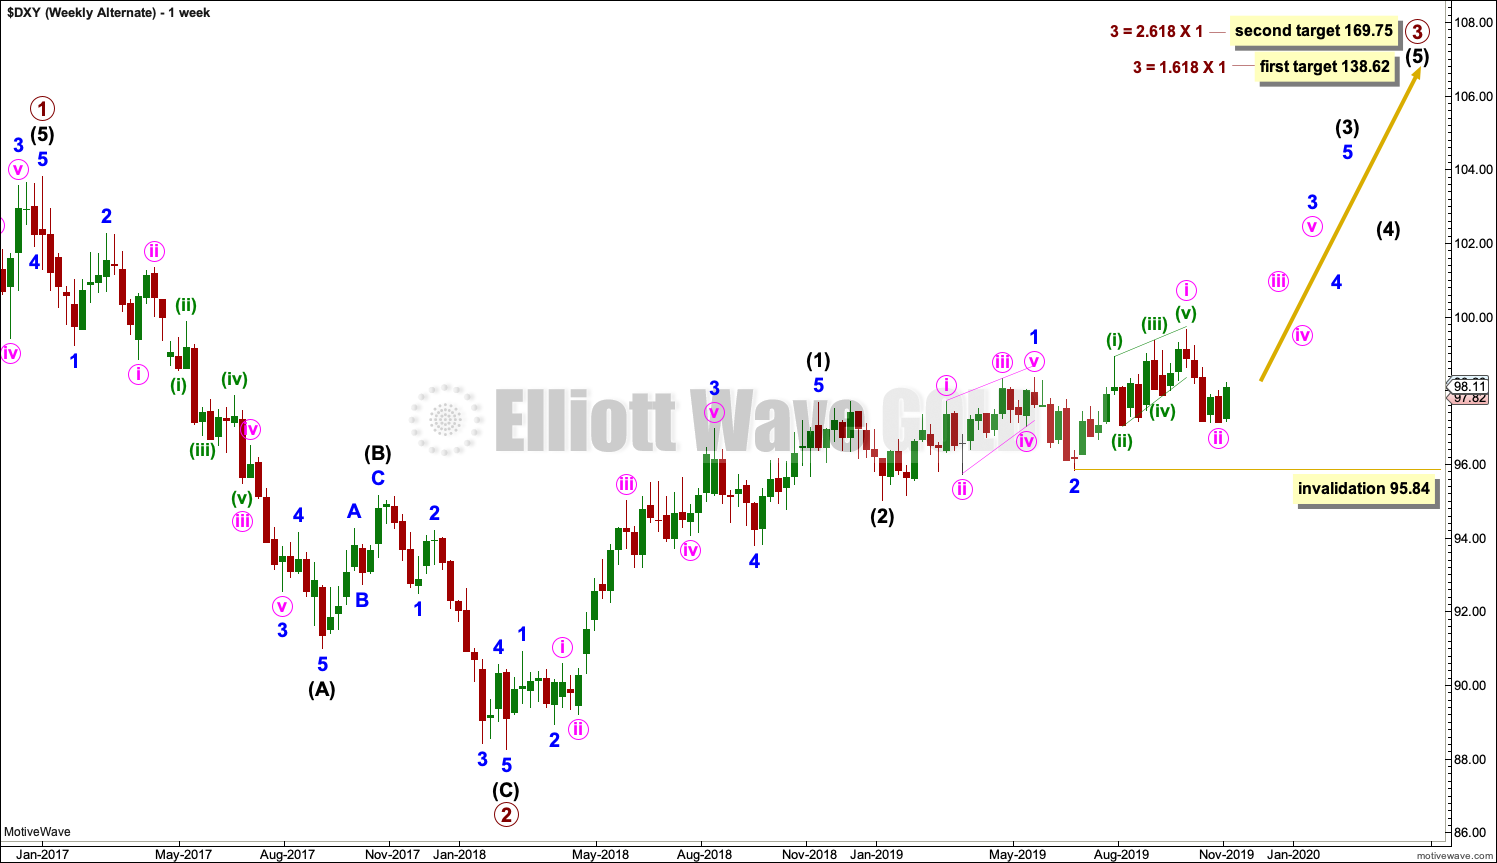
Click chart to enlarge.
This bullish wave count sees the last wave down as a completed zigzag.
All of minute wave iii, minor wave 3, intermediate wave (3) and primary wave 3 may only subdivide as impulses.
Within minor wave 3, minute wave ii may not move beyond the start of minute wave i below 95.84.
TECHNICAL ANALYSIS
MONTHLY CHART

Click chart to enlarge. Chart courtesy of StockCharts.com.
Declining ATR indicates some weakness in upwards movement.
WEEKLY CHART
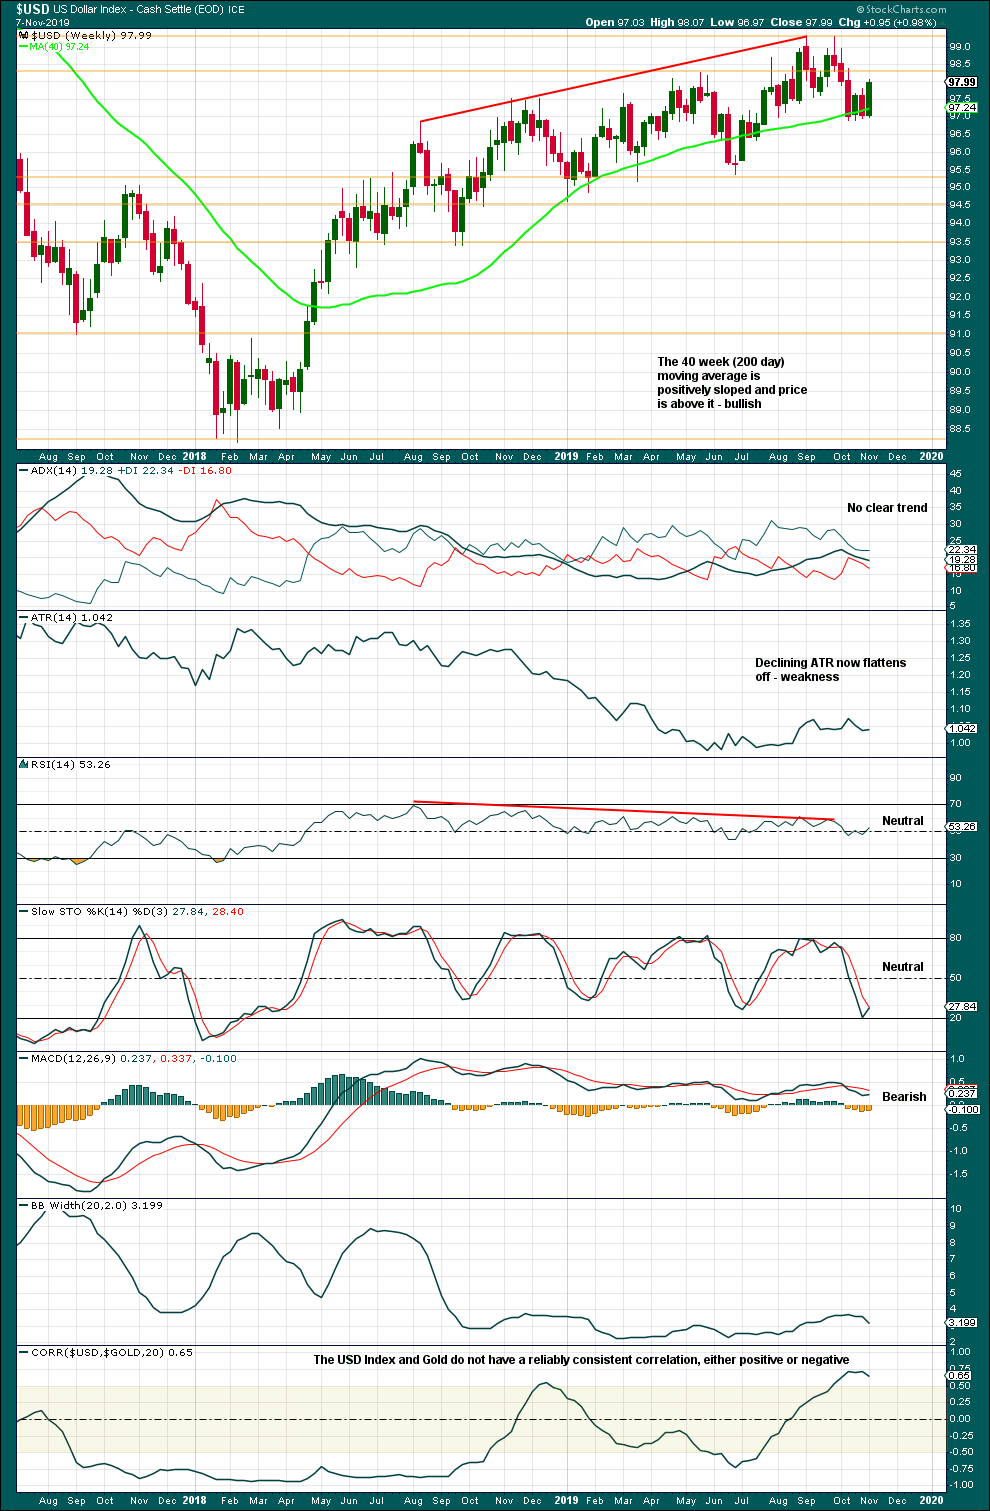
Click chart to enlarge. Chart courtesy of StockCharts.com.
There has been since February 2018 a series of swing highs and swing lows, the basic definition of an upwards trend. A new swing low below 95.36 is required for any confidence in a trend change.
Upwards movement shows weakness in declining and now flat ATR and longer-term reasonable bearish divergence between price and RSI.
Published @ 11:52 p.m. EST.
—
Careful risk management protects your trading account(s).
Follow my two Golden Rules:
1. Always trade with stops.
2. Risk only 1-5% of equity on any one trade.
—
New updates to this analysis are in bold.