
GOLD: Elliott Wave and Technical Analysis | Charts – December 16, 2019
Price continues sideways. There has as yet been no breakout. Today monthly charts are updated.
Summary: The downwards trend may resume to new lows. The Elliott wave target is at 1,348.
A target calculated from the triangle is about 1,431.
For the very short term, a new swing high above 1,514.29 would add some confidence in a more bullish outlook. The target would then be at 1,567, 1,635 or 1,693.
For the bigger picture, the bearish Elliott wave count expects a new downwards trend to last one to several years has begun. The alternate bearish wave count looks at the possibility that one final high to 1,559 is required first.
The bullish Elliott wave count expects a primary degree fourth wave has completed and the upwards trend has resumed.
Grand SuperCycle analysis is here.
BEARISH ELLIOTT WAVE COUNT
MONTHLY CHART
Click chart to enlarge.
Guidelines as to how long each wave should last based upon its degree should be approached with a great deal of flexibility. When waves extend, they do so in price and time leaving non-extended waves much more brief.
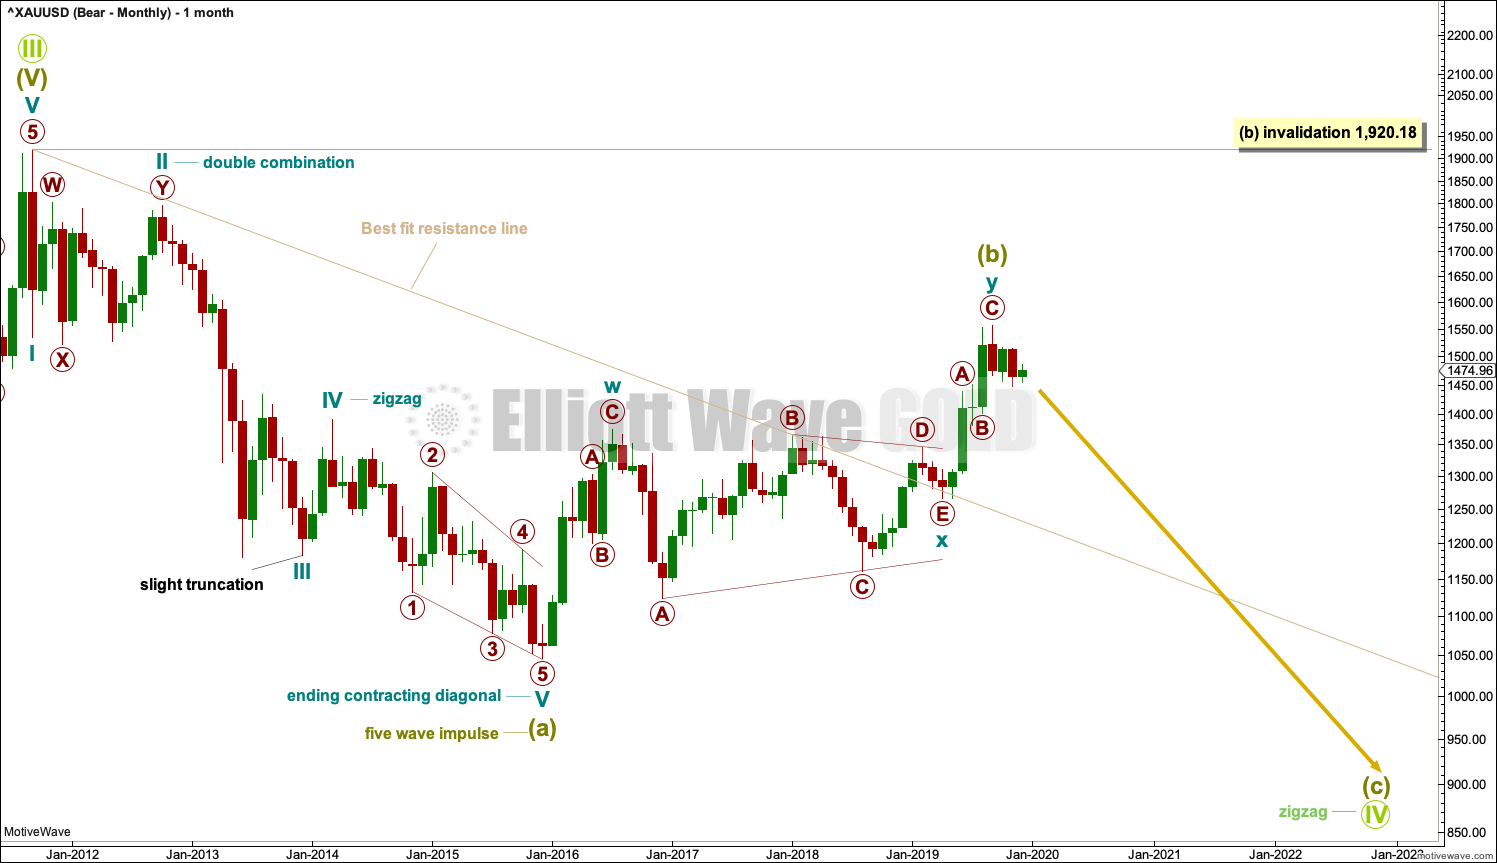
The main wave count will look at the large downwards wave from the all time high as a five wave impulse. For this main wave count, it will be labelled as Super Cycle wave (a), within a zigzag for Grand Super Cycle wave IV.
If Super Cycle wave (a) is a five, then Super Cycle wave (b) may not move beyond its start above 1,920.18.
Super Cycle wave (b) may or may not be complete. There are still two weekly charts below.
When Super Cycle wave (b) is complete, then Super Cycle wave (c) downwards should unfold. Super Cycle wave (c) would most likely reach about equality in length with Super Cycle wave (a). Super Cycle wave (c) should move below the end of Super Cycle wave (a) at 1,046.27 to avoid a truncation.
If this wave count unfolds as expected, then a huge zigzag downwards would complete a bear market for Grand Super Cycle wave IV. A new bull market may develop from there.
WEEKLY CHART
Click chart to enlarge.
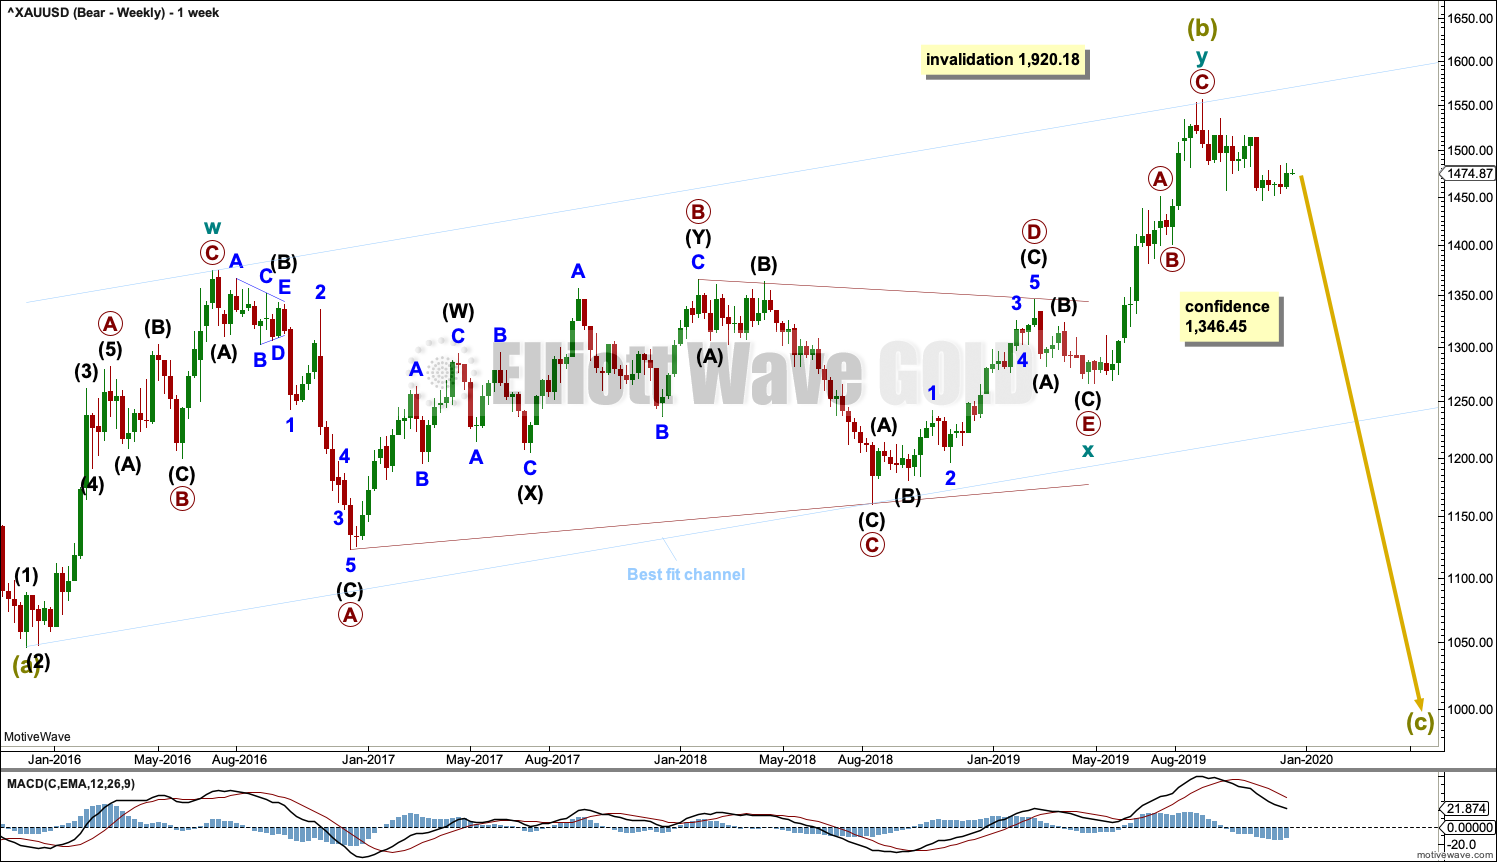
It is possible that Super Cycle wave (b) is complete as a double zigzag.
The first zigzag in the double is labelled cycle wave w. The double is joined by a three in the opposite direction, a triangle labelled cycle wave x. The second zigzag in the double is labelled cycle wave y.
The purpose of the second zigzag in a double is to deepen the correction. Cycle wave y has achieved this purpose.
A new low below 1,346.45 would add strong confidence to this wave count. At that stage, the bullish Elliott wave count would be invalidated. At that stage, targets for Super Cycle wave (c) would be calculated.
A wide best fit channel is added in light blue. This channel contains all of Super Cycle wave (b) and may provide resistance and support. Copy this channel over to daily charts. Along the way down, the lower edge of the channel may provide support and in turn initiate a bounce.
Super Cycle wave (c) must subdivide as a five wave structure, most likely an impulse. It may last several years. It would be very likely to make new lows below the end of Super Cycle wave (a) at 1,046.27 to avoid a truncation.
DAILY CHART
Click chart to enlarge.
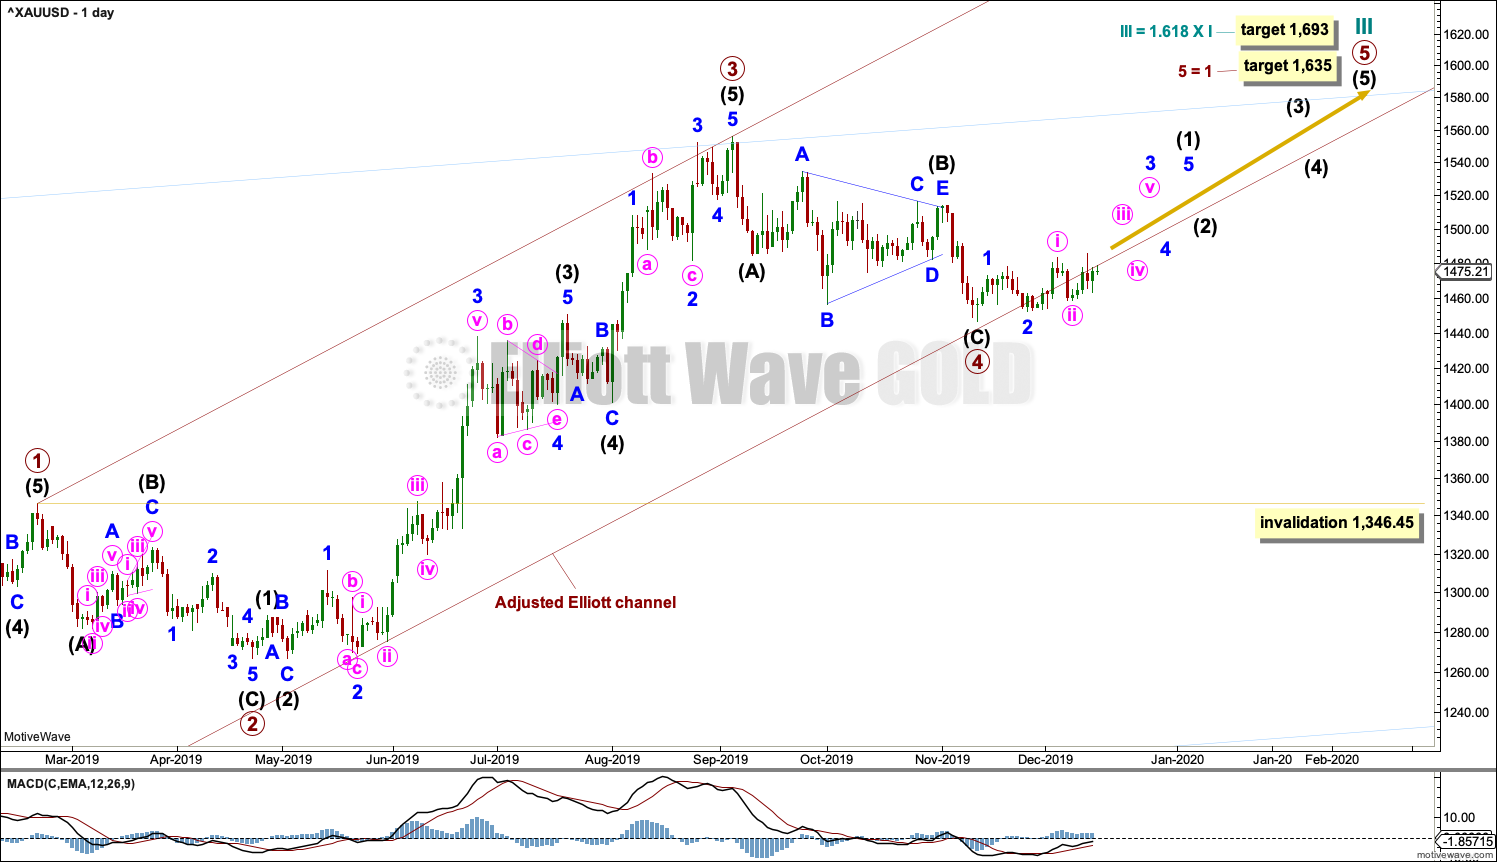
Classic analysis now reasonably supports this wave count.
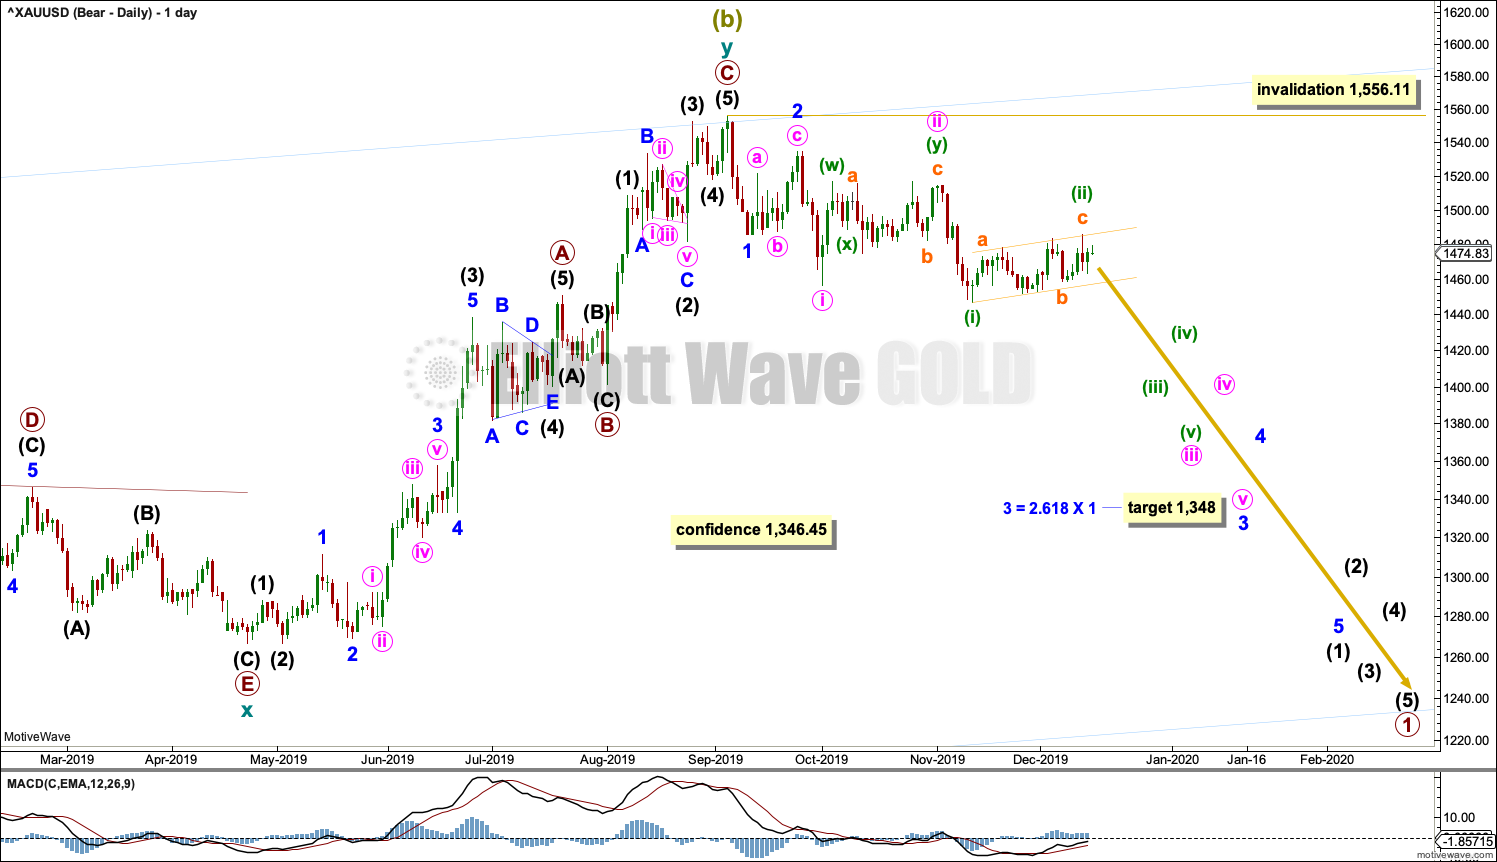
Cycle wave y may be a complete zigzag. Within both of primary waves A and C, there is good proportion between intermediate waves (2) and (4). Within both of primary waves A and C, there is good alternation in structure of intermediate waves (2) and (4).
Within cycle wave y, there is no Fibonacci Ratio between primary waves A and C.
If there has been a trend change at Super Cycle degree, then a five down needs to develop on the daily and weekly charts. So far that is incomplete. It will be labelled intermediate wave (1).
Typically, Gold begins new trends slowly with overlapping first and second waves, and then momentum builds through the middle of the third wave and may explode at the end of third waves. So far this overlapping movement from the last high in September looks typical for this market.
Draw an Elliott channel about minuette waves (i) and (ii). Draw the first trend line from the start of subminuette wave a to the end of subminuette wave b, then place a parallel copy on the end of subminuette wave a. When this channel is breached by downwards movement, then that shall provide indication that a third wave down is underway. Expect any bounces to find resistance at the upper edge while price remains within the channel.
HOURLY CHART
Click chart to enlarge.
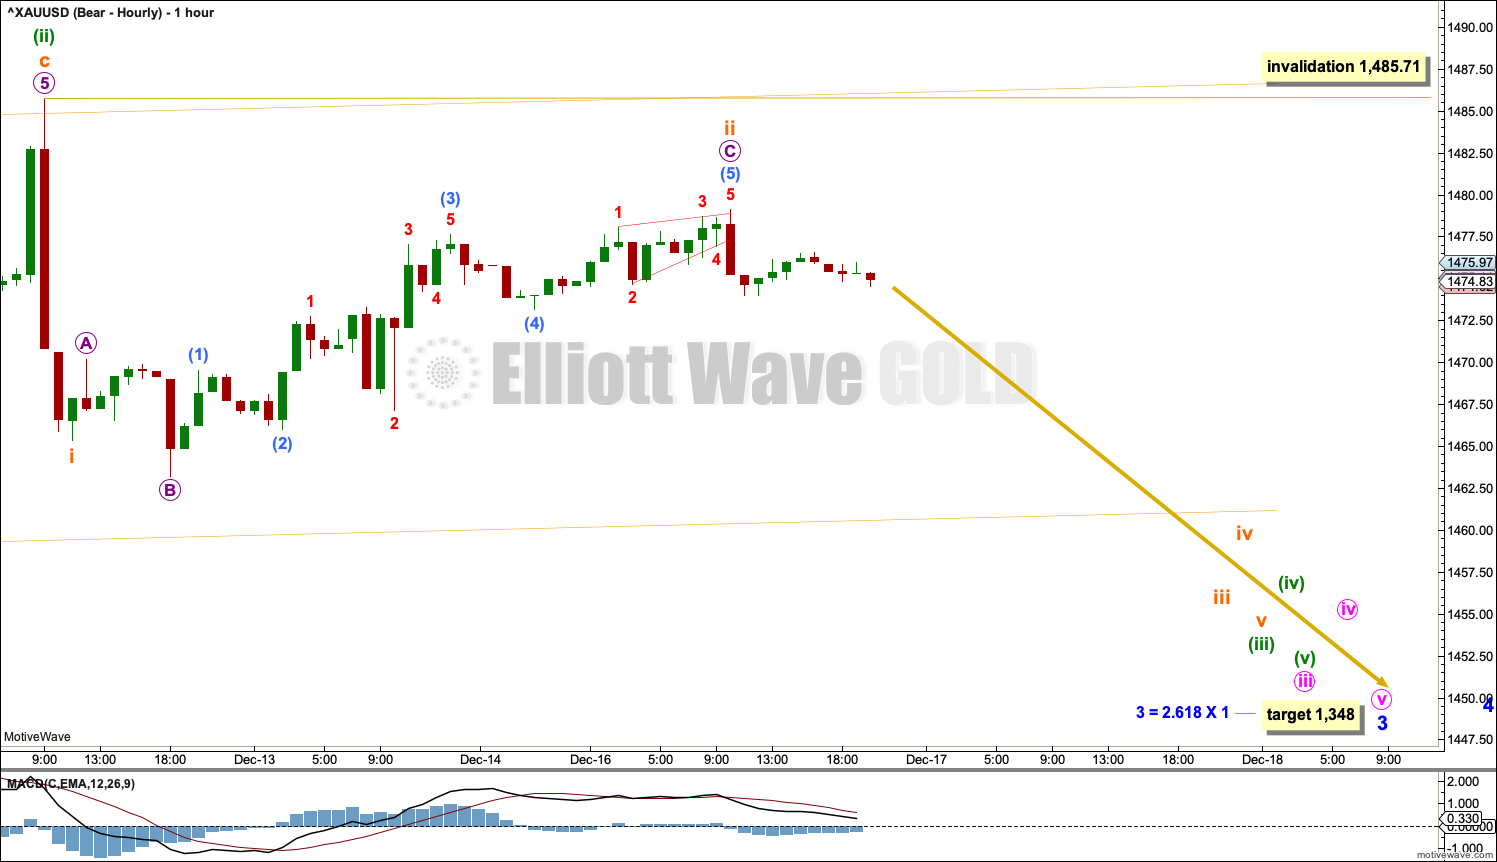
This hourly chart begins at the high labelled minuette wave (ii), which may be seen on the daily chart. There may now be a series of four overlapping first and second waves complete. This wave count expects a downwards breakout when the middle of the third wave at four degrees arrives.
When the narrow orange channel about minuette wave (ii) is breached by downwards movement, that may be taken as an indication that a third wave at multiple degrees has begun. Expect downwards momentum to then increase.
Subminuette wave ii may not move beyond the start of subminuette wave i above 1,485.71.
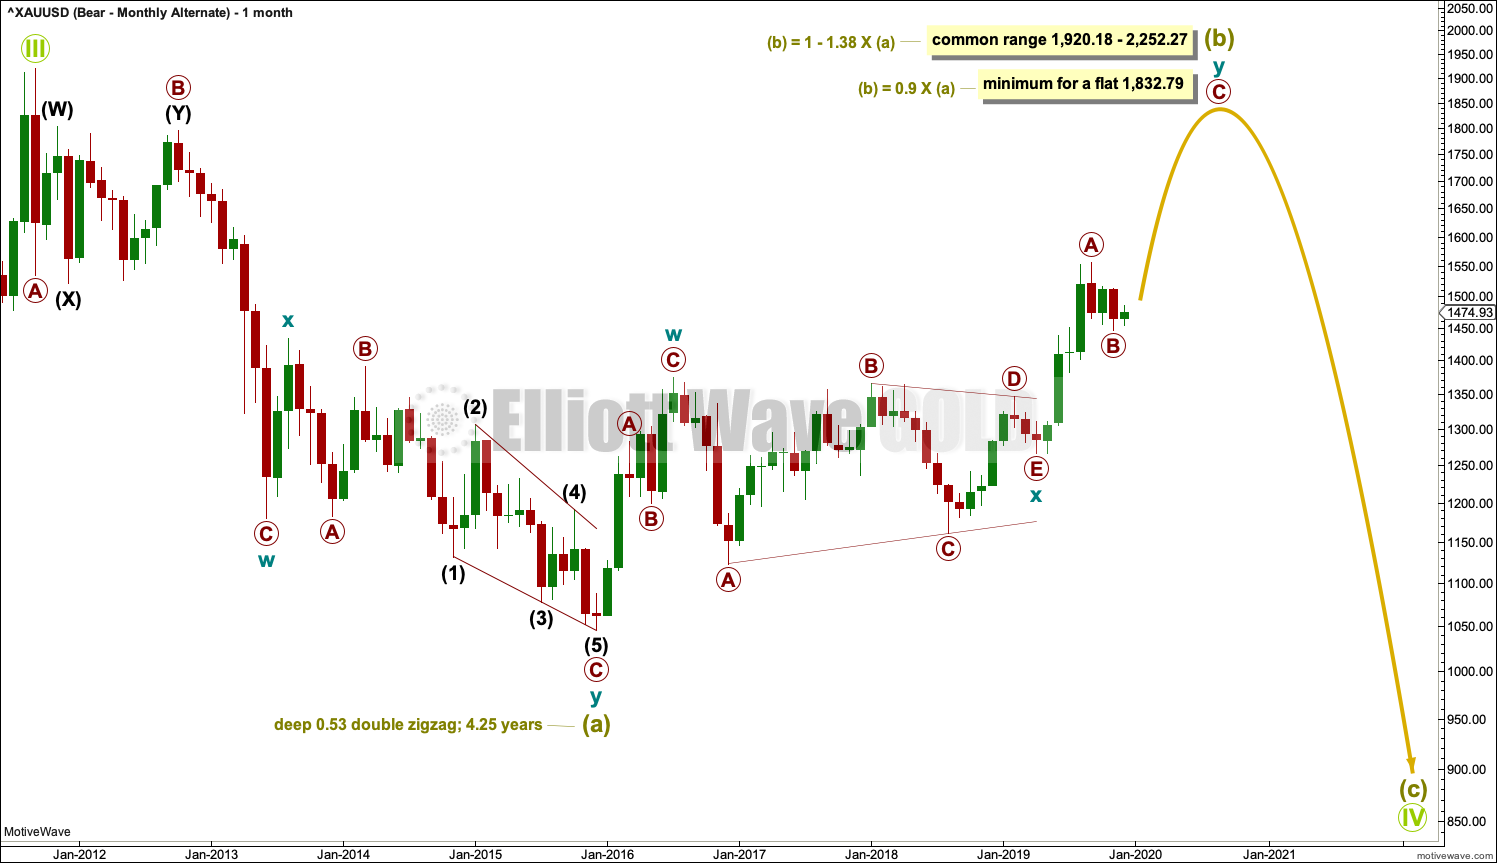
ALTERNATE MONTHLY CHART
Click chart to enlarge.
The large wave down from September 2011 to November 2015 may also be seen as a three wave structure, a double zigzag.
If the big wave down is a multiple three wave structure, then Grand Super Cycle wave (IV) may be either a flat or triangle. It may not be a combination because they may not have multiples within any one of W, Y or Z.
If Grand Super Cycle wave (IV) is a flat correction, then within it Super Cycle wave (b) must retrace a minimum 0.9 length of Super Cycle wave (a) at 1,832.79.
If Grand Super Cycle wave (IV) is a triangle, then there is no minimum requirement for Super Cycle wave (b). There is only the structural requirement that it should be a three wave structure. Super Cycle wave (b) would need to move higher for a triangle to have the right look. If Grand Super Cycle wave (IV) is a triangle, then one of either Super Cycle wave (a) or (b) must subdivide as a single zigzag; there may not be two multiples within a triangle.
At this stage, it looks like Super Cycle wave (b) for this wave count may be an unfolding double zigzag. A double zigzag for Super Cycle wave (b) may see cycle wave y reach up to the minimum requirement at 1,832.79 for a flat correction, for the structure one degree higher at Grand Super Cycle degree.
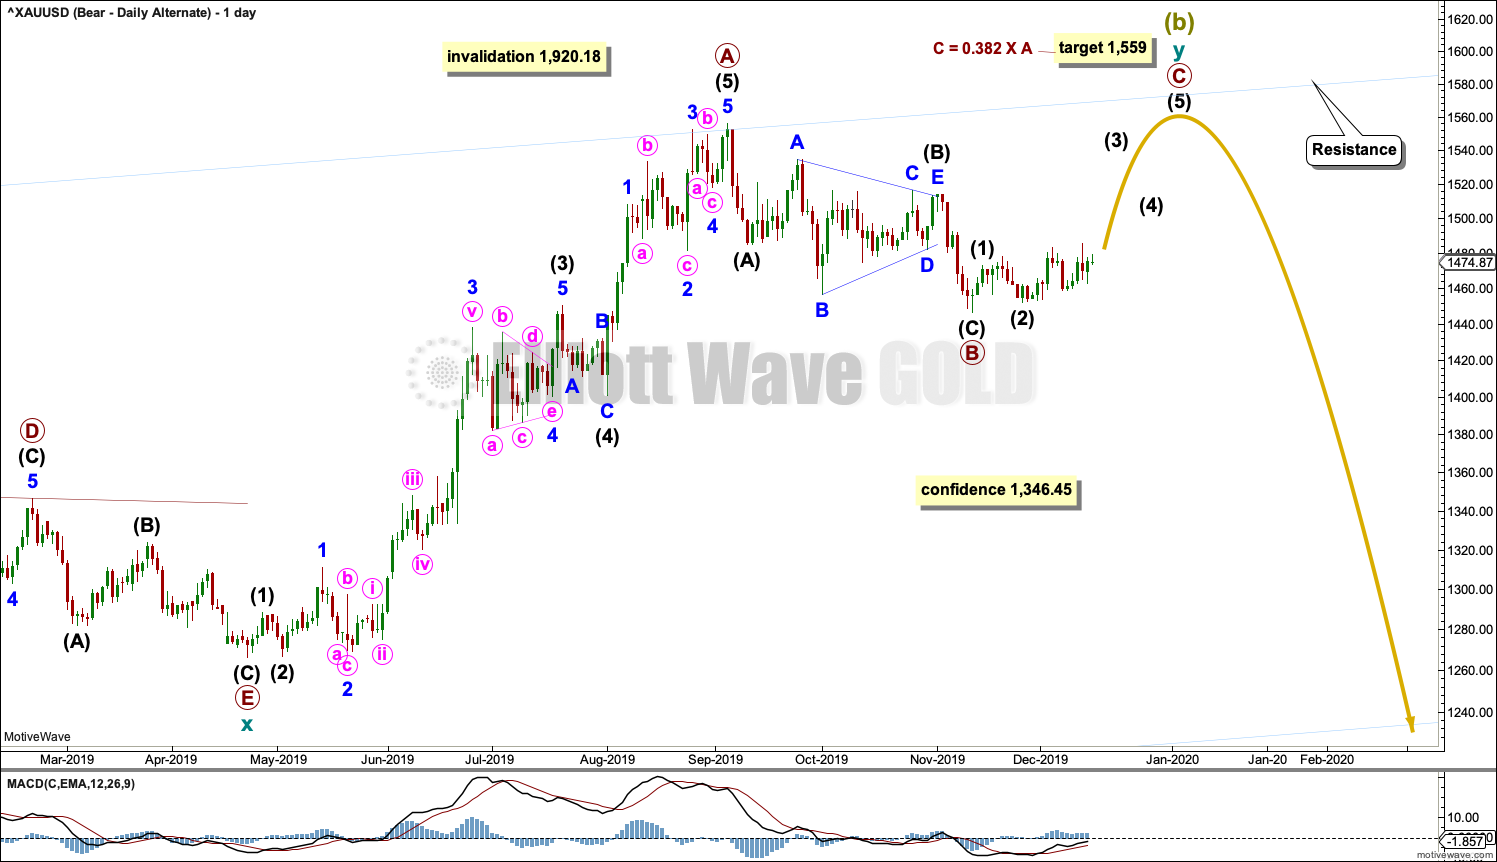
ALTERNATE DAILY CHART
Click chart to enlarge.
It is possible that the double zigzag for Super Cycle wave (b) may be incomplete and may yet require one more high.
Within cycle wave y, primary wave A may have been over at the last high.
Primary wave B may be complete as a single zigzag. Within the zigzag, intermediate wave (C) is just 3.56 short of equality in length with intermediate wave (A). Intermediate wave (B) is a running contracting triangle.
It is possible for this wave count that primary wave B could continue lower as a double zigzag. Primary wave B may not move beyond the start of primary wave A below 1,266.61.
A new low now below 1,446.68 would see primary wave B relabelled as a double zigzag, continuing lower.
Primary wave C would be expected to find strong resistance and end at the upper edge of the blue best fit channel copied over from the weekly chart.
BULLISH ELLIOTT WAVE COUNT
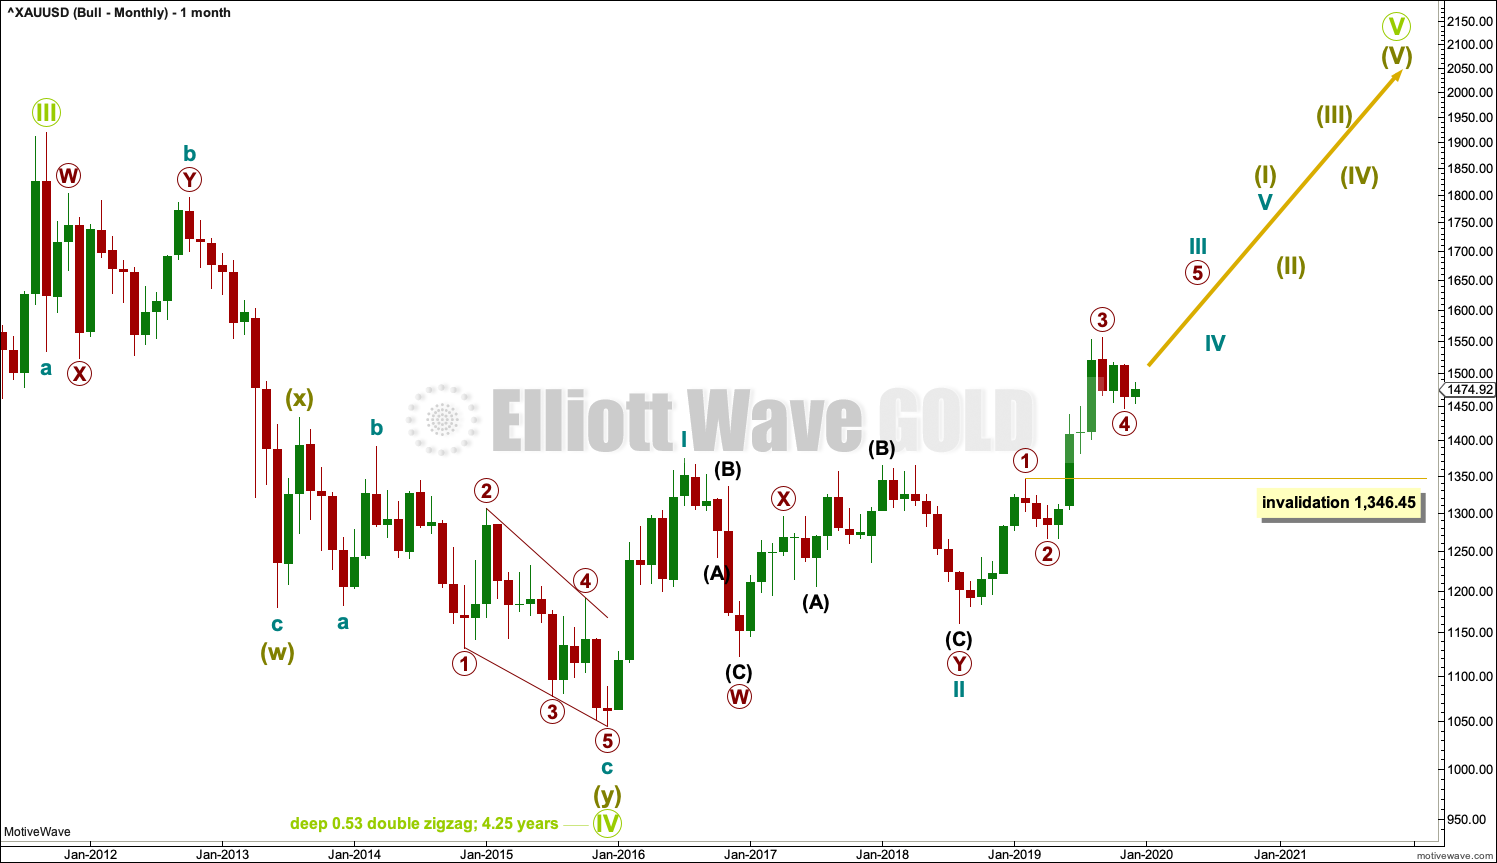
MONTHLY CHART
Click chart to enlarge.
By simply moving the degree of labelling within the last huge wave down all up one degree, it is possible to see that Grand Super Cycle wave IV could be over. It would be rather brief though at only 4.25 years. However, Grand Super Cycle wave II in the Grand Super Cycle analysis is expected to have lasted only about 8 years, so this possibility should be accepted.
If there has been a trend change at Grand Super Cycle degree in the end of November 2015, then a new five wave structure upwards should develop from there at the monthly chart level.
Gold will often form long slow basing movements. Its first waves can be short and its second waves long lasting and deep.
Cycle wave I may have been complete and relatively short and brief at only 7 months duration.
Cycle wave II may now be a complete double combination. Cycle wave III may be underway and may now have passed its middle. Within the impulse of cycle wave III, primary wave 4 may not move into primary wave 1 price territory below 1,346.45. This bullish wave count would be invalidated at all time frames with a new low below this point by any amount at any time frame.
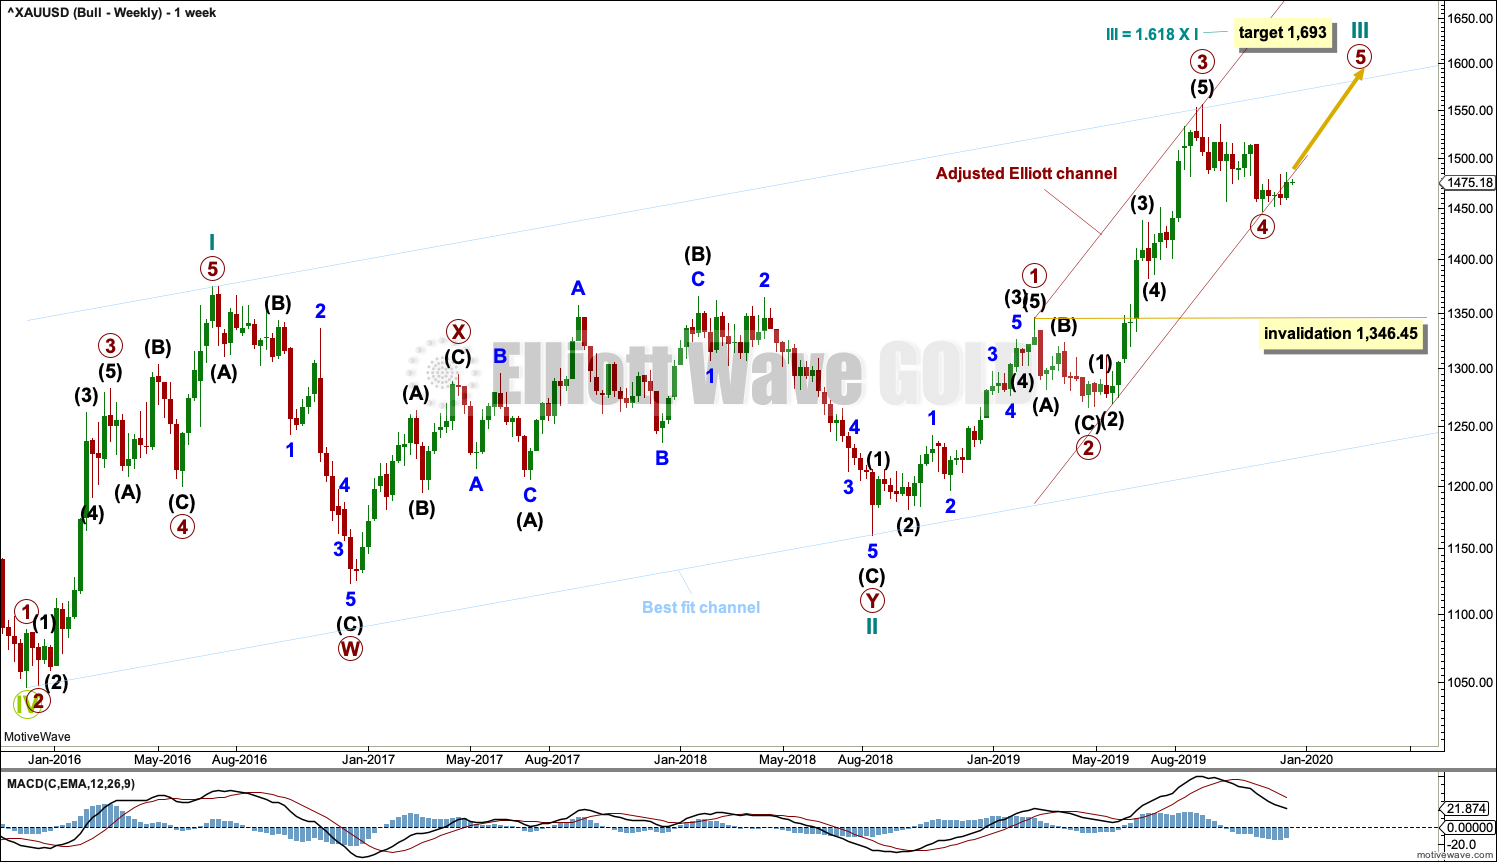
WEEKLY CHART
Click chart to enlarge.
This wave count sees the the bear market complete at the last major low for Gold in November 2015.
If Gold is in a new bull market, then it should begin with a five wave structure upwards on the weekly chart. However, the biggest problem with this wave count is the structure labelled cycle wave I because this wave count must see it as a five wave structure, but it looks more like a three wave structure.
Commodities often exhibit swift strong fifth waves that force the fourth wave corrections coming just prior and just after to be more brief and shallow than their counterpart second waves. It is unusual for a commodity to exhibit a quick second wave and a more time consuming fourth wave, and this is how cycle wave I is labelled. This wave count still suffers from this very substantial problem, which is one reason why the bearish wave count is preferred because it has a better fit in terms of Elliott wave structure.
Cycle wave II subdivides well as a double combination: zigzag – X – expanded flat.
Cycle wave III may have begun. Within cycle wave III, primary waves 1 and 2 may now be complete. Primary wave 3 has now moved above the end of primary wave 1 meeting a core Elliott wave rule. It has now moved far enough to allow room for primary wave 4 to unfold and remain above primary wave 1 price territory. Primary wave 4 may not move into primary wave 1 price territory below 1,346.45.
Cycle wave III so far for this wave count would have been underway now for 70 weeks. It exhibits some support from volume and increasing ATR. This wave count has some support from classic technical analysis.
The channel drawn about cycle wave III is an adjusted Elliott channel. The lower edge is pulled lower.
Add the wide best fit channel to weekly and daily charts.
DAILY CHART
Click chart to enlarge.
Primary wave 4 may be complete as a single zigzag. Primary wave 4 may have lasted 49 sessions, just six more than primary wave 2, which lasted 43 sessions. The proportion remains very good for this part of the wave count.
A target for cycle wave III is calculated also now at primary degree. If price reaches the first target and keeps rising, then the second higher target may be used.
If it continues any further, then primary wave 4 may not move into primary wave 1 price territory below 1,346.45.
If primary wave 4 is a single zigzag, then there is no alternation in structure with the single zigzag of primary wave 2. There is some alternation within the structures: primary wave 2 as a zigzag has intermediate wave (B) as a zigzag, while intermediate wave (B) within the zigzag of primary wave 4 is a triangle. Primary wave 2 is shallow at 0.43 the length of primary wave 1, and primary wave 4 is close to the same at 0.38 the length of primary wave 3. There is inadequate alternation in depth.
HOURLY CHART
Click chart to enlarge.
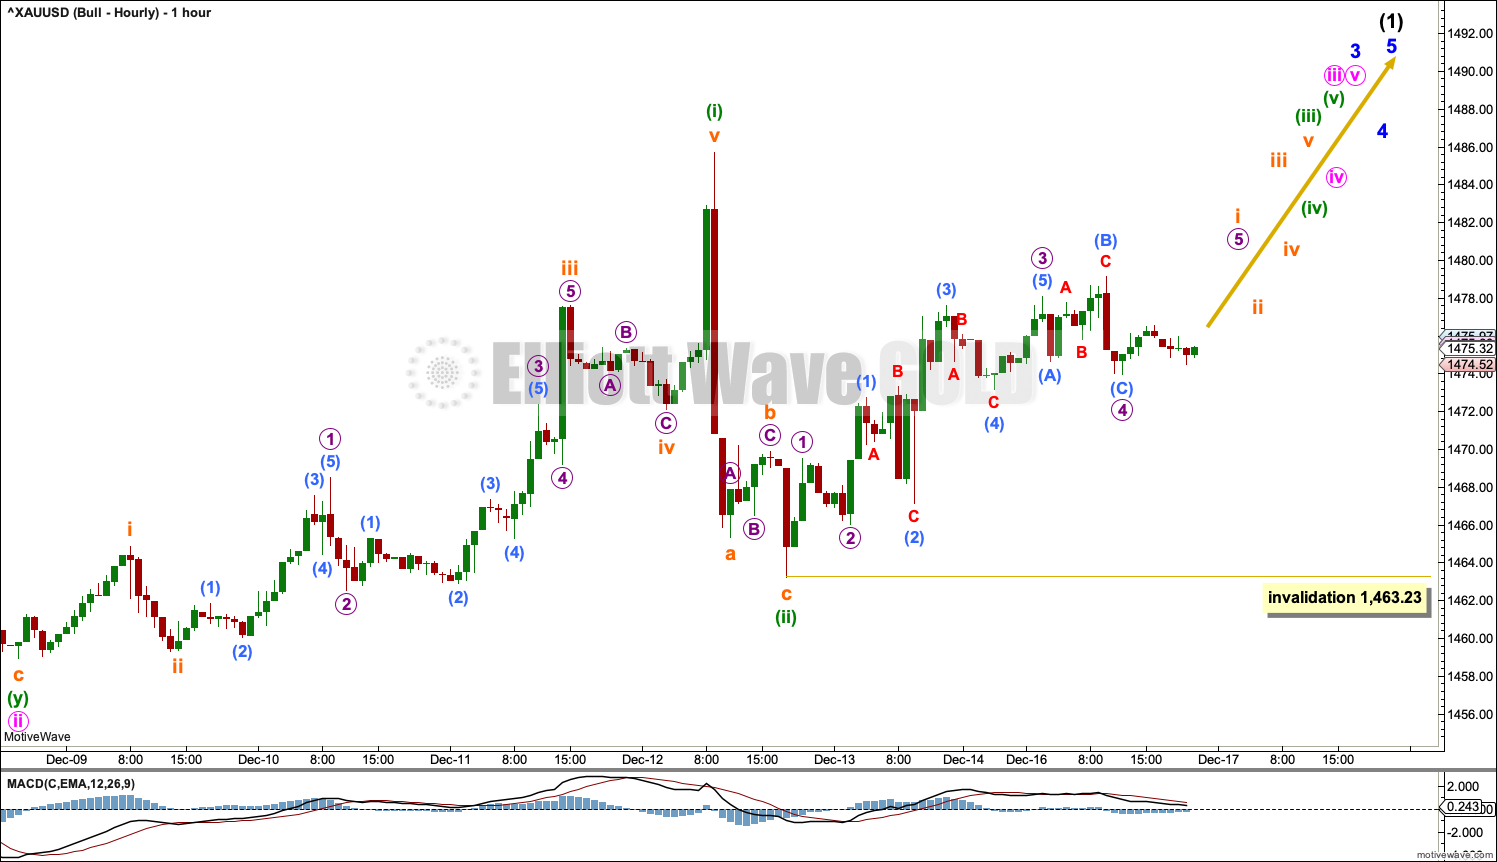
This hourly chart now focuses on movement from the end movement from the low of minute wave ii, which is now labelled on the daily chart.
Within intermediate wave (1) of primary wave 5, there may now be four completed overlapping first and second waves. This wave count expects an upwards breakout when the middle of a third wave arrives, which should have support from volume and should exhibit increased momentum.
When subminuette wave i is complete, then subminuette wave ii may not move beyond the start of subminuette wave i below 1,463.23.
TECHNICAL ANALYSIS
MONTHLY CHART
Click chart to enlarge. Chart courtesy of StockCharts.com.
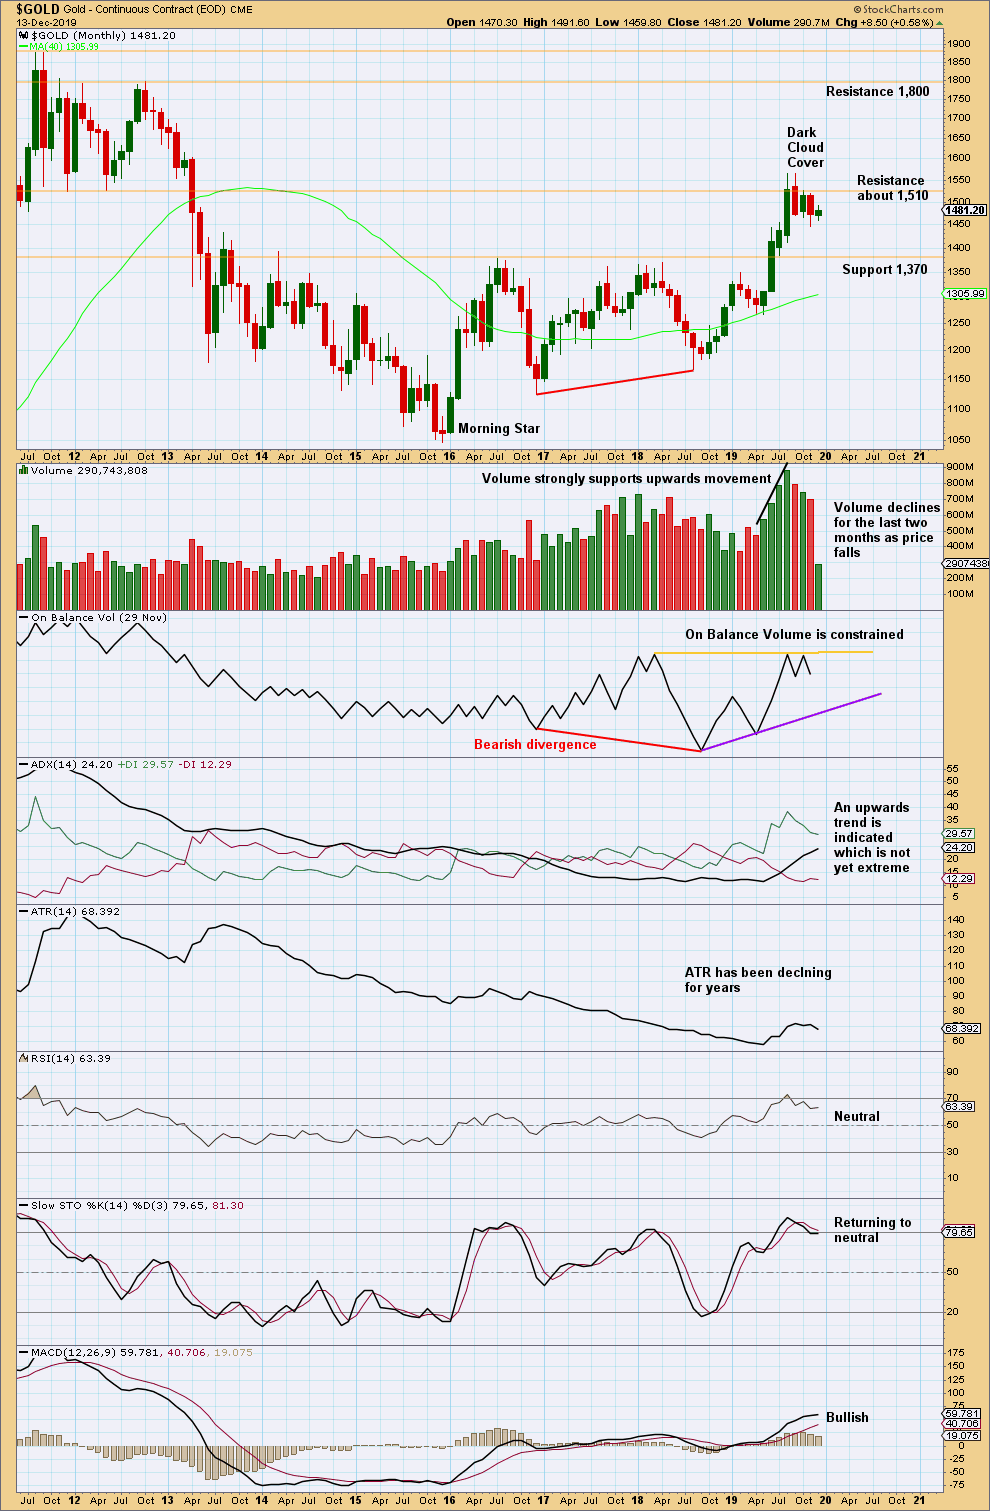
Overall, this chart is bullish. However, with RSI reaching overbought at the last high, upwards movement may be limited.
The last two months of sideways movement look like a consolidation within an ongoing upwards trend.
Some suspicion regarding the current upwards trend may be warranted by bearish divergence between price and On Balance Volume at the last lows. Also, at the last high price has made a substantial new high above April 2018, but On Balance Volume is flat.
November completes with downwards movement that does not have support from volume. The market has fallen of its own weight.
The all time high for Gold in September 2011 is on the upper left hand side of this chart. Notice upwards movement ended with strong support from volume and early downwards months exhibited volume which was weaker. Strong volume is not required at the beginning of a bearish movement for Gold for it to be sustainable.
WEEKLY CHART
Click chart to enlarge. Chart courtesy of StockCharts.com.
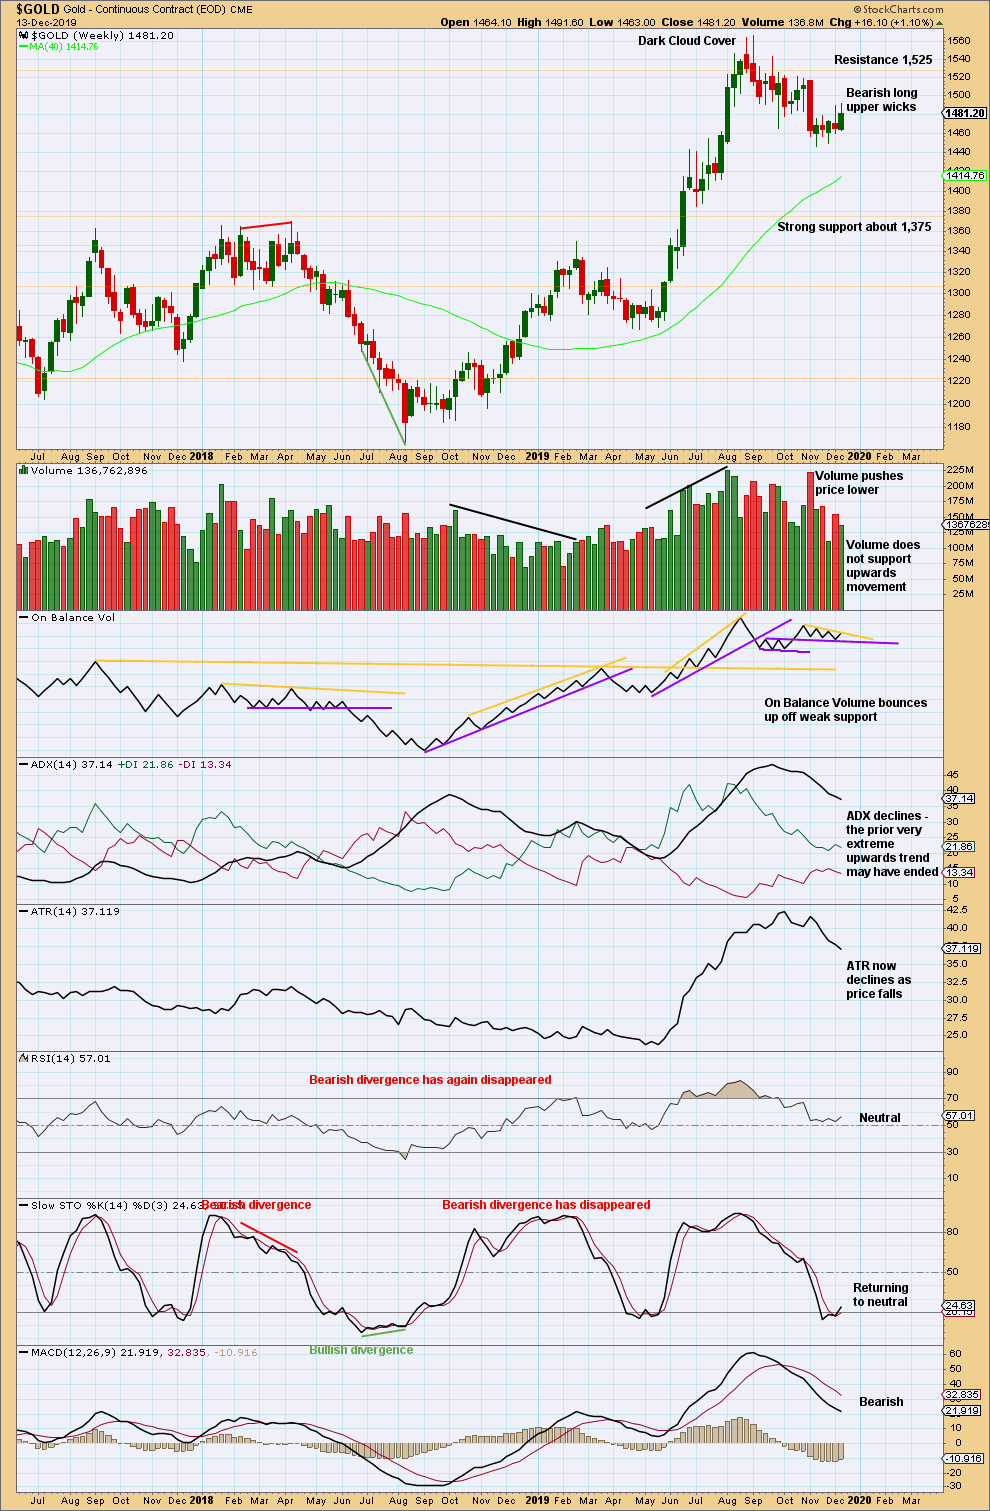
When trends reach very extreme, candlestick reversal patterns should be given weight. The Dark Cloud Cover bearish reversal pattern is given more bearish weight from the long upper wick.
A very strong downwards week with strong support from volume six weeks ago supports a bearish view.
Last week moved price higher with weak volume. On Balance Volume is at resistance. Upwards movement may be limited here.
DAILY CHART
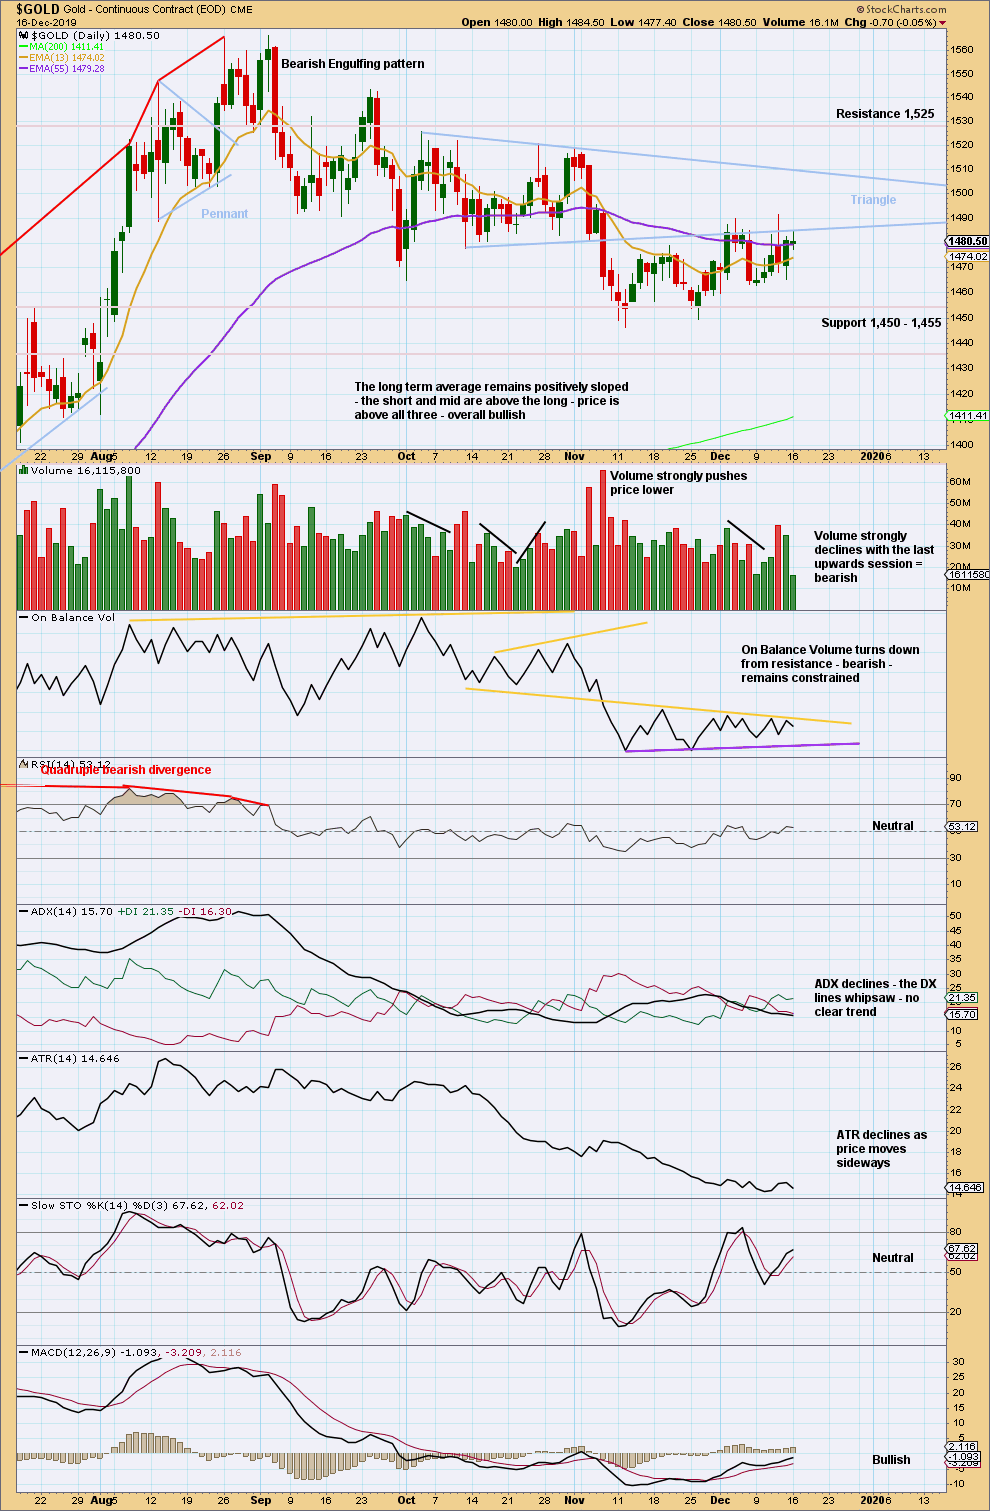
Click chart to enlarge. Chart courtesy of StockCharts.com.
Since the last high on the 4th of September, there is now a series of three swing lows and swing highs.
After a breakout from the triangle, the target is to be about 1,431.
The downwards breakout from the triangle had strong support from volume pushing price lower, so confidence may be had in the breakout. Now three back tests of resistance at the lower triangle trend line have completed; resistance has successfully held there.
Price has been moving higher since the 12th of November making a series of short-term highs, but On Balance Volume has not been making corresponding short-term highs. This upwards movement looks weak in terms of On Balance Volume, volume and range. This still looks like a counter trend movement.
Today price has reached resistance exactly at the lower triangle trend line, and On Balance Volume again reached resistance. With volume very weak, it looks like a small bounce may be complete here.
GDX WEEKLY CHART
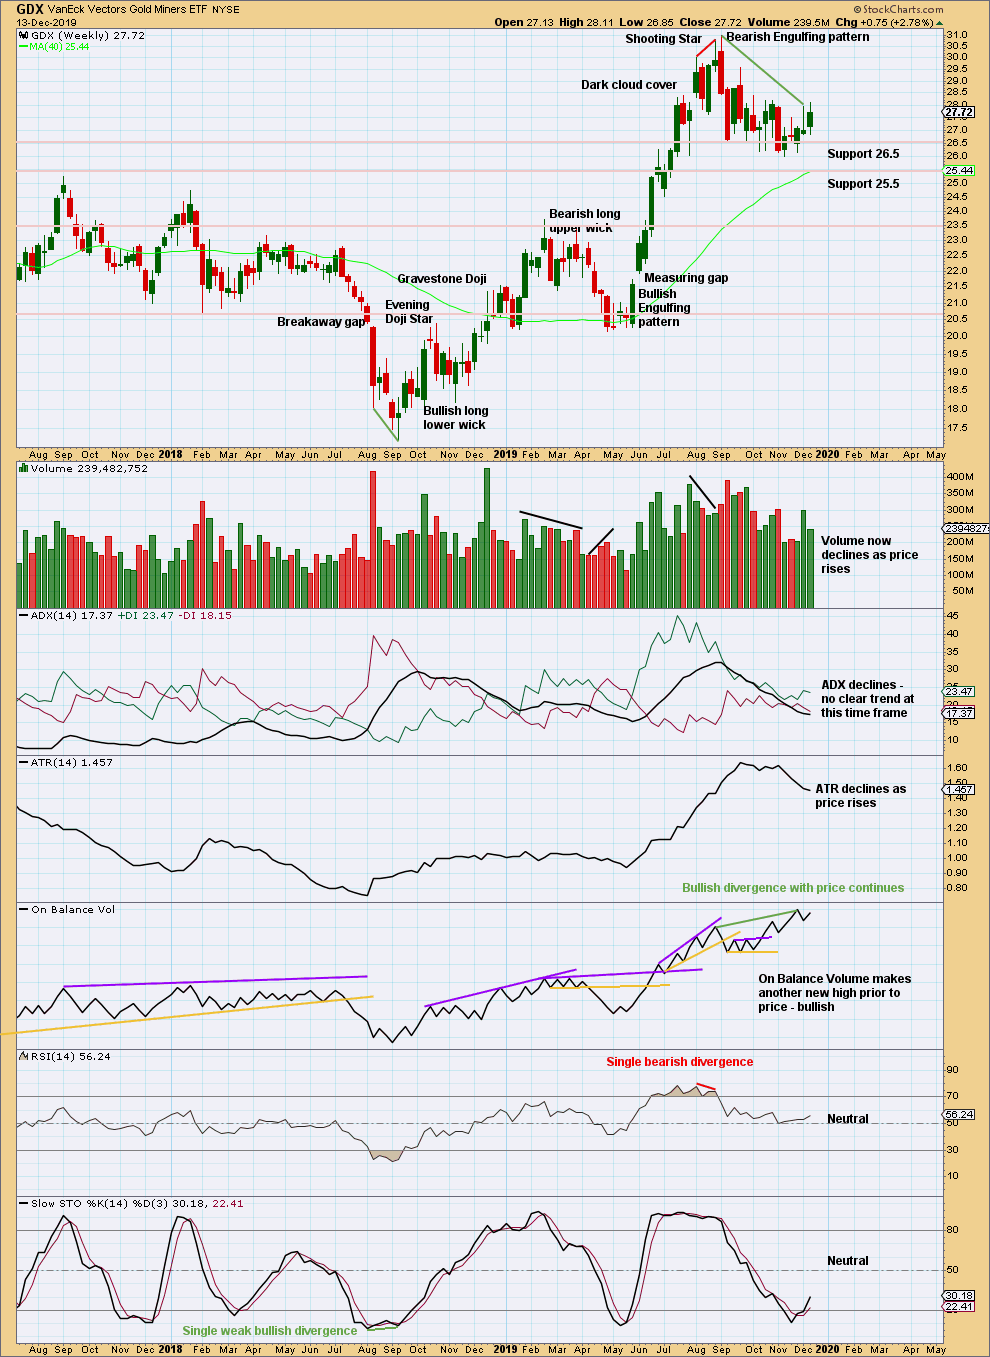
Click chart to enlarge. Chart courtesy of StockCharts.com.
GDX, like Gold, often begins a new trend slowly with overlapping and flat or declining ATR. From the last major high at 30.96 a few weeks ago, there has been a strong Bearish Engulfing pattern and strong downwards weeks with greater range and volume than upwards weeks. GDX may have had a trend change. However, bullish divergence between price and On Balance Volume is strong and persistent; it contradicts the view of a trend change.
For the short term, some weakness in upwards movement last week suggests upwards movement here may be limited.
GDX DAILY CHART
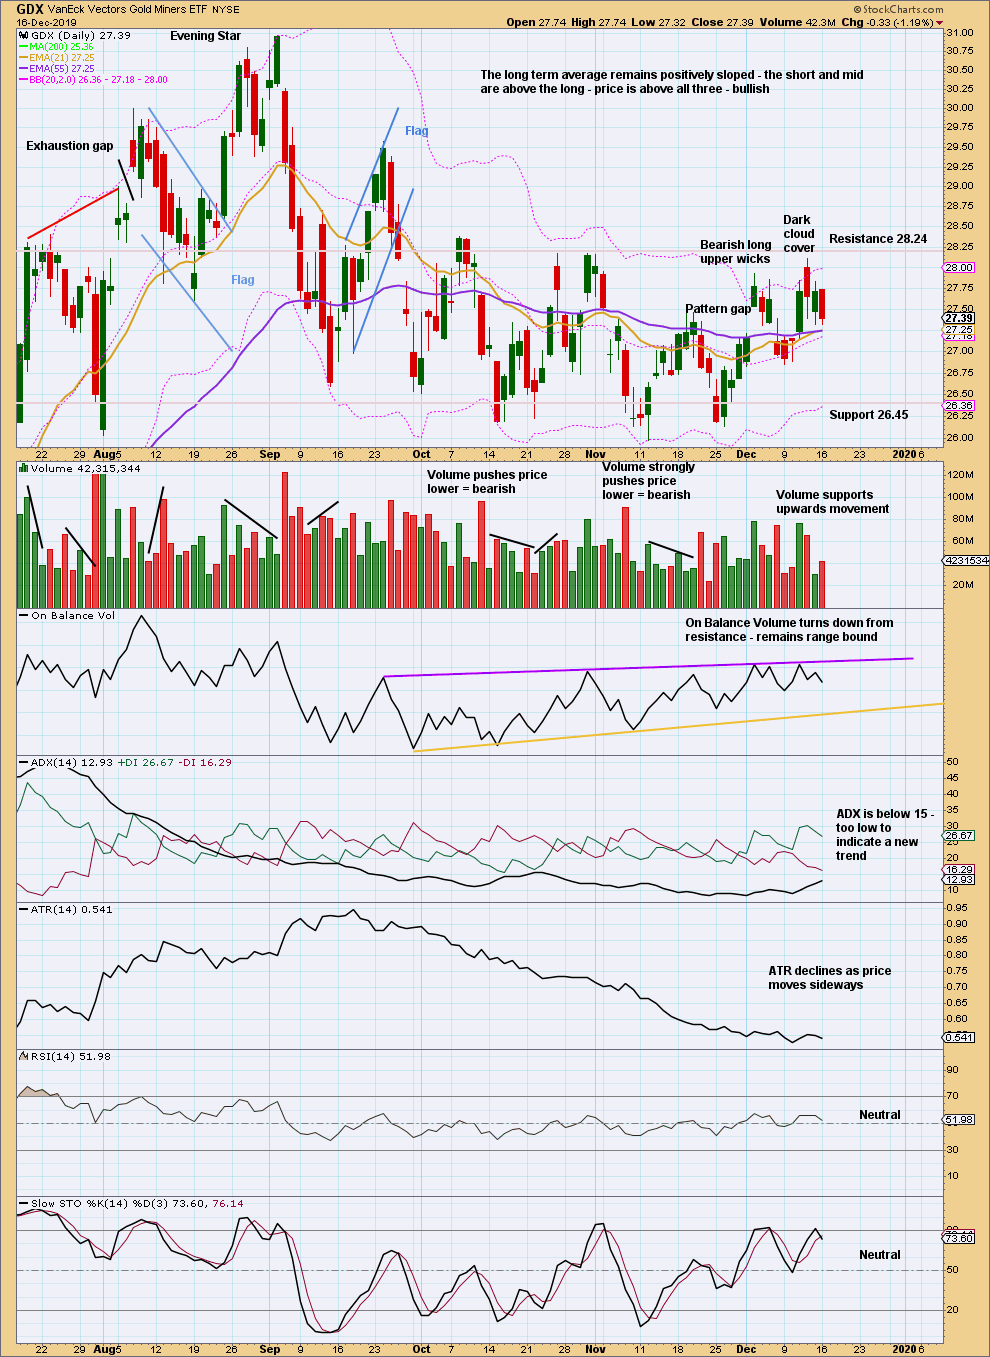
Click chart to enlarge. Chart courtesy of StockCharts.com.
GDX has made a new swing low. There is now a series of four lower swing highs and four lower swing lows from the high on the 4th of September. It looks like GDX may have had a trend change. This view should remain dominant while the last swing high at 28.18 on the 31st of October remains intact.
Closure of the last gap, On Balance Volume turning down from resistance, Stochastics moving back into neutral territory after reaching overbought, bearish long upper wicks, and push from volume all suggest more downwards movement to a new swing low in coming days.
Dark Cloud Cover suggests the bounce should be over.
Published @ 10:06 p.m. EST.
—
Careful risk management protects your trading account(s).
Follow my two Golden Rules:
1. Always trade with stops.
2. Risk only 1-5% of equity on any one trade.
—
New updates to this analysis are in bold.
A question for all members:
We have a very small number of you here in New Zealand and a few more in Australia, presumably you are our only members with access to invest in those two markets.
I am investing in our New Zealand market. When I make my decisions would you like me to email you? I’m using chart analysis and RRG charts in combination. No Ellliott Wave of individual stocks, they’re too light in volume for that.
If you want to be informed on my decisions in the NZ market please email me admin@elliottwavegold.com
hourly bear chart updated
micro C fits as a five, but it doesn’t have good proportion between the quick zigzag of sub-micro (2) and a now very time consuming triangle for sub-micro (4)
but that’s not so much a problem on a lower time frame as it is on a larger time frame (like weekly) so it’s somewhat acceptable
subminuette ii would fit better if it began at the low labelled micro B, but then subminuette i would not fit so well as a five, it would look like a three
bottom line, still no breakout. how long can Gold wind up sideways? this is really rather tiring
JDST 13.06.