
GOLD: Elliott Wave and Technical Analysis | Charts – December 2, 2019
A small range inside day to begin the week leaves the Elliott wave counts the same.
Summary: The downwards trend may resume. The Elliott wave target is at 1,348.
A target calculated from the triangle is about 1,431.
For the very short term, a new swing high above 1,514.29 would add some confidence in a more bullish outlook. The target would then be at 1,567, 1,635 or 1,693.
For the bigger picture, the bearish Elliott wave count expects a new downwards trend to last one to several years has begun. The alternate bearish wave count looks at the possibility that one final high to 1,559 is required first.
The bullish Elliott wave count expects a primary degree fourth wave has completed and the upwards trend has resumed.
Grand SuperCycle analysis is here.
Monthly charts were last published here.
BEARISH ELLIOTT WAVE COUNT
WEEKLY CHART
Click chart to enlarge.
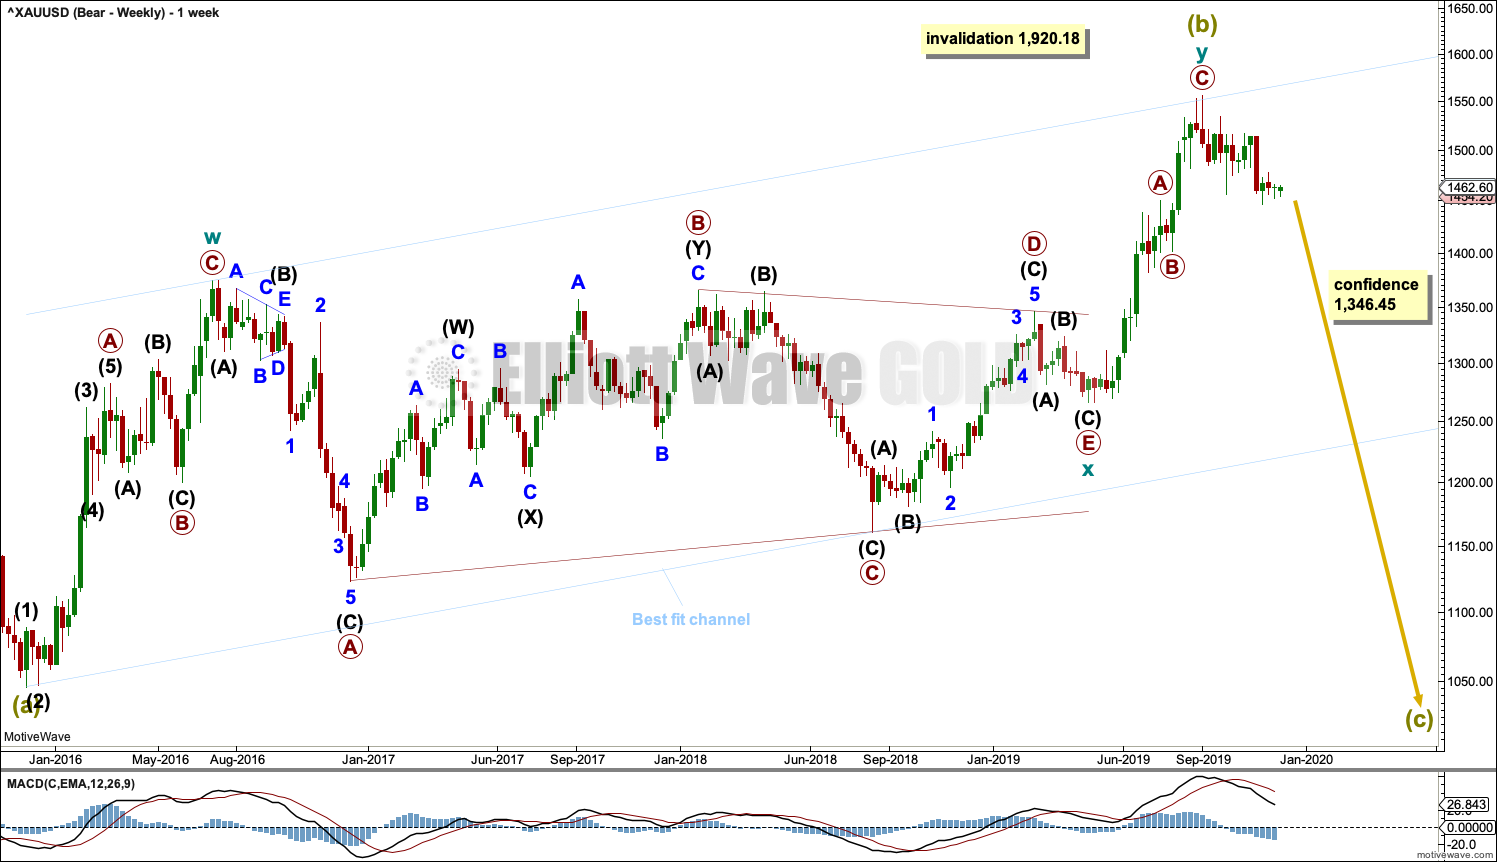
It is possible that Super Cycle wave (b) is complete as a double zigzag.
The first zigzag in the double is labelled cycle wave w. The double is joined by a three in the opposite direction, a triangle labelled cycle wave x. The second zigzag in the double is labelled cycle wave y.
The purpose of the second zigzag in a double is to deepen the correction. Cycle wave y has achieved this purpose.
A new low below 1,346.45 would add strong confidence to this wave count. At that stage, the bullish Elliott wave count would be invalidated.
A wide best fit channel is added in light blue. This channel contains all of Super Cycle wave (b) and may provide resistance and support. Copy this channel over to daily charts.
Super Cycle wave (c) must subdivide as a five wave structure, most likely an impulse. It may last several years. It would be very likely to make new lows below the end of Super Cycle wave (a) at 1,046.27 to avoid a truncation.
DAILY CHART
Click chart to enlarge.
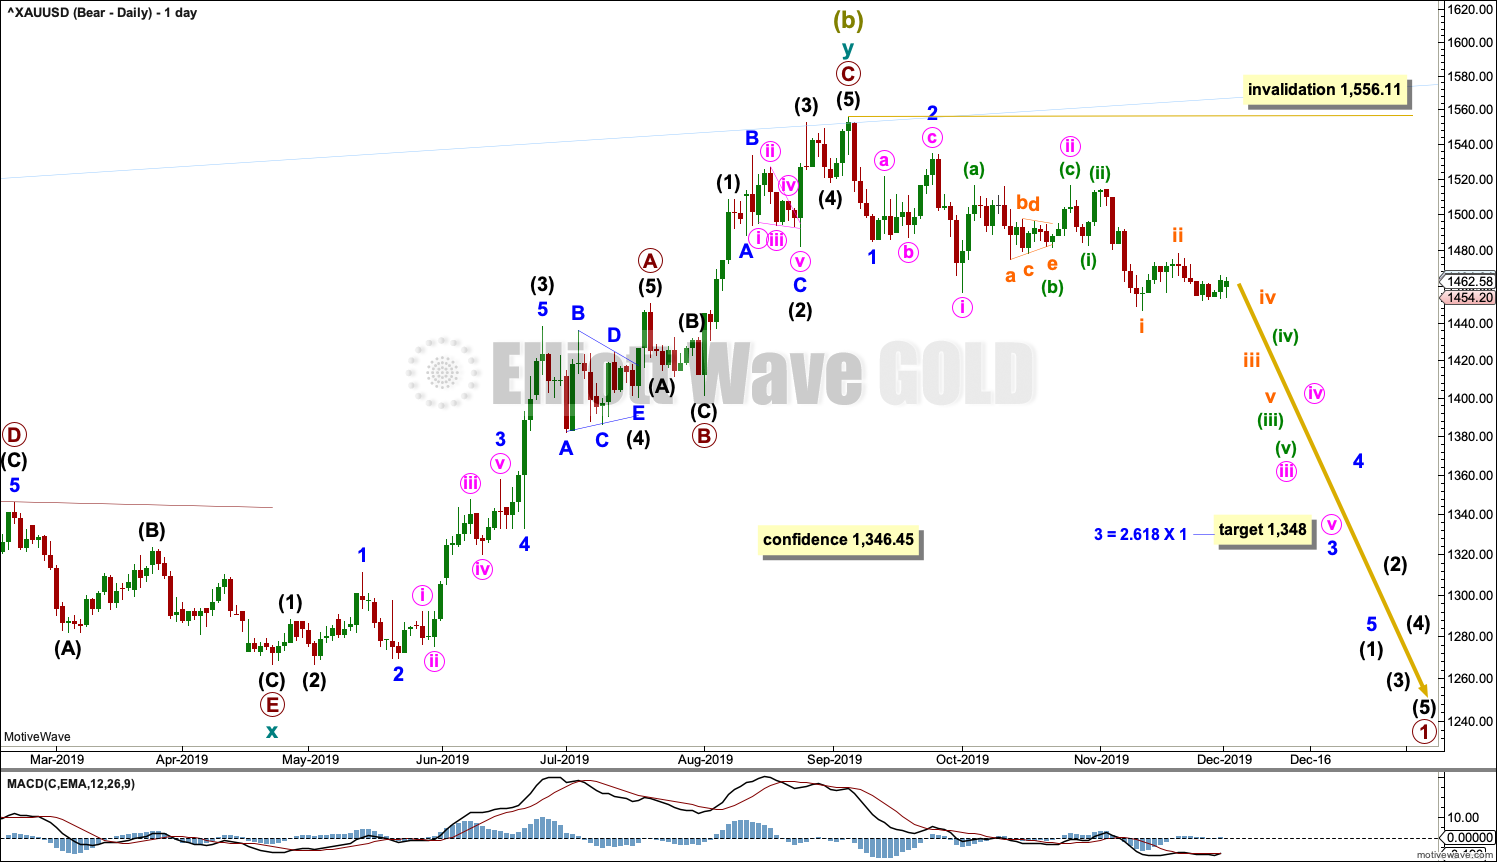
Classic analysis now reasonably supports this wave count.
Cycle wave y may be a complete zigzag. Within both of primary waves A and C, there is good proportion between intermediate waves (2) and (4). Within both of primary waves A and C, there is good alternation in structure of intermediate waves (2) and (4).
Within cycle wave y, there is no Fibonacci Ratio between primary waves A and C.
If there has been a trend change at Super Cycle degree, then a five down needs to develop on the daily and weekly charts. So far that is incomplete. It will be labelled intermediate wave (1).
HOURLY CHART
Click chart to enlarge.
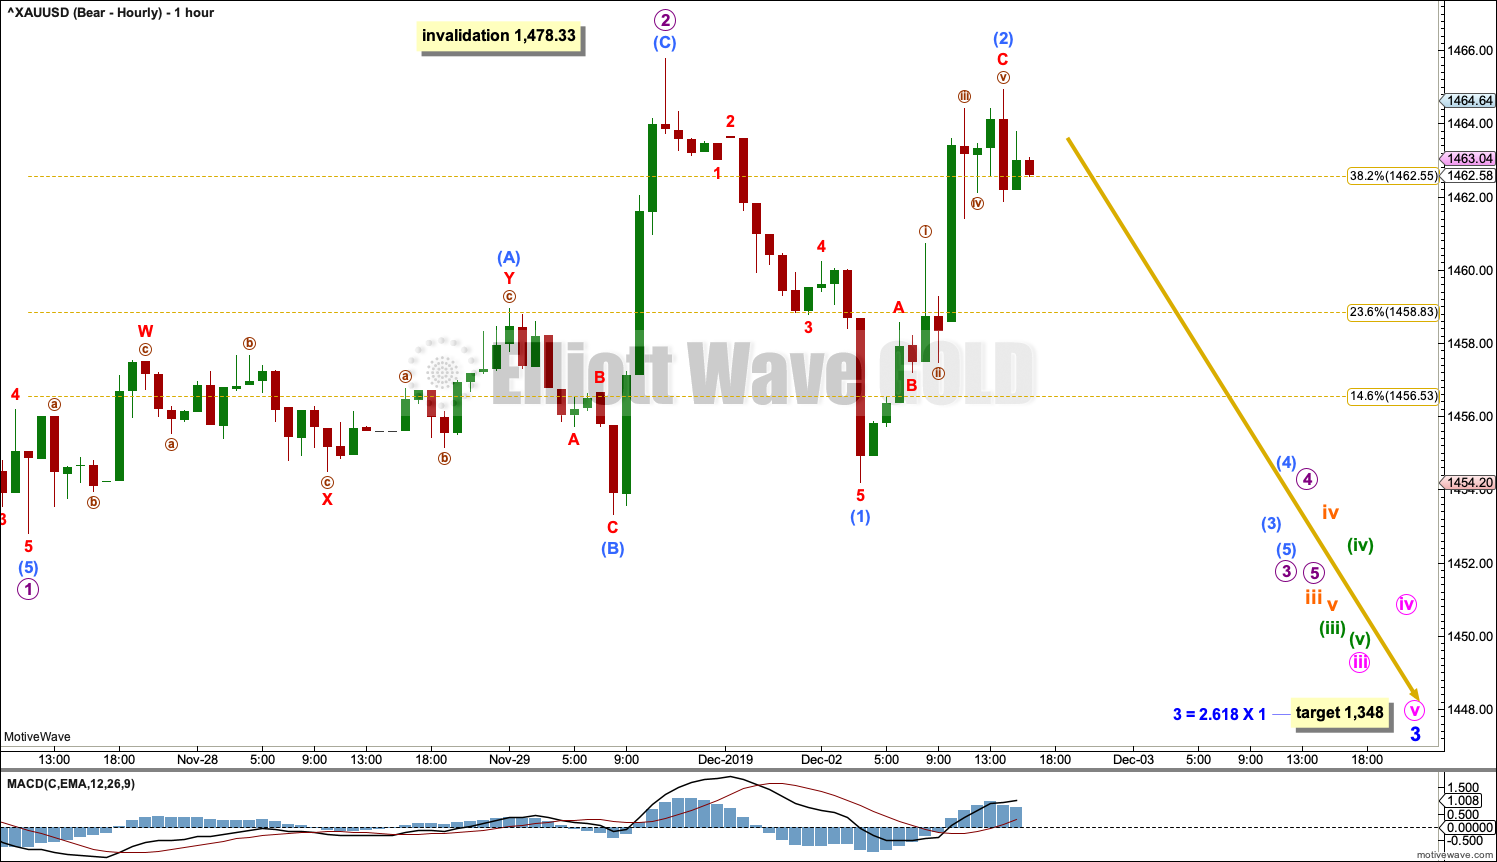
There may now be a series of six complete first and second waves. A strong downwards breakout may come within a week now.
Micro wave 2 may be complete, just above the 0.382 Fibonacci ratio. It may possibly be more shallow than second waves usually are due to the strong downwards pull of the middle of a third wave. The invalidation point is left the same to allow for the possibility that micro wave 2 may continue sideways for another day or so.
Gold typically exhibits swift and strong fifth waves. This tendency is especially prevalent for fifth waves to end third wave impulses one degree higher. Look for the possibility of one or more of these third waves to end with strength.
Micro wave 2 may not move beyond its start above 1,478.33.
ALTERNATE DAILY CHART
Click chart to enlarge.
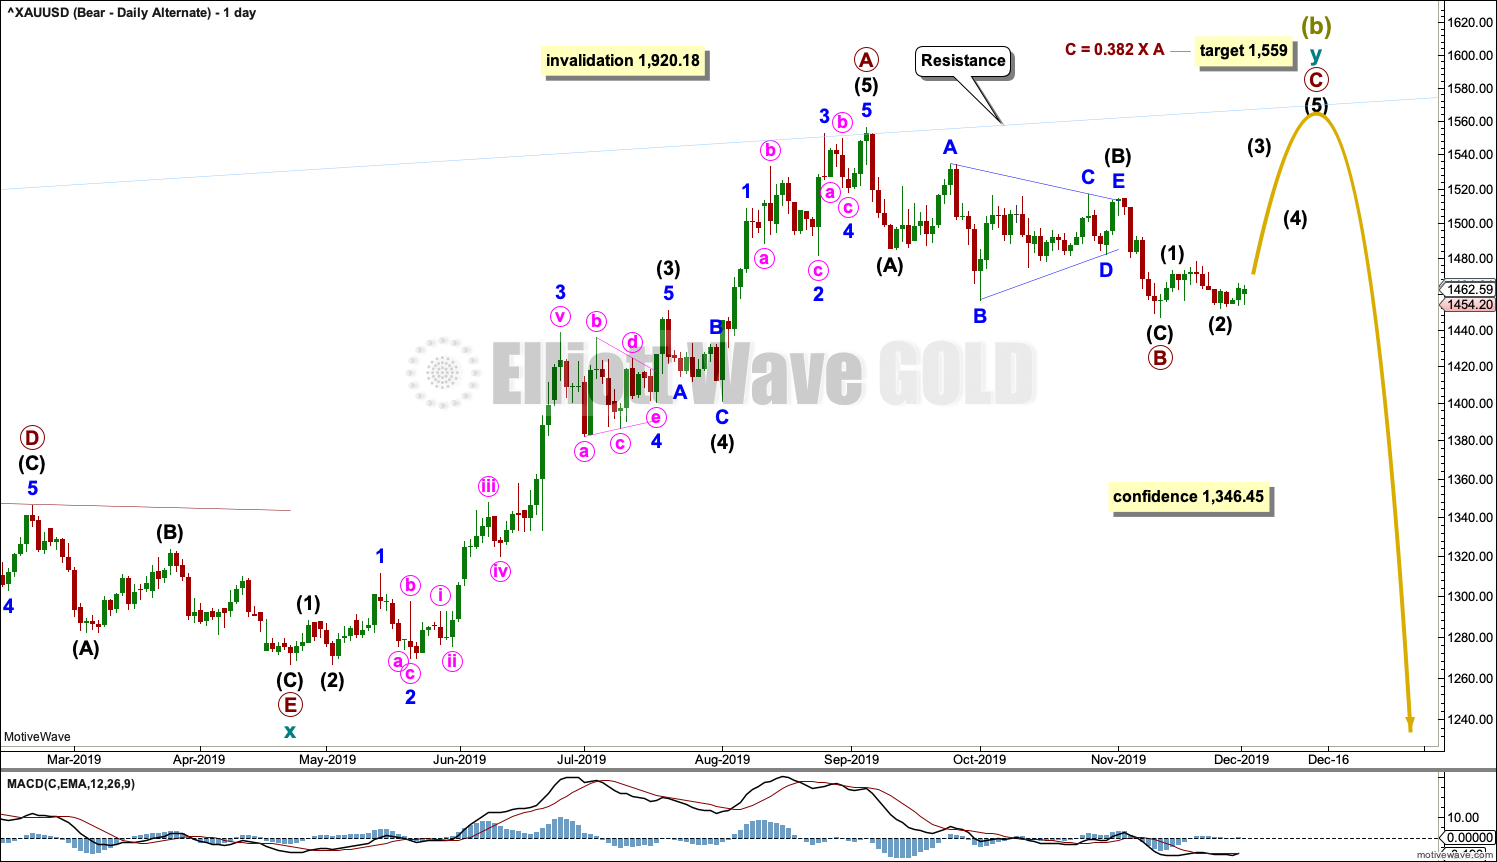
It is possible that the double zigzag for Super Cycle wave (b) may be incomplete and may yet require one more high.
Within cycle wave y, primary wave A may have been over at the last high.
Primary wave B may be complete as a single zigzag. Within the zigzag, intermediate wave (C) is just 3.56 short of equality in length with intermediate wave (A). Intermediate wave (B) is a running contracting triangle.
It is possible for this wave count that primary wave B could continue lower as a double zigzag. Primary wave B may not move beyond the start of primary wave A below 1,266.61.
A new low now below 1,446.68 would see primary wave B relabelled as a double zigzag, continuing lower.
Primary wave C would be expected to find strong resistance and end at the upper edge of the blue best fit channel copied over from the weekly chart.
BULLISH ELLIOTT WAVE COUNT
WEEKLY CHART
Click chart to enlarge.
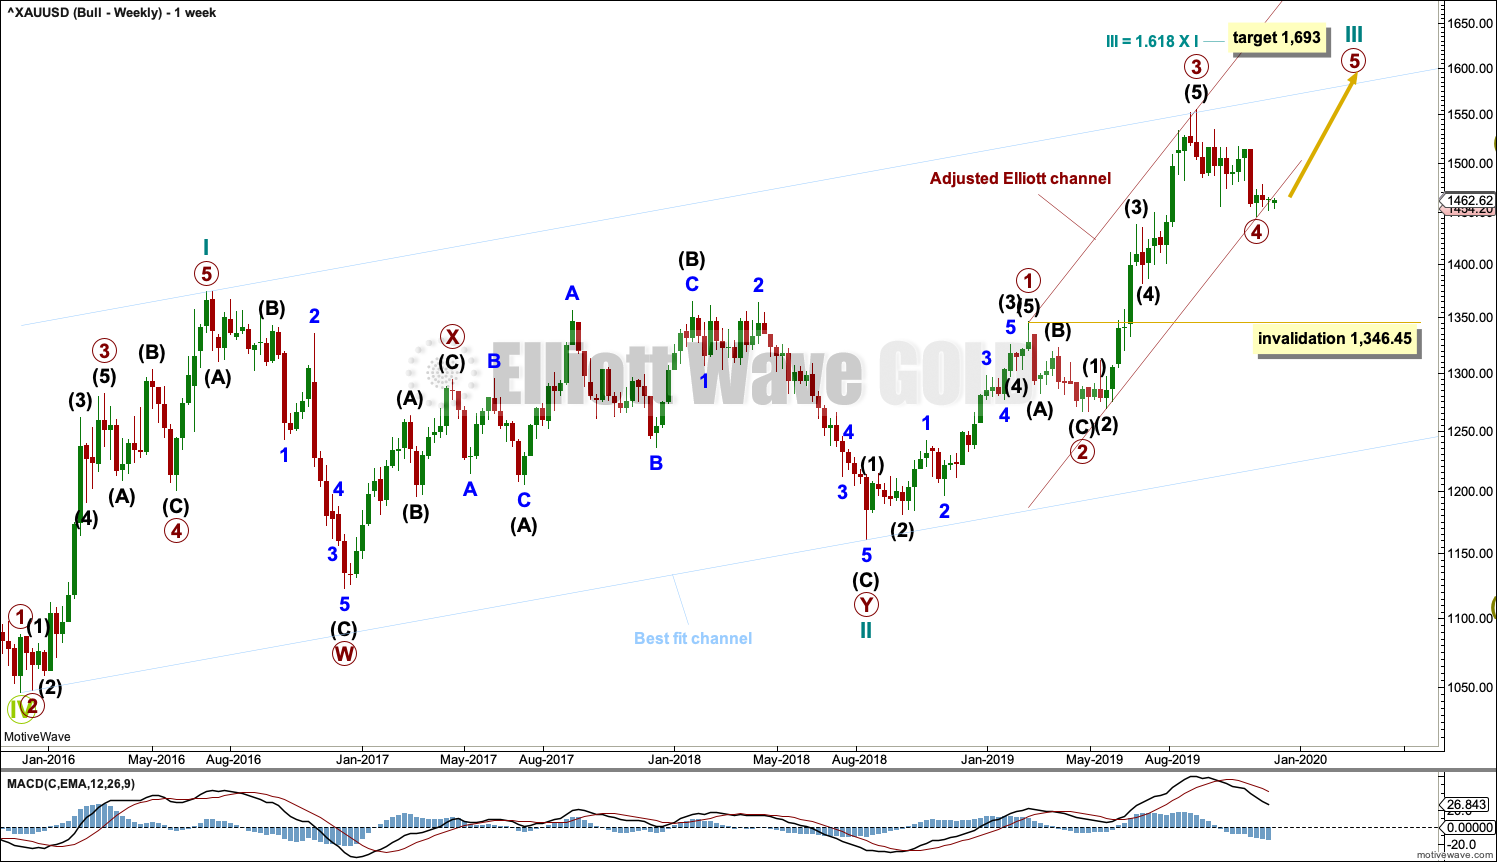
This wave count sees the the bear market complete at the last major low for Gold in November 2015.
If Gold is in a new bull market, then it should begin with a five wave structure upwards on the weekly chart. However, the biggest problem with this wave count is the structure labelled cycle wave I because this wave count must see it as a five wave structure, but it looks more like a three wave structure.
Commodities often exhibit swift strong fifth waves that force the fourth wave corrections coming just prior and just after to be more brief and shallow than their counterpart second waves. It is unusual for a commodity to exhibit a quick second wave and a more time consuming fourth wave, and this is how cycle wave I is labelled. This wave count still suffers from this very substantial problem, and for this reason the bearish wave count is still considered because it has a better fit in terms of Elliott wave structure.
Cycle wave II subdivides well as a double combination: zigzag – X – expanded flat.
Cycle wave III may have begun. Within cycle wave III, primary waves 1 and 2 may now be complete. Primary wave 3 has now moved above the end of primary wave 1 meeting a core Elliott wave rule. It has now moved far enough to allow room for primary wave 4 to unfold and remain above primary wave 1 price territory. Primary wave 4 may not move into primary wave 1 price territory below 1,346.45.
Cycle wave III so far for this wave count would have been underway now for 67 weeks. It exhibits some support from volume and increasing ATR. This wave count has some support from classic technical analysis.
The channel drawn about cycle wave III is an adjusted Elliott channel. The lower edge is pulled lower.
Add the wide best fit channel to weekly and daily charts.
DAILY CHART
Click chart to enlarge.
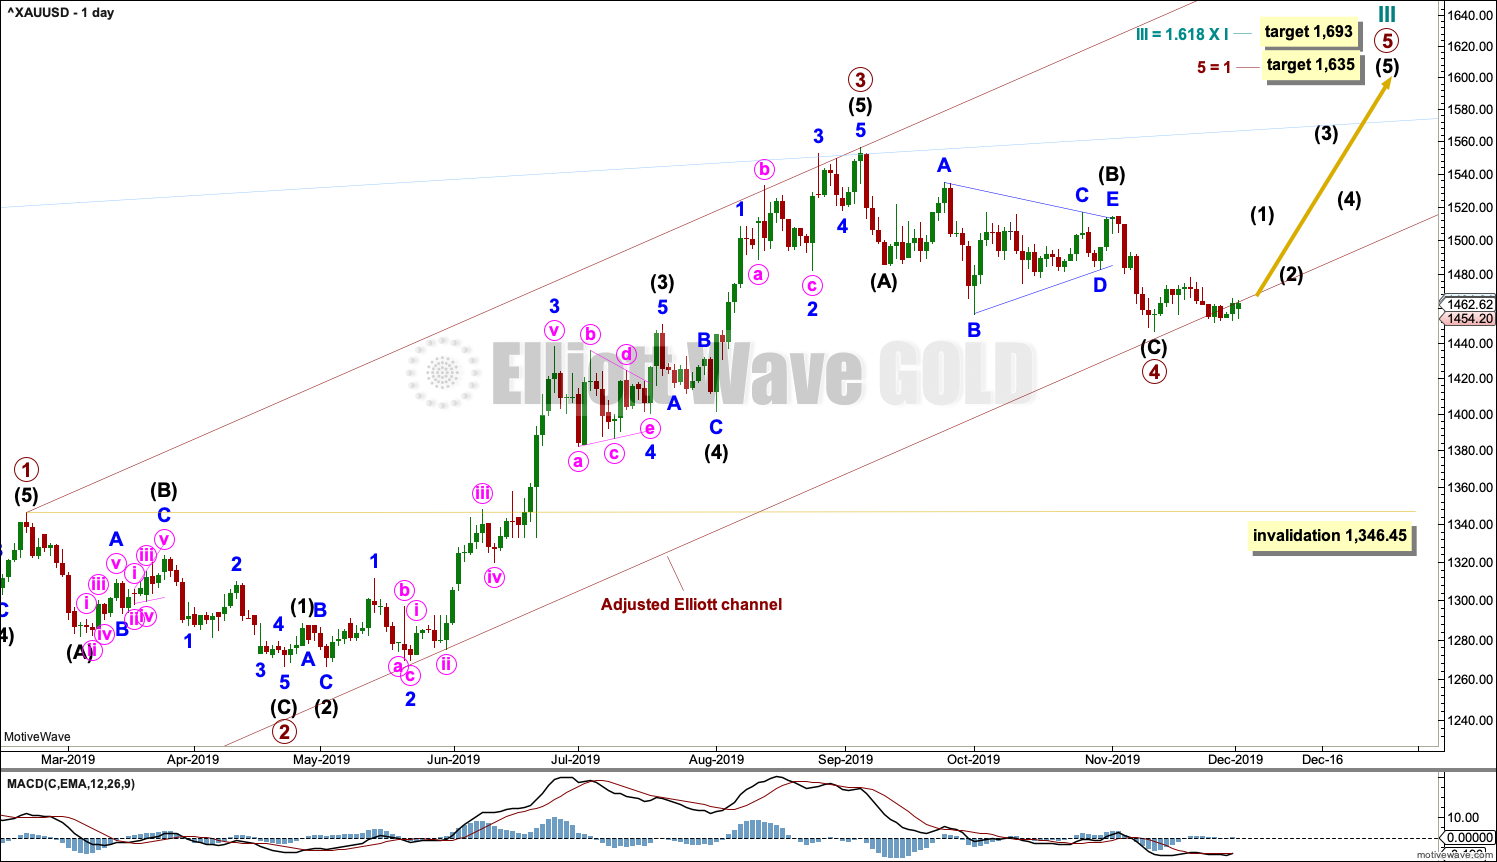
Primary wave 4 may be complete as a single zigzag. Primary wave 4 may have lasted 49 sessions, just six more than primary wave 2, which lasted 43 sessions. The proportion remains very good for this part of the wave count.
A target for cycle wave III is calculated also now at primary degree. If price reaches the first target and keeps rising, then the second higher target may be used.
If it continues any further, then primary wave 4 may not move into primary wave 1 price territory below 1,346.45.
If primary wave 4 is a single zigzag, then there is no alternation in structure with the single zigzag of primary wave 2. There is some alternation within the structures: primary wave 2 as a zigzag has intermediate wave (B) as a zigzag, while intermediate wave (B) within the zigzag of primary wave 4 is a triangle. Primary wave 2 is shallow at 0.43 the length of primary wave 1, and primary wave 4 is close to the same at 0.38 the length of primary wave 3. There is inadequate alternation in depth.
HOURLY CHART
Click chart to enlarge.
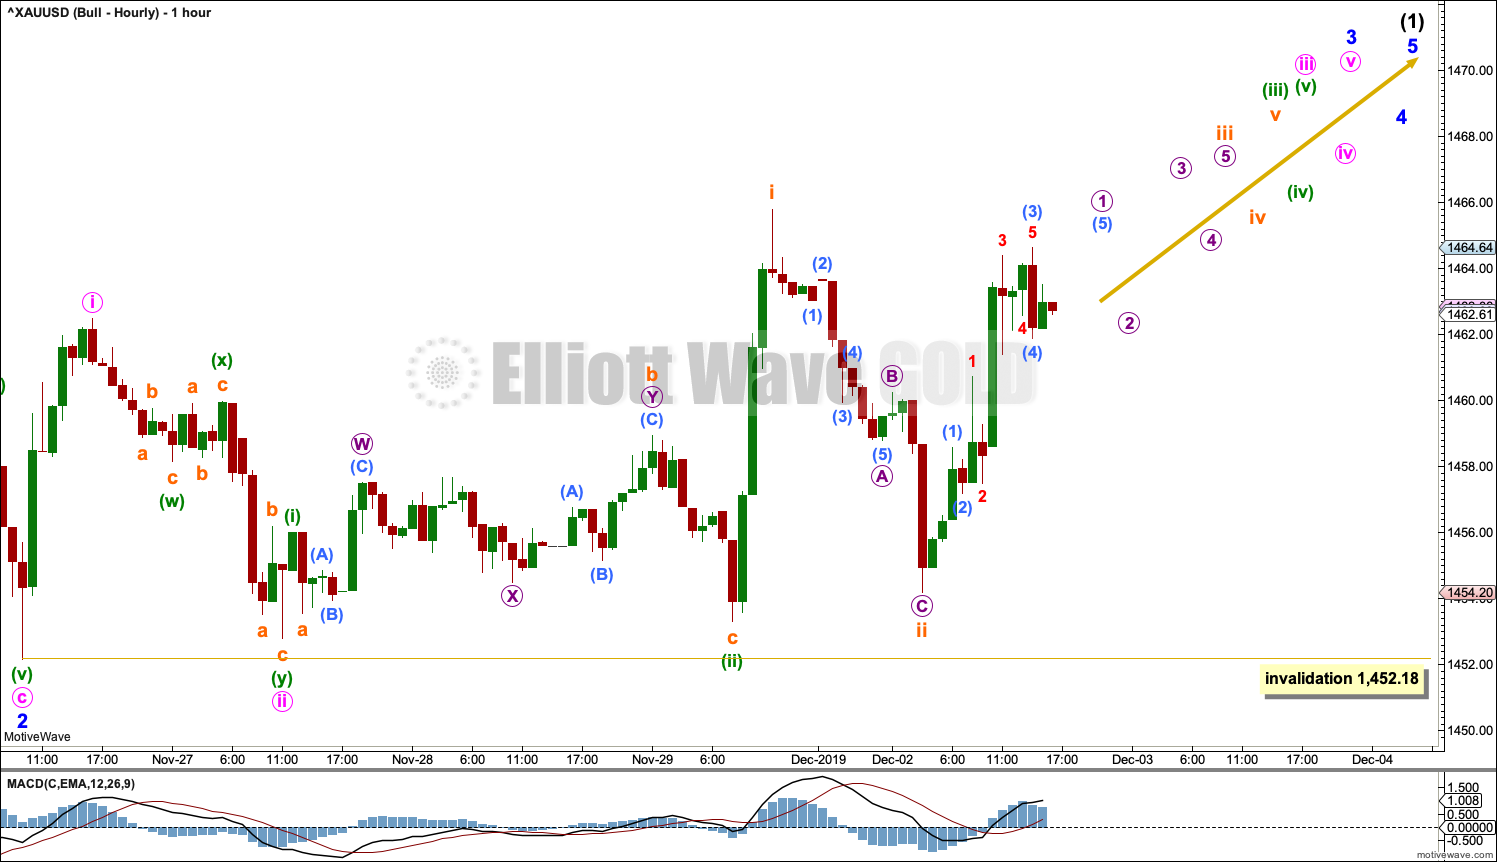
Within primary wave 5, intermediate wave (1) may be an incomplete five wave structure. Within that structure, minor waves 1 and 2 may now be complete.
Within minor wave 3, minute wave ii may not move beyond the start of minute wave i below 1,452.18. The invalidation point is left at this point to allow for the possibility that sideways movement may be a continuation of minute wave ii.
If this invalidation point is passed, then this short-term wave count would then consider minor wave 2 may be moving lower. The invalidation point would move lower to 1,446.68.
TECHNICAL ANALYSIS
MONTHLY CHART
Click chart to enlarge. Chart courtesy of StockCharts.com.
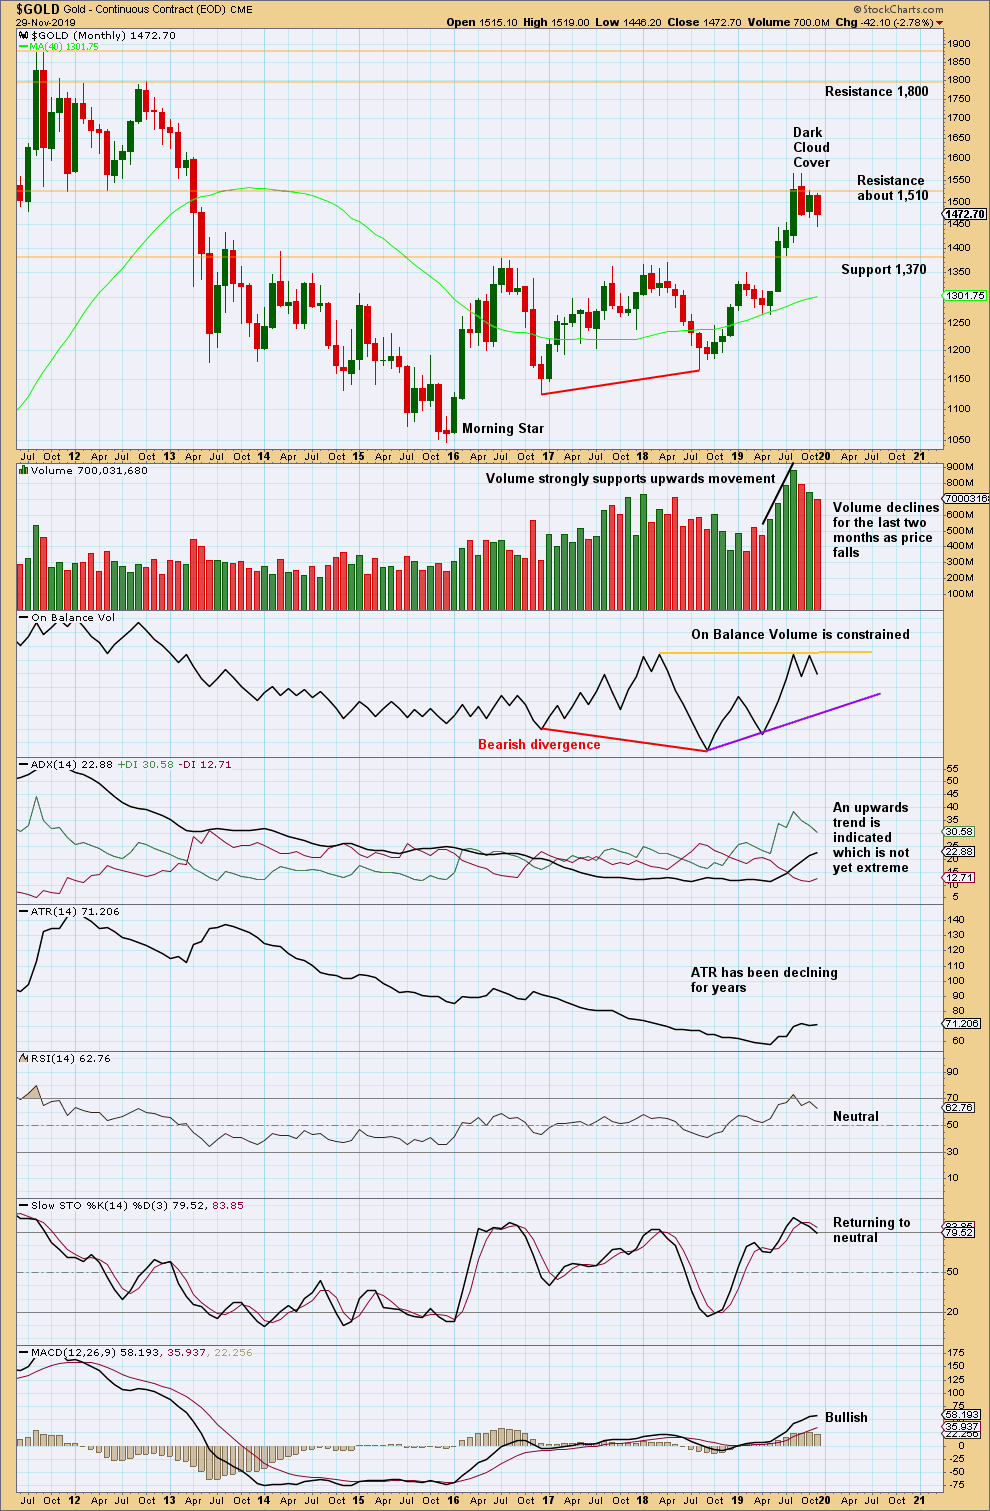
Overall, this chart is bullish. However, with RSI reaching overbought at the last high, upwards movement may be limited.
The last two months of sideways movement look like a consolidation within an ongoing upwards trend.
Some suspicion regarding the current upwards trend may be warranted by bearish divergence between price and On Balance Volume at the last lows. Also, at the last high price has made a substantial new high above April 2018, but On Balance Volume is flat.
November completes with downwards movement that does not have support from volume. The market has fallen of its own weight.
The all time high for Gold in September 2011 is on the upper left hand side of this chart. Notice upwards movement ended with strong support from volume and early downwards months exhibited volume which was weaker. Strong volume is not required at the beginning of a bearish movement for Gold for it to be sustainable.
WEEKLY CHART
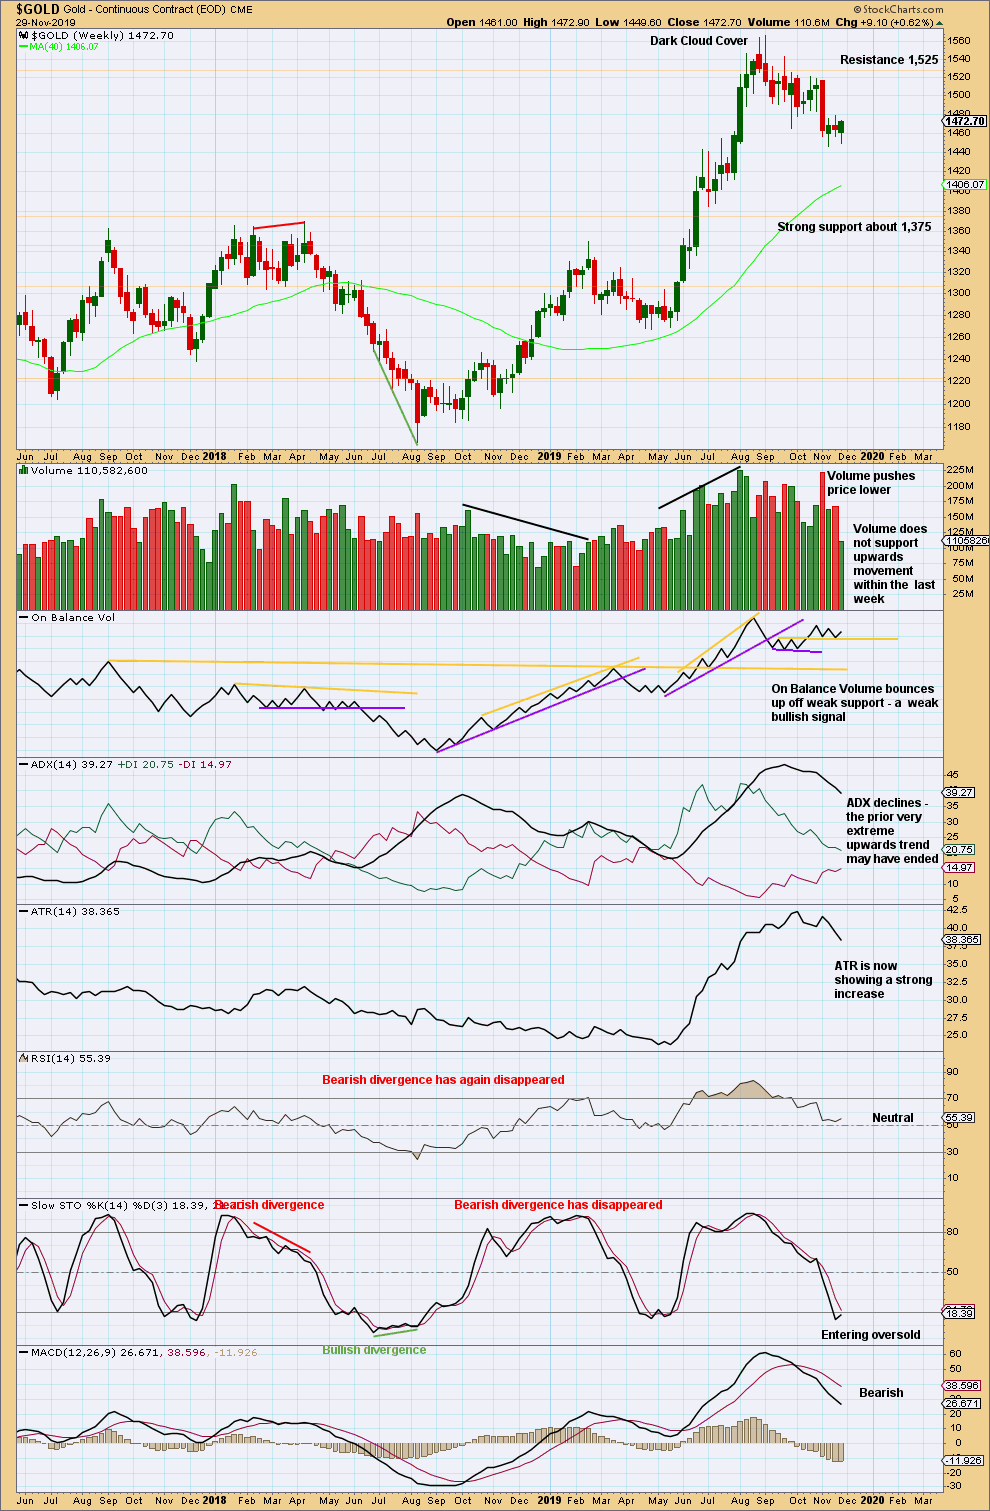
Click chart to enlarge. Chart courtesy of StockCharts.com.
When trends reach very extreme, candlestick reversal patterns should be given weight. The Dark Cloud Cover bearish reversal pattern is given more bearish weight from the long upper wick.
A very strong downwards week with strong support from volume five weeks ago supports a bearish view.
Last week is another small range week that has closed green and the balance of volume is upwards, although the week moved price higher with a higher high and a higher low. The short-term volume profile looks bearish, but a better judgement may come at the daily chart level.
DAILY CHART
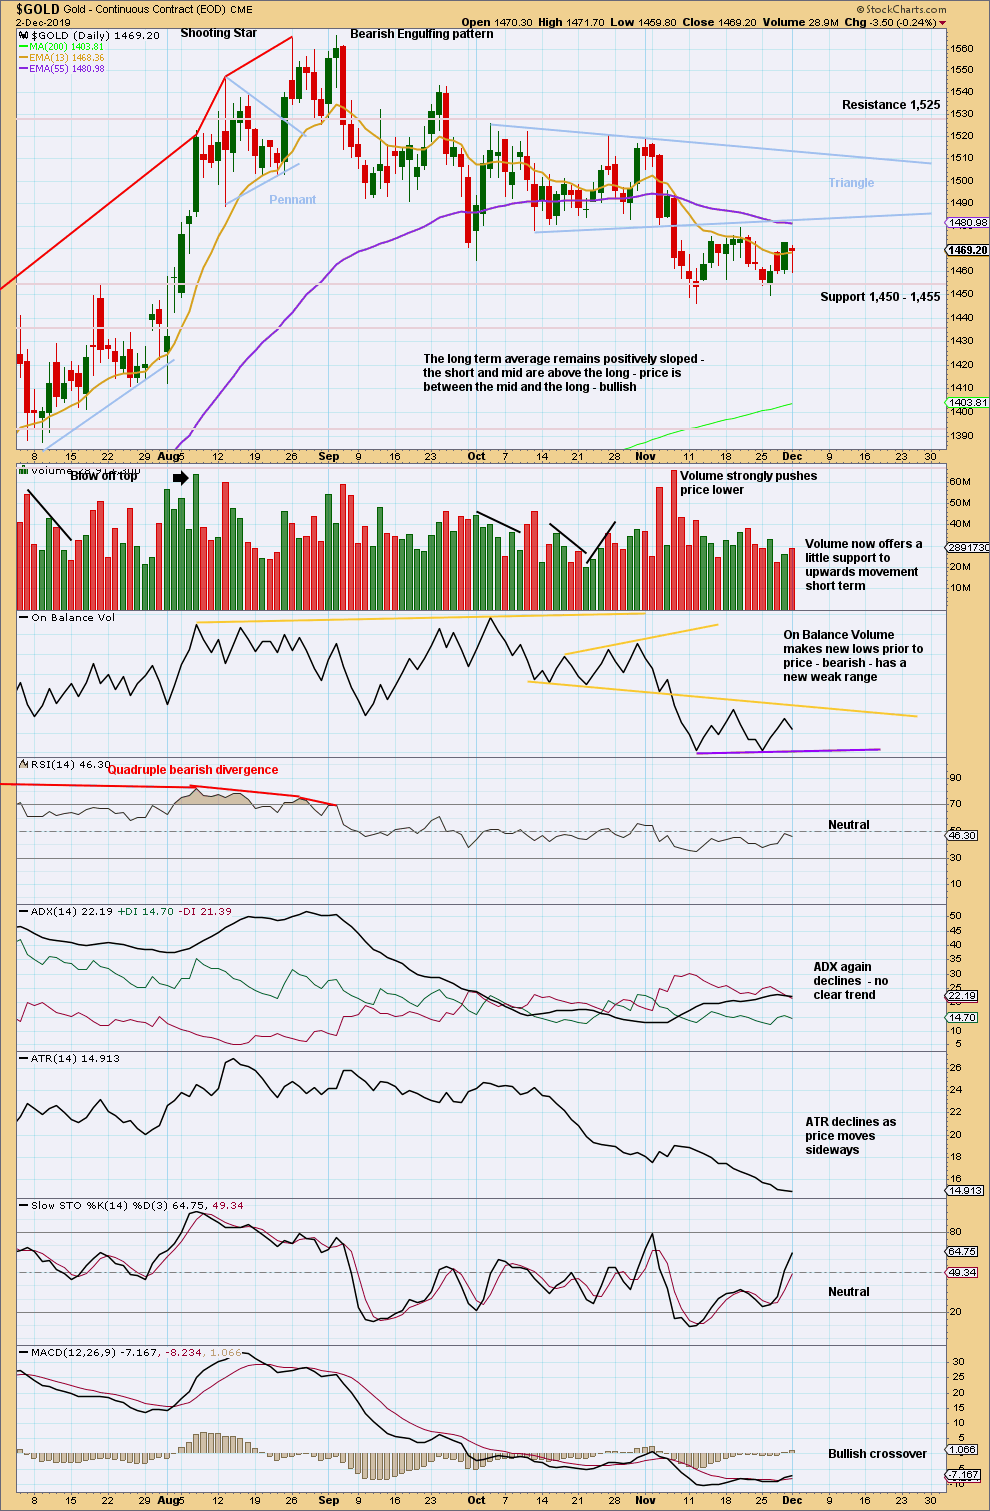
Click chart to enlarge. Chart courtesy of StockCharts.com.
Since the last high on the 4th of September, there is now a series of swing lows and swing highs.
After a breakout from the triangle, the target is to be about 1,431.
The downwards breakout from the triangle had strong support from volume pushing price lower, so confidence may be had in the breakout. A back test of resistance at the lower triangle trend line has completed; resistance has successfully held there. It looks reasonable to now expect new lows from Gold in coming days. This chart strongly supports the bearish Elliott wave count.
Monday completes an inside day that has closed red. The long lower wick is bullish.
Overall, a little support from volume suggests at least a little more upwards movement tomorrow, although this does so far look like another counter trend movement.
GDX WEEKLY CHART
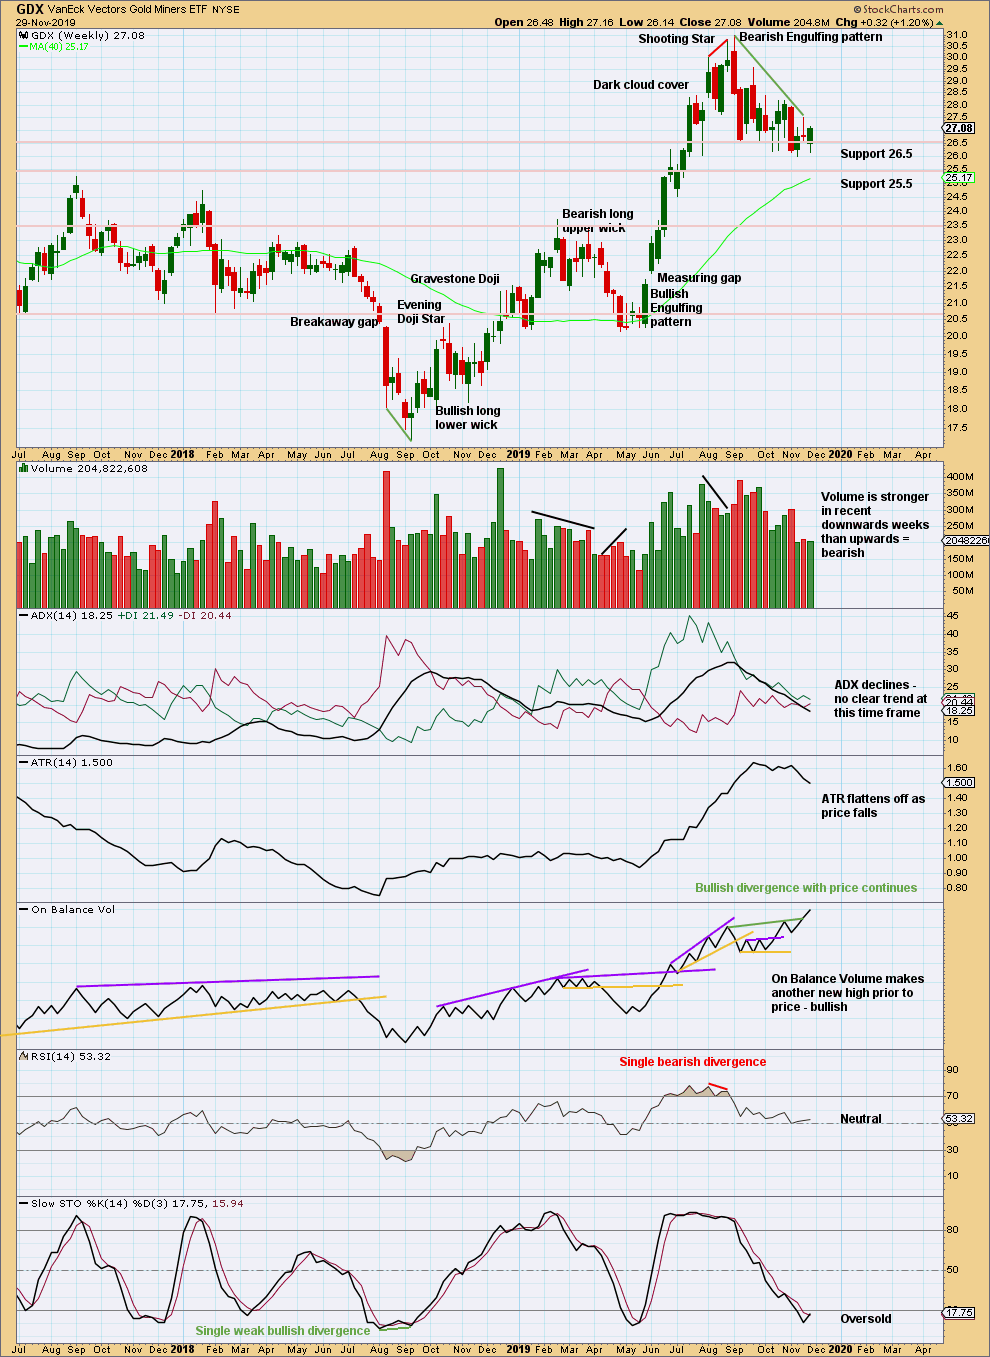
Click chart to enlarge. Chart courtesy of StockCharts.com.
GDX, like Gold, often begins a new trend slowly with overlapping and flat or declining ATR. From the last major high at 30.96 a few weeks ago, there has been a strong Bearish Engulfing pattern and strong downwards weeks with greater range and volume than upwards weeks. GDX may have had a trend change. However, bullish divergence between price and On Balance Volume is strong and persistent; it contradicts the view of a trend change.
GDX DAILY CHART
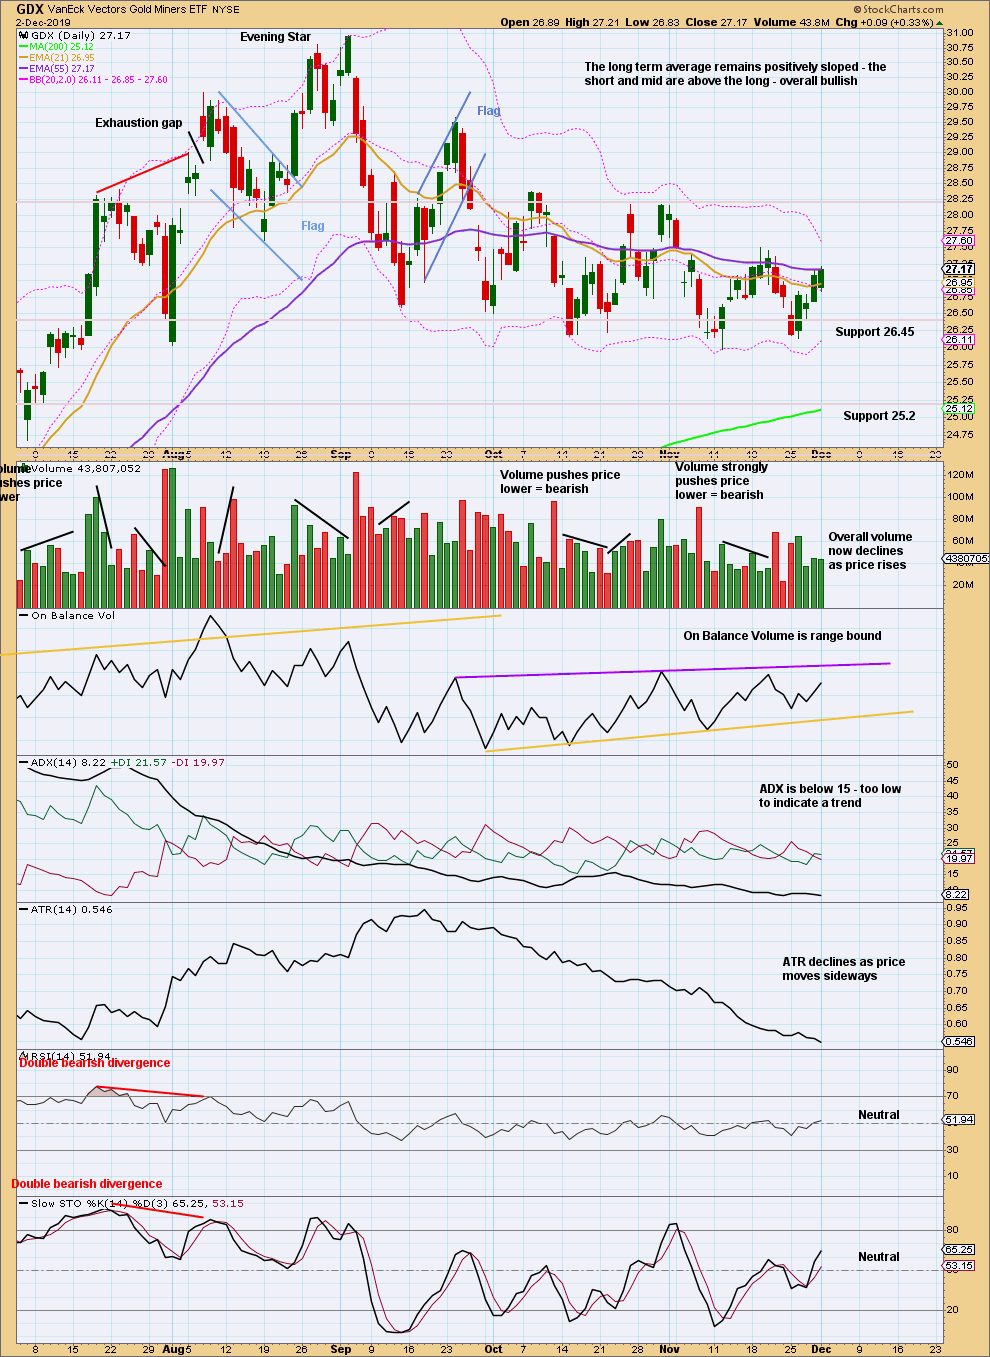
Click chart to enlarge. Chart courtesy of StockCharts.com.
GDX has made a new swing low. There is now a series of four lower swing highs and four lower swing lows from the high on the 4th of September. It still looks like GDX may have had a trend change. This view should remain dominant while the last swing high at 28.18 on the 31st of October remains intact.
Upwards movement of the last four sessions now lacks support from volume and has some decline in range. This looks like another small counter trend movement so far.
Published @ 10:30 p.m. EST.
—
Careful risk management protects your trading account(s).
Follow my two Golden Rules:
1. Always trade with stops.
2. Risk only 1-5% of equity on any one trade.
—
New updates to this analysis are in bold.
Hi Lara why can’t I view the Oil weekly charts? 🙄
Can “submit a comment” be moved to the top of the comments? I think that’s how it has been. Thx
Hi Lara, hope your holiday weekend went well. Despite chaos here there is much to be grateful for, no?
So I just want to drop a quick comment noting that my daily GDX is showing an upward breakout from descending triangle Sept.-Dec. I’m thinking we could be looking at XAU alternate daily and want to clarify that I may use the hourly chart from your bullish scenario but moving degrees up/down as you say?? If you could follow this possibility in more detail if I am incorrect that would be great. Thanks.
Still adjusting to new layout – some good suggestions already noted by others. I do love that your update charts open up in new tabs full sized like the regular ones– good job on that Cesar! 🙂
Daily bear chart updated today:
A continuation of subminuette ii may be what is happening today.
Also, so far the high today is below the low I have labelled minuette (i) at 1,482.52. Which means this bounce could be a fourth wave corresponding to that first wave.
Subminuette i and ii look a lot bigger than minuette i and ii which cannot be right?
All right, disposed of my JNUG and reversing with JDST.
Only 1 more observation …
When you click comments, it takes you to the bottom of the page, as opposed to the start of the comments …
I’ve noticed that too. It’s annoying. Have passed this onto Cesar to look into.
Thank you for your feedback.
anyone know which count looks most likely now?
Still the main bear daily.
main count invalidated on the hourly! Glad I did Jnug position.
Is it on barchart?
Gold is getting a pop today. Curious to see how high.
Yep, all of the above would be great.
The only other one I have found, is that I can’t enlarge / zoom in to anything on my phone … It just wont let me pinch the charts bigger, whether I click in to them or not.
Thank you
Thank you very much Jimmy for this feedback. I have forwarded this to Cesar.
Nice update. Will need to get used to it.
A few initial random thoughts:
Can the # of comments be added within each post on the main page? It’s very helpful to know if a post has new comments without having to open the post.
The font size here in comments is too small
Where are the archives?
Nice to get rid of the right column as it gives more space to the post you are reading.
Thanks for all the work 👍🙂
Thanks very much Dreamer. I’ve forwarded your comments to Cesar. A couple I’ve already asked him to do.
He’s working on it!
Hi everybody.
We’ve changed the WP theme of the website, it needed updating. Cesar is still working finishing up some small details with this, and we would like to know if you are finding everything you need okay or if you have noticed any problems with the new layout.
Please email me admin@elliottwavegold.com or Cesar webmaster@elliottwavegold.com if you require any assistance.
It seems to be much crisper and sharper but the ability to move from one chart to the next by clicking on it seems to have gone for now.
I use this too! It’s necessary when I record the video. I’ve asked Cesar to put that back.