
Lara’s Weekly: Elliott Wave and Technical Analysis of S&P500 and Gold and US Oil | Charts – March 13, 2020

S&P 500
At the end of the week, monthly charts are reviewed in text and video. A bounce is expected for next week.
Summary: Expect a bounce to begin next week, which may end about either 2,828 or 3,044. Thereafter, the bear market may resume to make a final low at 2,352. This final target may change when the bounce is complete.
The biggest picture, Grand Super Cycle analysis, is here.
ELLIOTT WAVE COUNTS
MAIN WAVE COUNT
MONTHLY CHART
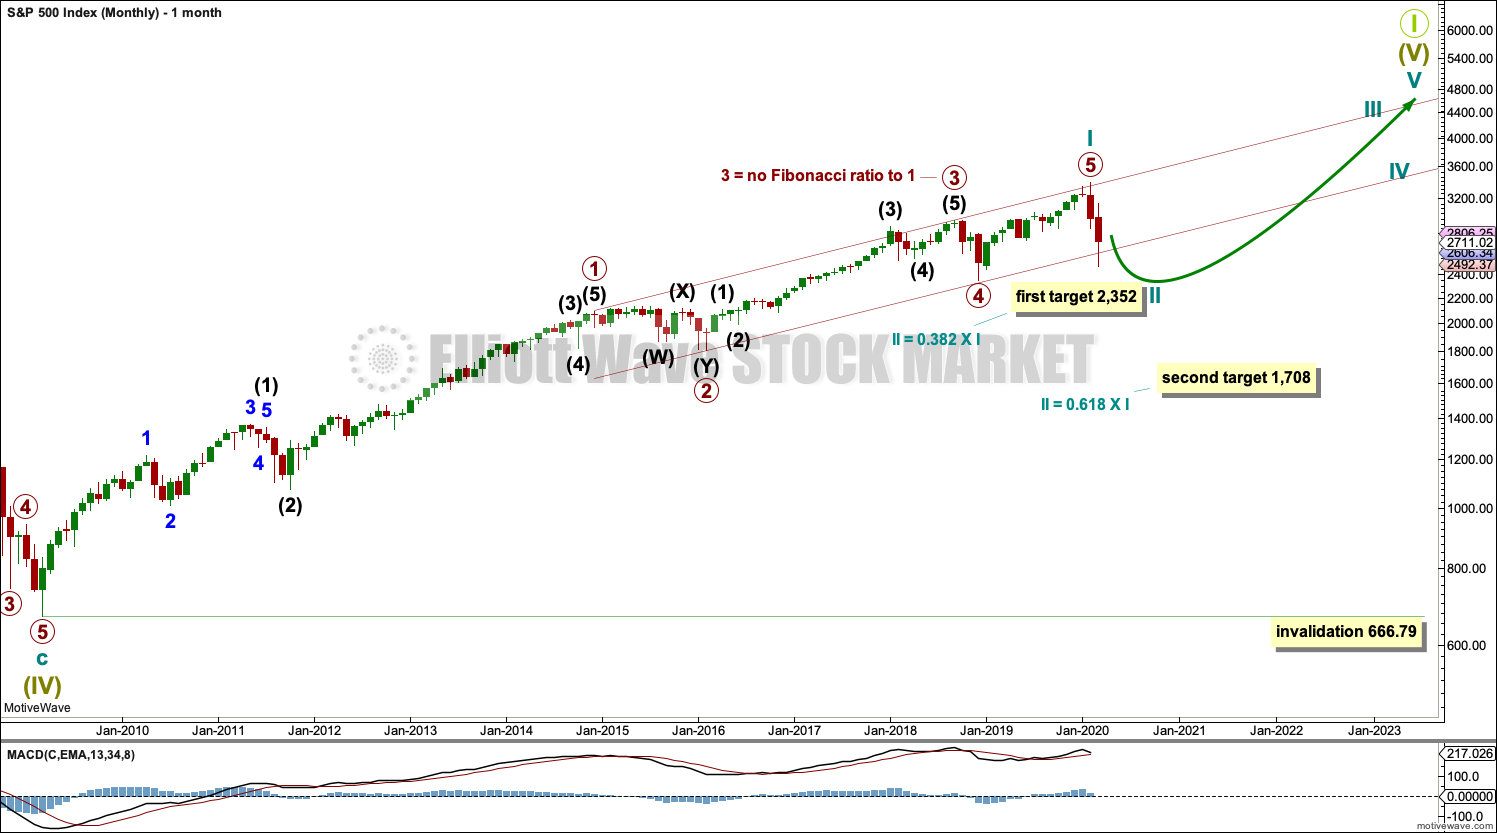
Click chart to enlarge.
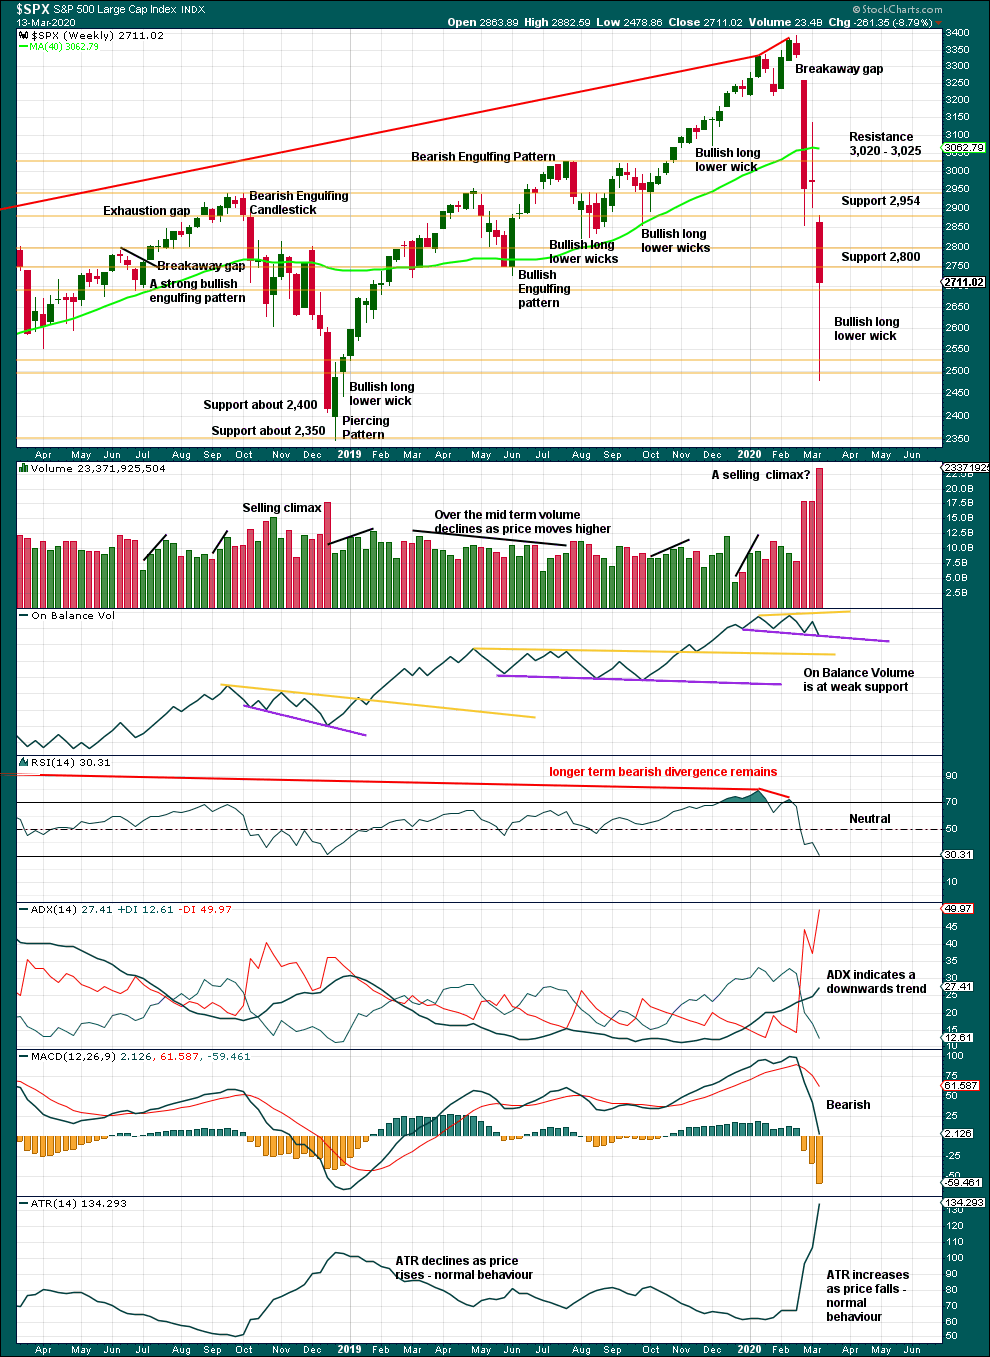
If the bull market is over and a bear market has begun, it has come after no divergence at the last all time high between price and the AD line as a measure of market breadth. Statistically this indicates the bear market to follow would most likely be relatively shallow. The 0.382 Fibonacci ratio would be a preferred target. The 0.236 Fibonacci ratio at 2,750.01 has already been passed.
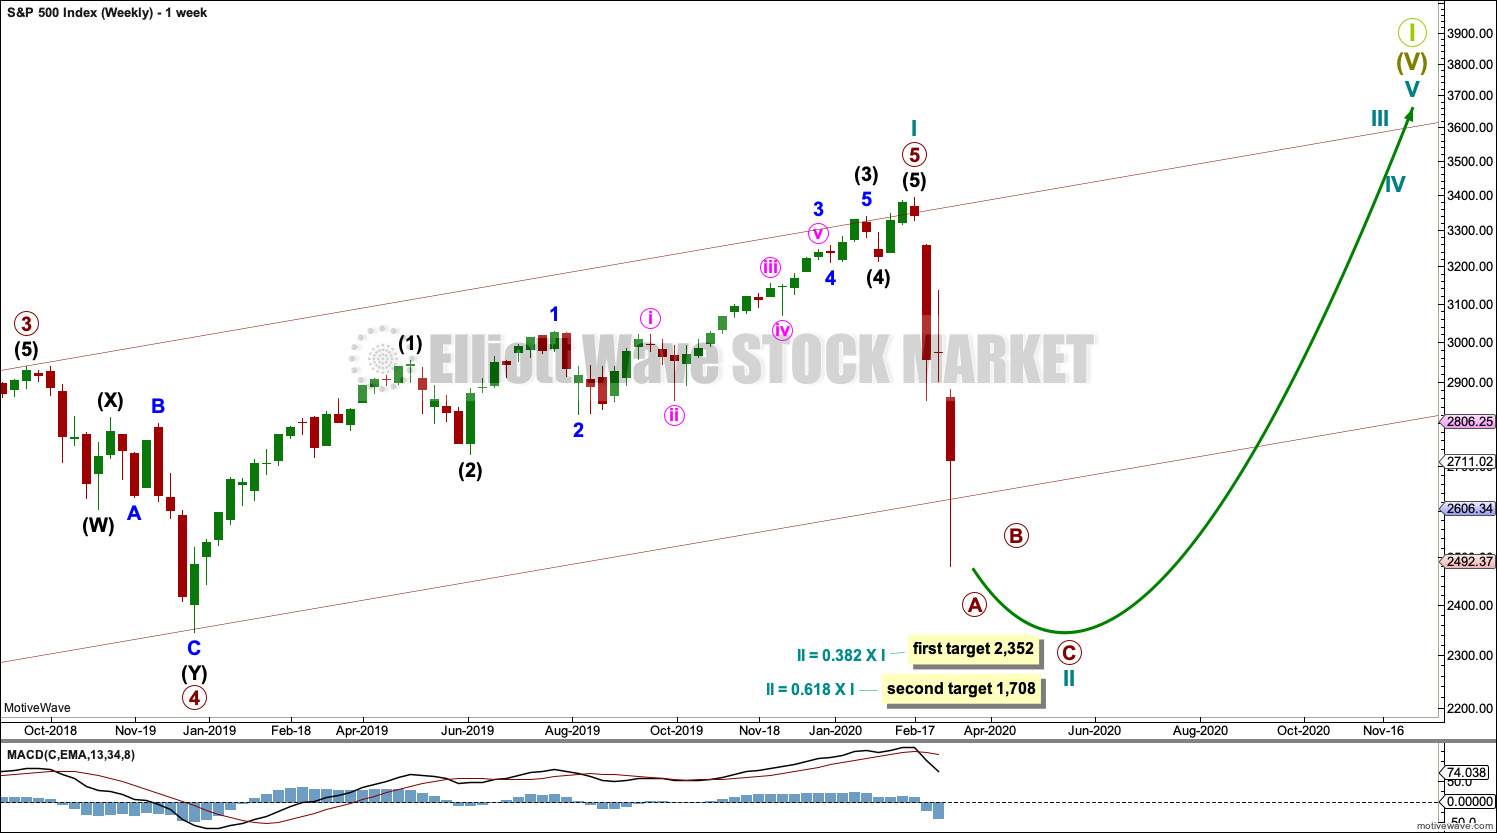
WEEKLY CHART
Click chart to enlarge.
If the channel is breached by a full daily candlestick below and not touching the lower edge, further confidence in this wave count may be had. A close below the lower trend line is very strong, so this now is the main wave count.
The second target at the 0.618 Fibonacci ratio would have a lower probability.
Cycle wave II may not move beyond the start of cycle wave I below 666.79.
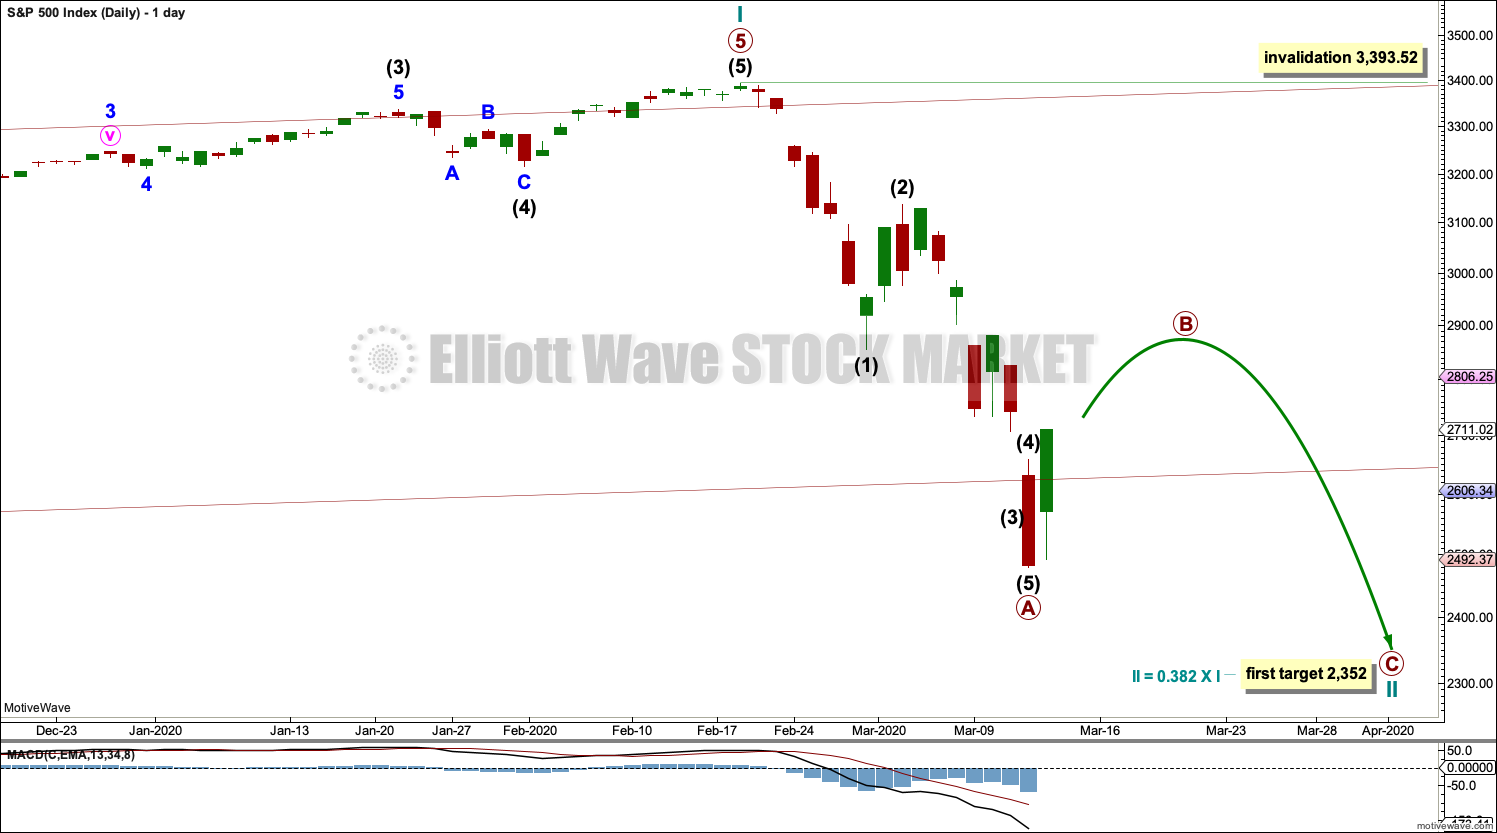
DAILY CHART
Click chart to enlarge.
Redraw the wide maroon trend channel carefully: draw the first trend line from the end of primary wave 1 at 2,093.55 (December 26, 2014), to the end of primary wave 3 at 2,940.91 (September 21, 2018), then place a parallel copy on the end of primary wave 2 at 1,810.10 (February 11, 2016). Today’s candlestick is almost all below the channel, and the close below is strong.
Cycle wave II may subdivide as any Elliott wave corrective structure except a triangle. It would most likely be a zigzag. Primary wave A may be a complete five wave impulse. Primary wave B may not move beyond the start of primary wave A above 3,393.52.
Primary wave B may subdivide as any Elliott wave corrective structure. B waves exhibit the greatest variety in structure and price behaviour. Primary wave B may be a quick sharp bounce, or it may be a sideways time consuming consolidation. Considering the strength and intensity of primary wave A, alternation suggests a more time consuming sideways consolidation for primary wave B.
ALTERNATE WAVE COUNT
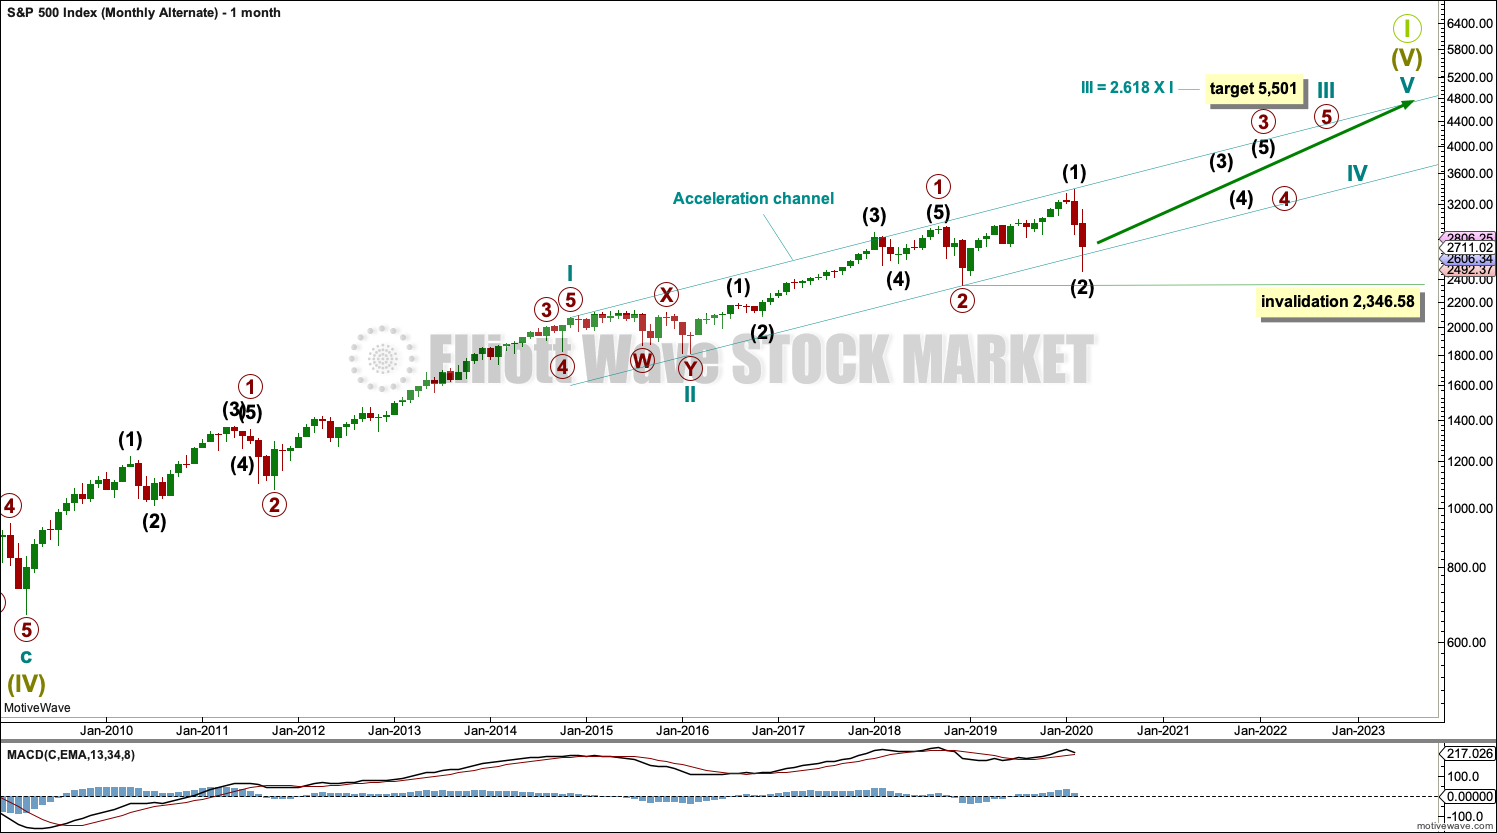
MONTHLY CHART
Click chart to enlarge.
It is also possible that there may be a series of three overlapping first and second waves for this bull market. This wave count would be very bullish once intermediate wave (2) is over.
Intermediate wave (2) may not move beyond the start of intermediate wave (1) below 2,346.58.
TECHNICAL ANALYSIS
WEEKLY CHART
Click chart to enlarge. Chart courtesy of StockCharts.com.
A 27% drop in price (high to close) no longer has precedent within the larger bull market.
At the weekly chart level, conditions are not yet oversold; there is room for downwards movement to continue.
However, the long lower candlestick wick this week is very bullish. It suggests a bounce may begin here within the downwards trend.
DAILY CHART
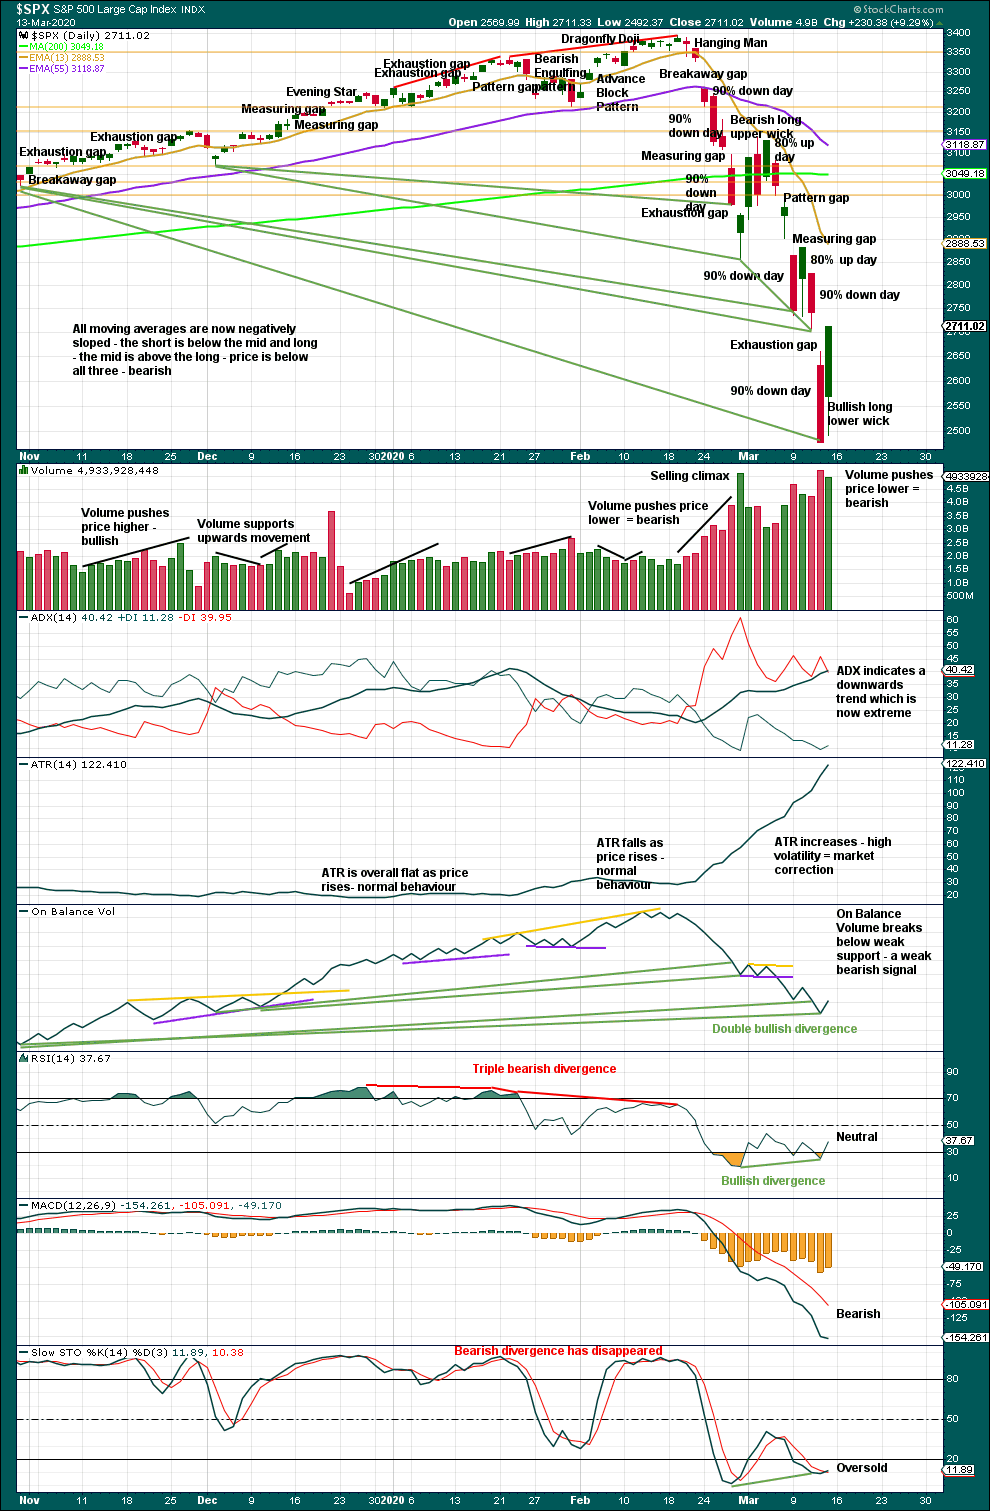
Click chart to enlarge. Chart courtesy of StockCharts.com.
There are now six 90% downwards days in this strong downwards movement.
The following indicators still suggest a low may be in place soon:
– RSI reached deeply oversold and now exhibits short-term bullish divergence with price.
– Stochastics reached oversold and now exhibits short-term bullish divergence with price.
– On Balance Volume continues to exhibit bullish divergence with price.
The following indications will be looked for to provide confidence that a low is in place:
– A 90% upwards day.
– Two back to back 80% upwards days.
– A bullish candlestick reversal pattern.
At the close of Friday, the last gap is closed and has now been renamed an exhaustion gap. The strong close near highs for the session and a bullish long lower wick suggest a longer lasting bounce may have begun here.
Data for Friday is not yet available. If it shows a 90% up day, then a sustainable low may be in place.
BREADTH – AD LINE
WEEKLY CHART
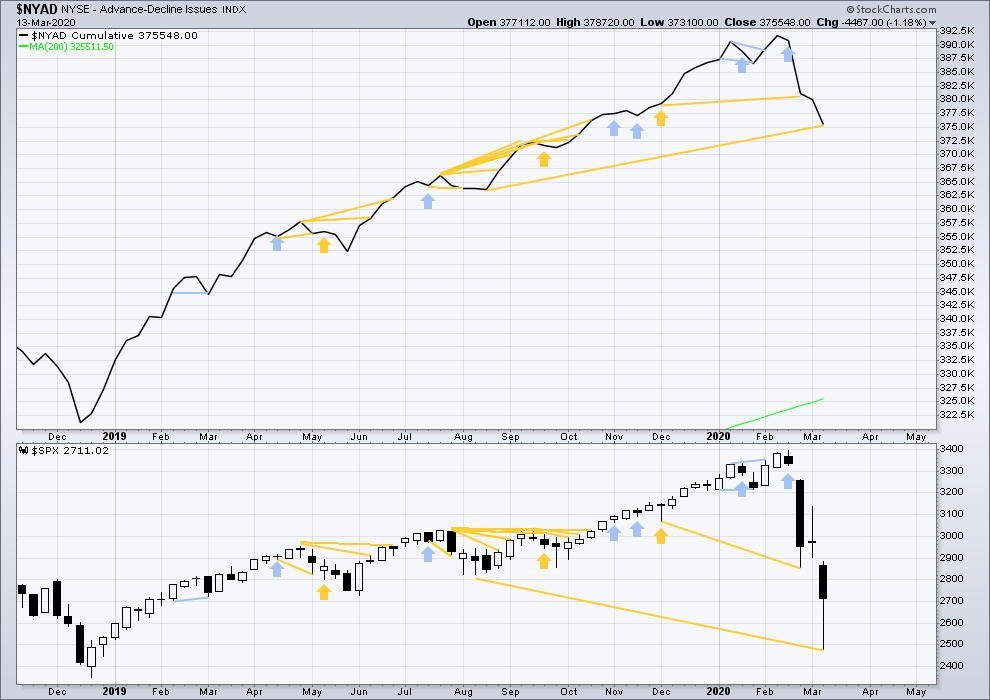
Click chart to enlarge. Chart courtesy of StockCharts.com. So that colour blind members are included, bearish signals will be noted with blue and bullish signals with yellow.
Bear markets from the Great Depression and onwards have been preceded by an average minimum of 4 months divergence between price and the AD line with only two exceptions in 1946 and 1976. With no divergence between the AD line and price at the last all time high, this current bear market now makes a third exception.
In all bear markets in the last 90 years there is some positive correlation (0.6022) between the length of bearish divergence and the depth of the following bear market. No to little divergence is correlated with more shallow bear markets. Longer divergence is correlated with deeper bear markets.
This bear market comes after no bearish divergence. It would therefore more likely be shallow.
This week price makes new lows below prior lows of August 2019, but the AD line has not. This fall in price does not have support from a corresponding decline in market breadth. This divergence is bullish and supports the view that this bear market may more likely be shallow.
Large caps all time high: 3,393.52 on 19th February 2020.
Mid caps all time high: 2,109.43 on 20th February 2020.
Small caps all time high: 1,100.58 on 27th August 2018.
DAILY CHART
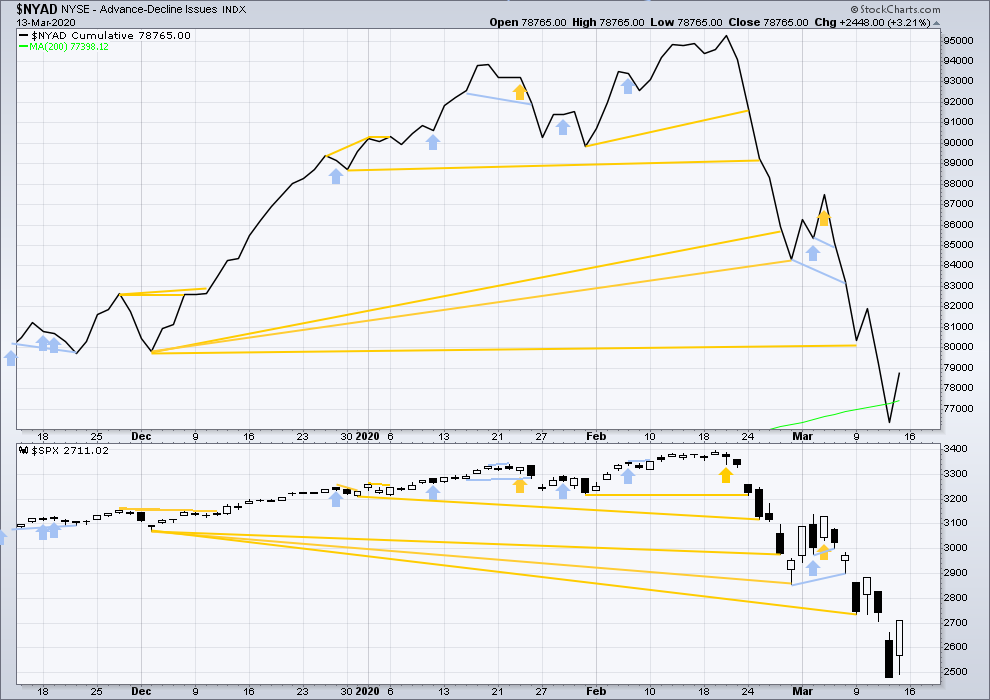
Click chart to enlarge. Chart courtesy of StockCharts.com. So that colour blind members are included, bearish signals will be noted with blue and bullish signals with yellow.
Breadth should be read as a leading indicator.
Both price and the AD line have moved higher on Friday. There is no new short-term divergence.
VOLATILITY – INVERTED VIX CHART
WEEKLY CHART
Click chart to enlarge. Chart courtesy of StockCharts.com. So that colour blind members are included, bearish signals will be noted with blue and bullish signals with yellow.
The all time high for inverted VIX was on 30th October 2017. There is now over two years of bearish divergence between price and inverted VIX.
The rise in price is not coming with a normal corresponding decline in VIX; VIX remains elevated. This long-term divergence is bearish. It may now be resolved by this last fall in price, which meets the technical definition of a bear market.
This week inverted VIX has made new lows below the prior major swing low of December 2018, but price has not. This divergence is bearish and suggests this bear market may not be complete.
DAILY CHART
Click chart to enlarge. Chart courtesy of StockCharts.com. So that colour blind members are included, bearish signals will be noted with blue and bullish signals with yellow.
Both price and inverted VIX have moved higher on Friday. There is no new short-term divergence.
DOW THEORY
Dow Theory would confirm a bull market if the following highs are made:
DJIA: 26,951.81 – a close above this point has been made on the 3rd of July 2019.
DJT: 11,623.58 – to date DJT has failed to confirm an ongoing bull market.
S&P500: 2,940.91 – a close above this point was made on the 29th of April 2019.
Nasdaq: 8,133.30 – a close above this point was made on the 26th of April 2019.
Dow Theory would confirm a bear market if the following lows are made on a closing basis:
DJIA: 21,712.53
DJT: 8,636.79 – a close below this point has been made on March 9, 2020.
S&P500: 2,346.58
Nasdaq: 7,292.22
GOLD
More downwards movement was expected as most likely. A strong downwards session for Friday absolutely fits this expectation.
Summary: A new downwards trend looks most likely to now be in place. A short-term target for a bounce is at 1,464.
Grand SuperCycle analysis is here.
Monthly charts were last updated here.
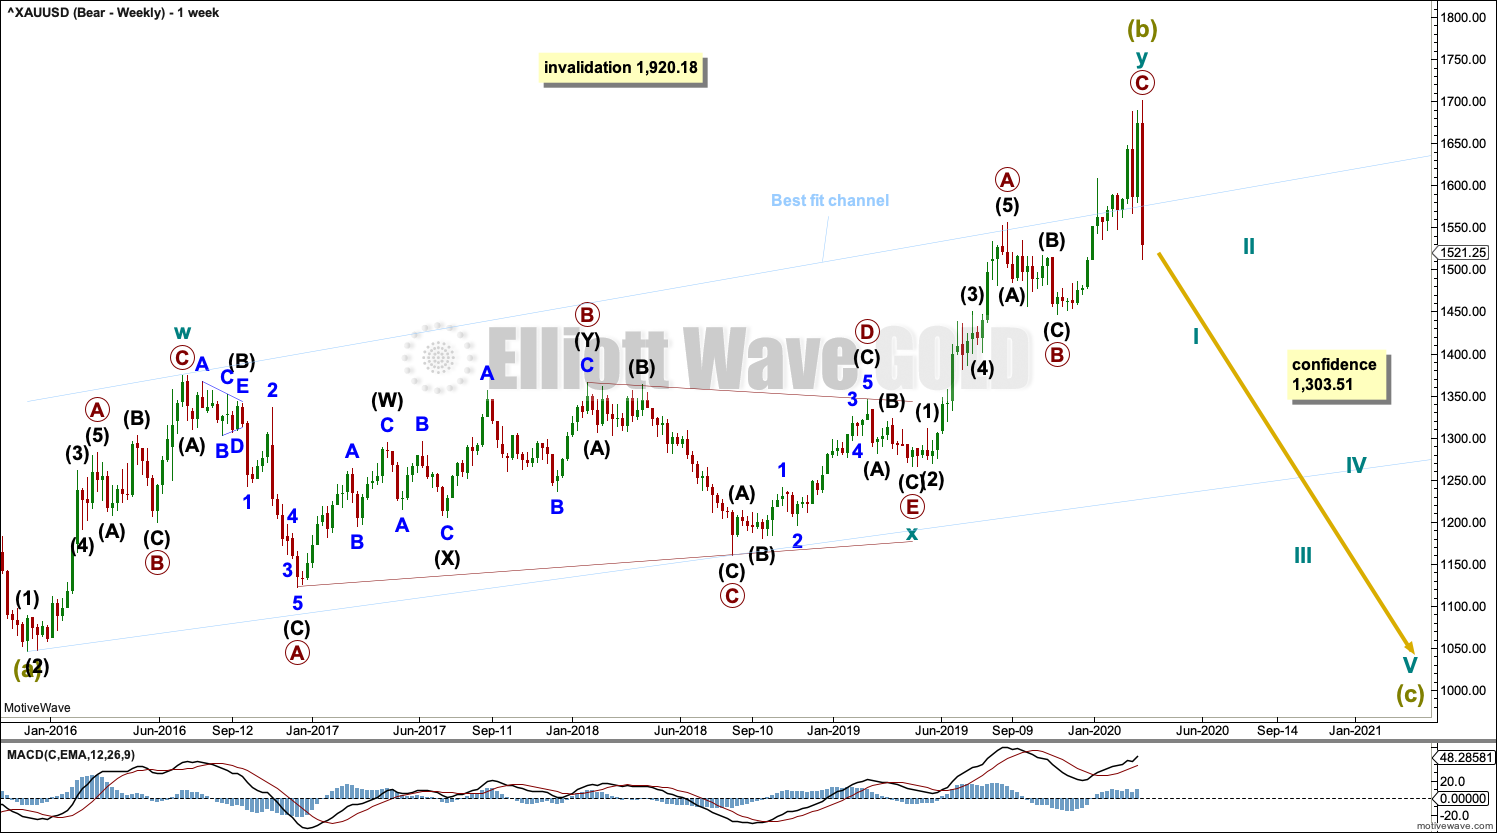
BEARISH ELLIOTT WAVE COUNT
WEEKLY CHART
Click chart to enlarge.
Super Cycle wave (b) may be a complete double zigzag.
The first zigzag in the double is labelled cycle wave w. The double is joined by a three in the opposite direction, a triangle labelled cycle wave x. The second zigzag in the double is labelled cycle wave y.
The purpose of the second zigzag in a double is to deepen the correction. Cycle wave y has achieved this purpose.
A wide best fit channel is added in light blue. Copy this channel over to daily charts. Price has now closed back below the upper edge of this channel.
DAILY CHART
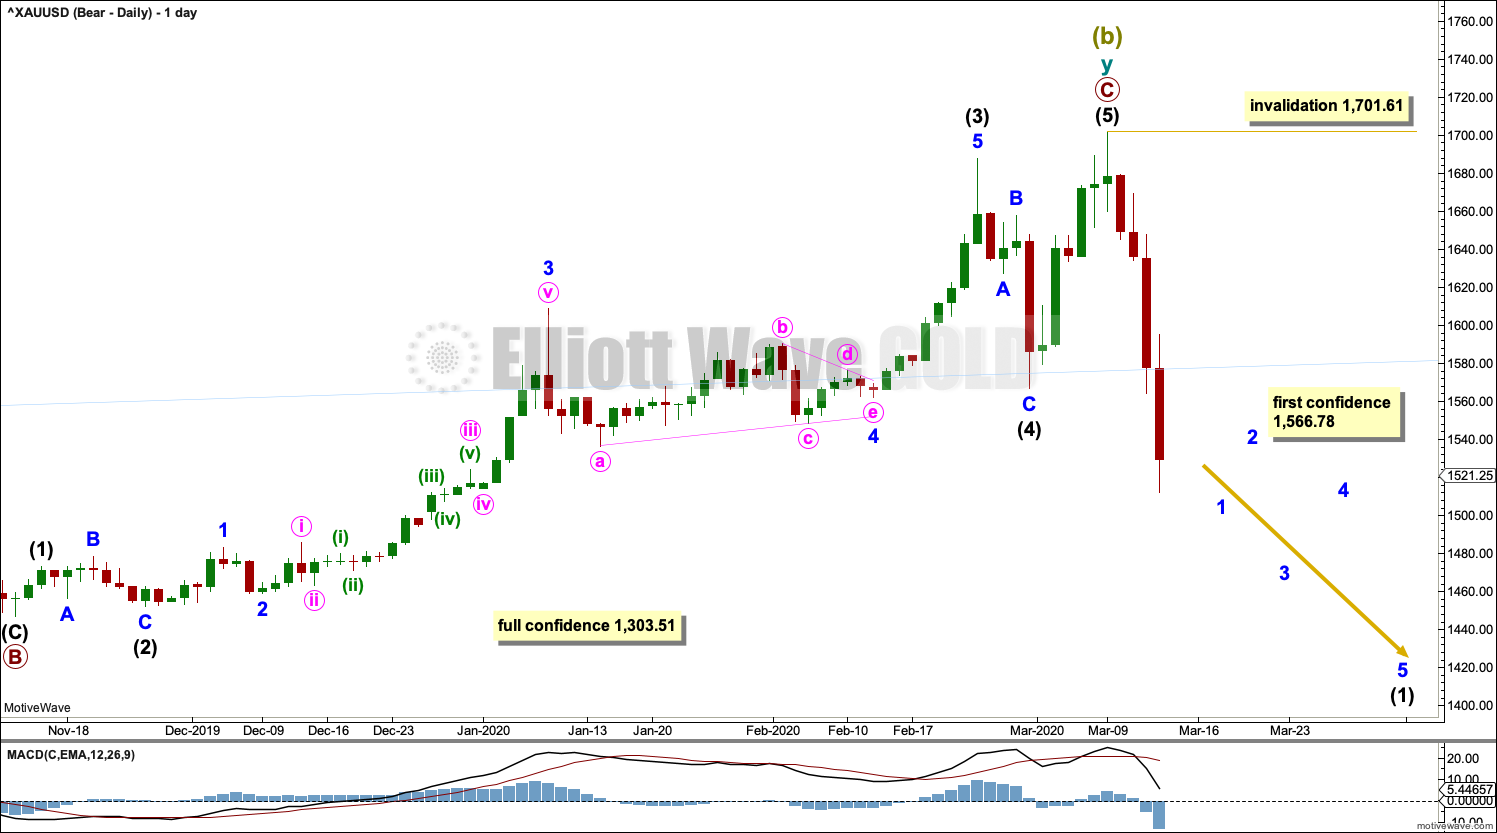
Click chart to enlarge.
Super Cycle wave (b) may be complete.
The second zigzag in the double, labelled cycle wave y, may be complete. There is no Fibonacci ratio between primary waves A and C.
If there was a trend change at Super Cycle degree, then a five down should develop at daily, weekly and monthly time frames. The first five down at the daily chart level will be labelled intermediate wave (1), and it may be incomplete. No second wave correction may move beyond the start of its first wave above 1,701.61.
BULLISH ELLIOTT WAVE COUNT
WEEKLY CHART
Click chart to enlarge.
This wave count sees the the bear market complete at the last major low for Gold on 3 December 2015.
If Gold is in a new bull market, then it should begin with a five wave structure upwards on the weekly chart.
Cycle wave I fits as a five wave impulse with reasonably proportionate corrections for primary waves 2 and 4. This resolves a previous major problem with the bullish wave count.
Cycle wave II now fits as a double flat. However, a problem arises with the relabelling of this structure. Within the first flat correction labelled primary wave W, this wave count now needs to ignore what looks like an obvious triangle from July to September 2016 (this can be seen labelled as a triangle on the bear wave count above). This movement must now be labelled as a series of overlapping first and second waves.
Within the first flat correction labelled primary wave W of the double flat of cycle wave II, intermediate wave (B) is 1.69 the length of intermediate wave (A). This is longer than the common range of up to 1.38, but within an allowable guideline of up to 2. The length of intermediate wave (B) reduces the probability of this wave count.
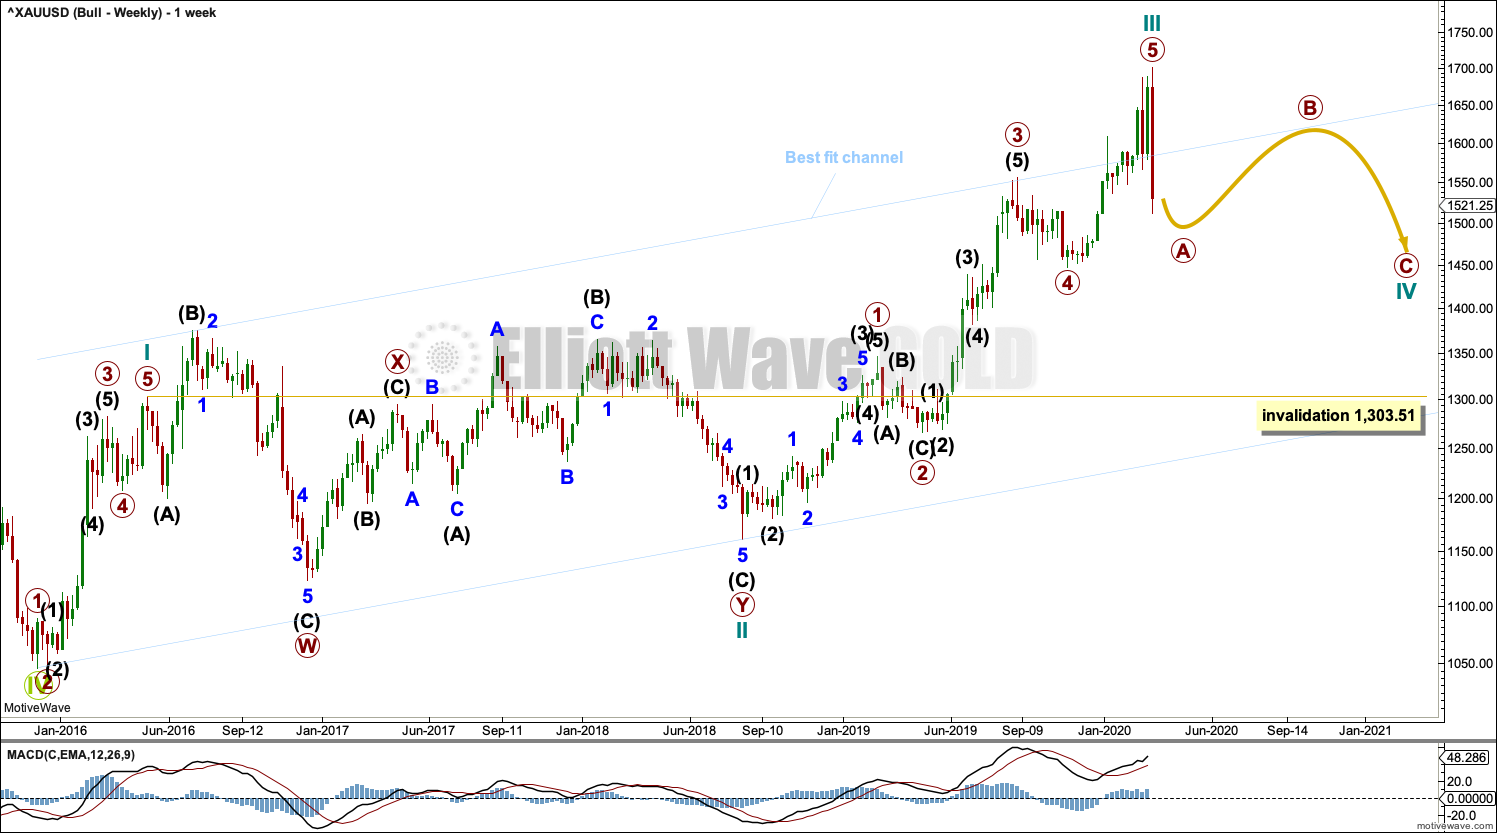
Cycle wave III may be complete. Cycle wave IV may not move into cycle wave I price territory below 1,303.51.
DAILY CHART
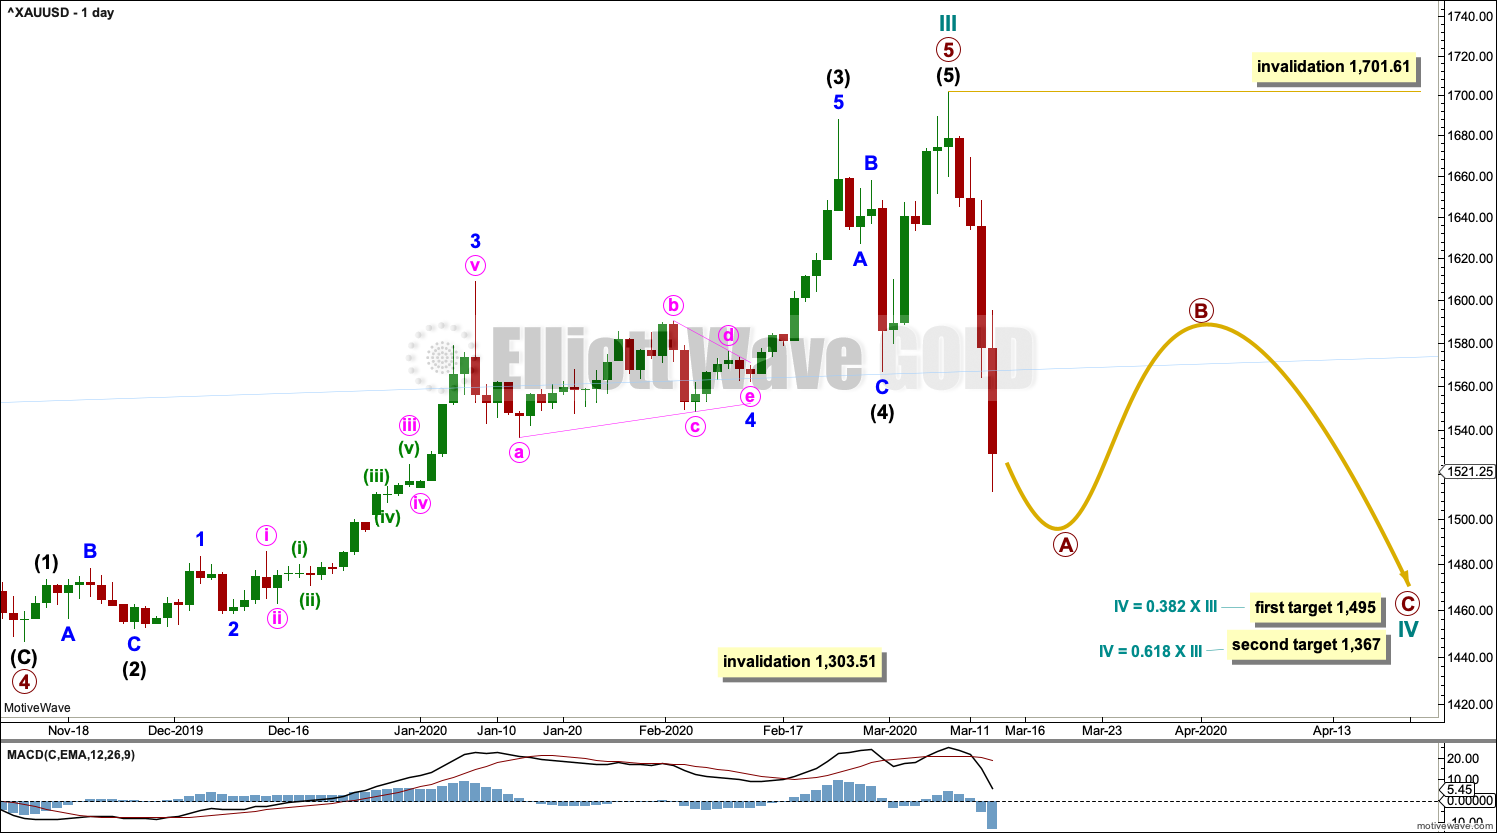
Click chart to enlarge.
Cycle wave III may be complete. Cycle wave IV may not move into cycle wave I price territory below 1,303.51.
Cycle wave II was relatively deep at 0.55 of cycle wave I. If cycle wave IV exhibits alternation in depth, it may more likely be shallow; the first target at 0.382 of cycle wave III would be preferred.
Cycle wave II was a very long lasting double combination. It lasted 119 weeks. Cycle wave IV may most likely be a zigzag, which tend to be quicker structures, but it would still be expected to last several months.
TECHNICAL ANALYSIS
WEEKLY CHART
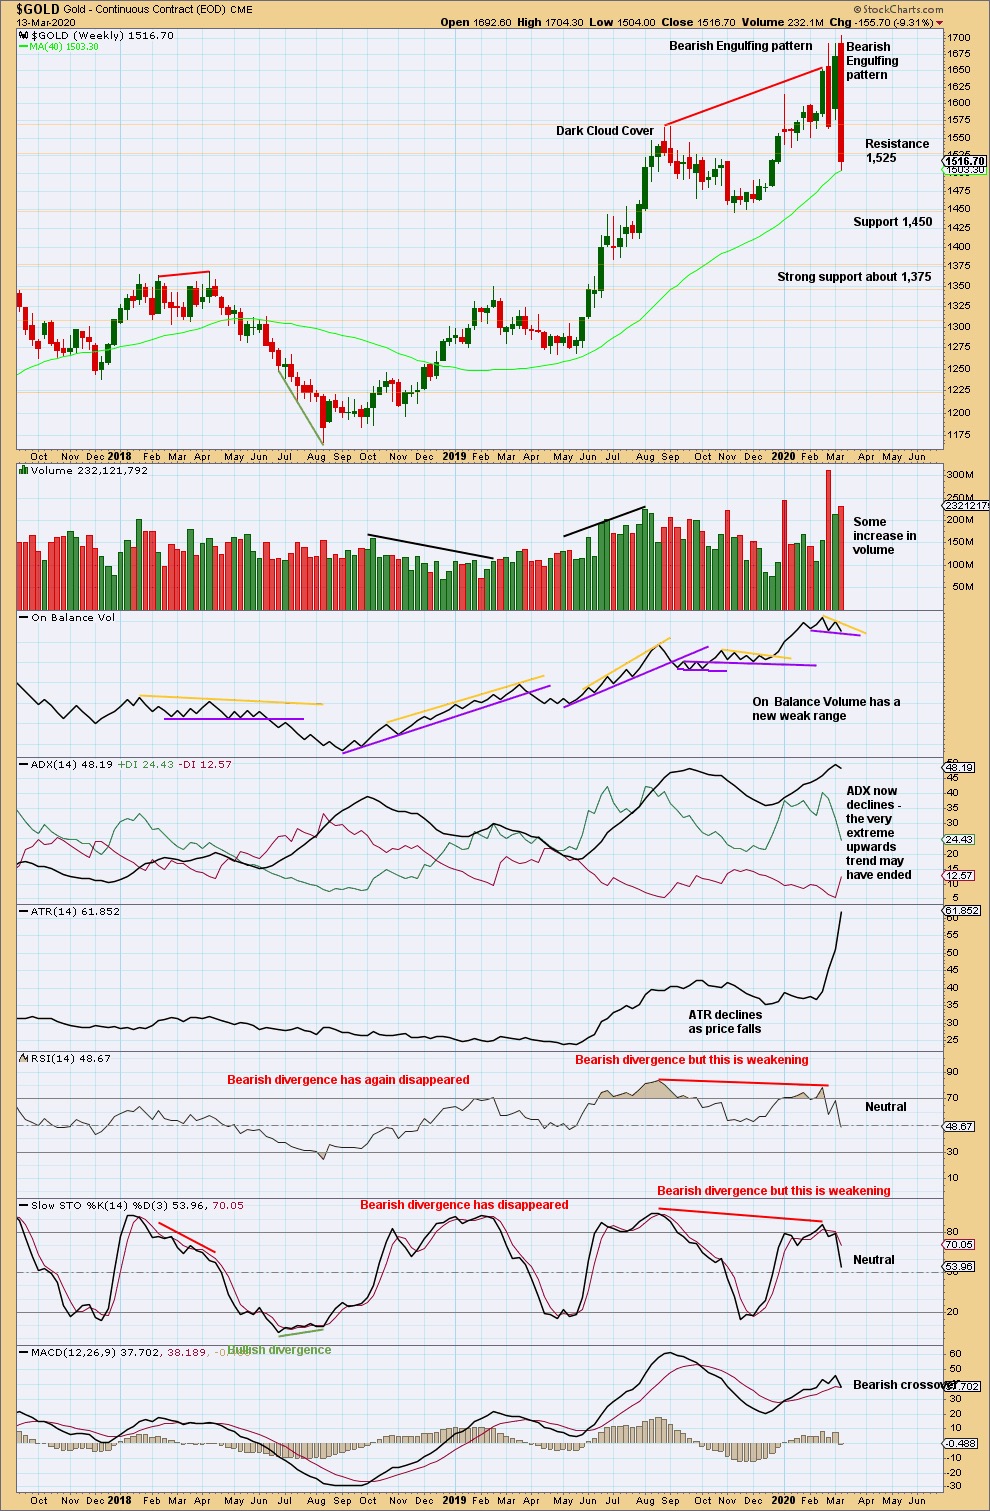
Click chart to enlarge. Chart courtesy of StockCharts.com.
This week’s Bearish Engulfing pattern is extreme. The pattern fully engulfs the prior nine weekly candlesticks, and it has some support from volume. This strongly indicates a trend change after the upwards trend reached very extreme and conditions reached overbought and exhibited bearish divergence.
Price does not move in straight lines. Look out for bounces and consolidations on the way down. Look for support below about 1,450 to 1,455, and below that very strong support about 1,375.
DAILY CHART
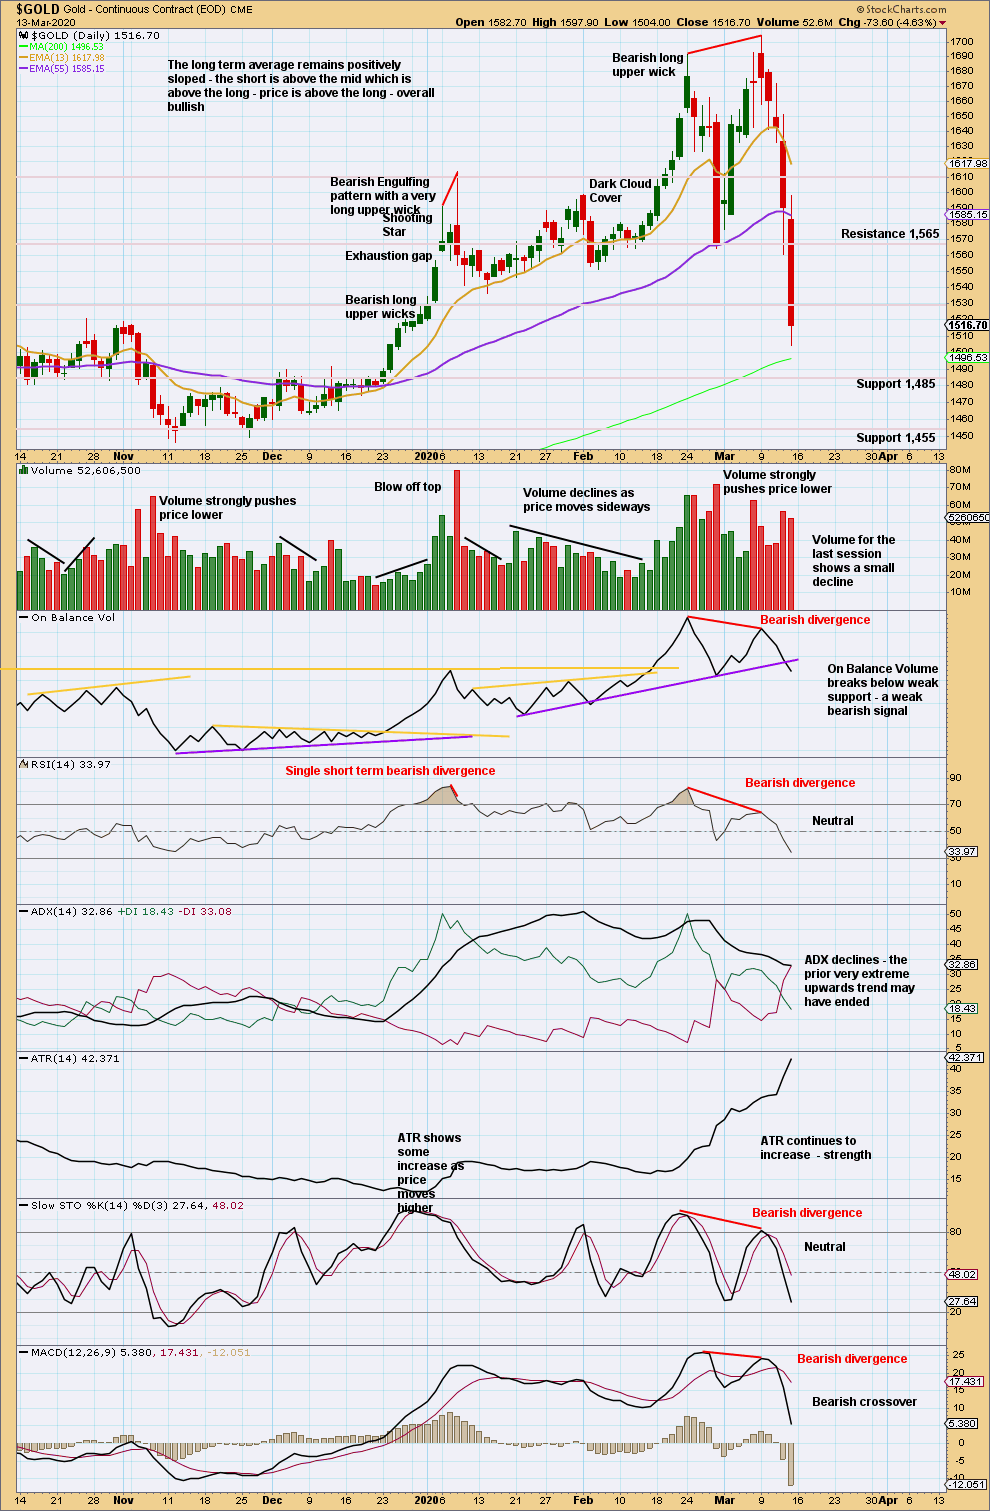
Click chart to enlarge. Chart courtesy of StockCharts.com.
There is now bearish divergence between price and all of On Balance Volume, RSI, Stochastics and MACD. The risk of a trend change to either sideways or a 180° change is high. A new swing low below 1,564 (February 28, 2020) provides some indiction of a possible trend change.
GDX WEEKLY CHART
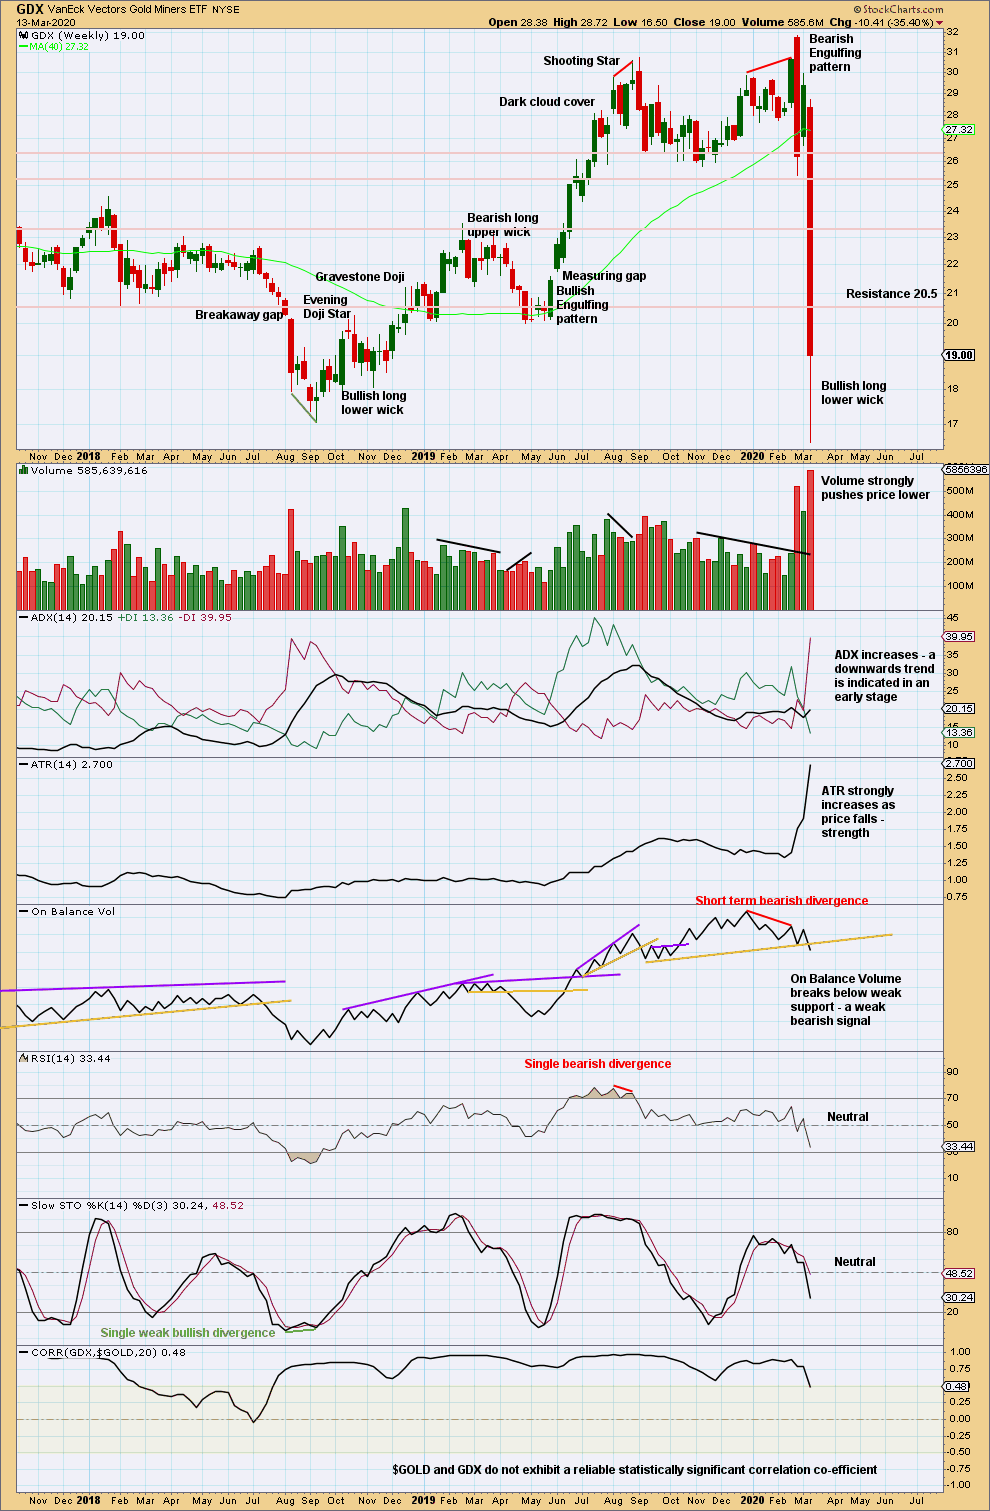
Click chart to enlarge. Chart courtesy of StockCharts.com.
GDX is a reasonable distance off new highs. The last signal was very bearish from a strong Bearish Engulfing pattern.
There is support below in a zone about 16.75 to 15.85.
GDX DAILY CHART
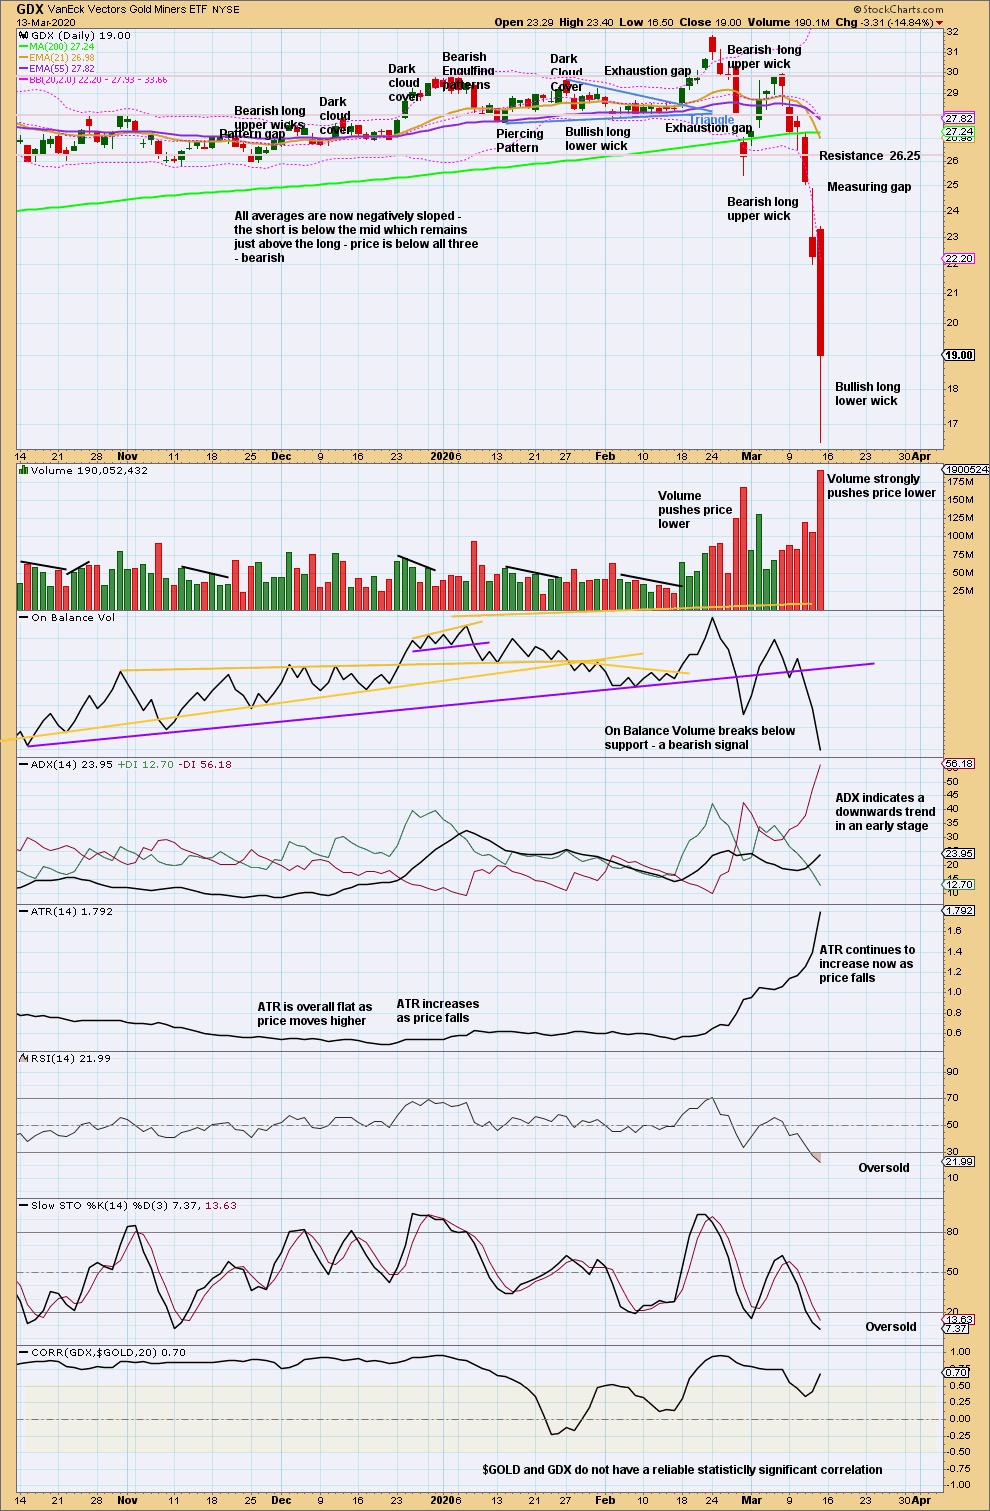
Click chart to enlarge. Chart courtesy of StockCharts.com.
There has been a trend change to downwards. This trend has support from volume pushing price lower and exhibits strength in increasing ATR.
A bullish long lower wick suggests a bounce may come early next week. When price is in a downwards trend, bounces and consolidations may present opportunities to join a trend.
US OIL
A target for support was at 28.24. Oil has fallen to 27.35, where it bounced, which was 0.89 below the target.
Summary: A multi-week interruption to the downwards trend may continue for another few days. Thereafter, the downwards trend may resume to a final target at 9.77.
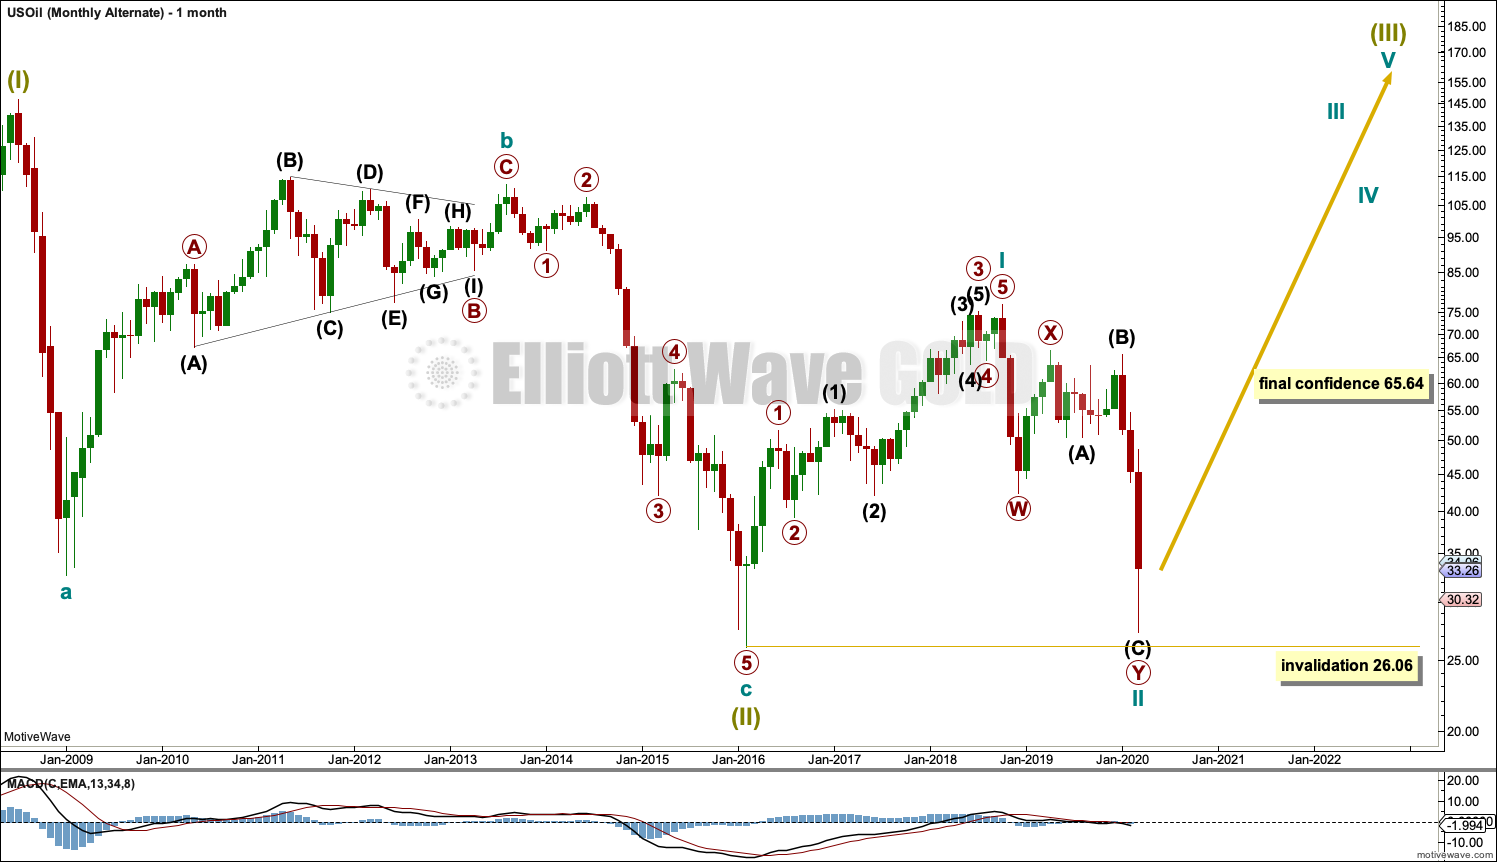
MAIN ELLIOTT WAVE COUNT – BEARISH
MONTHLY CHART
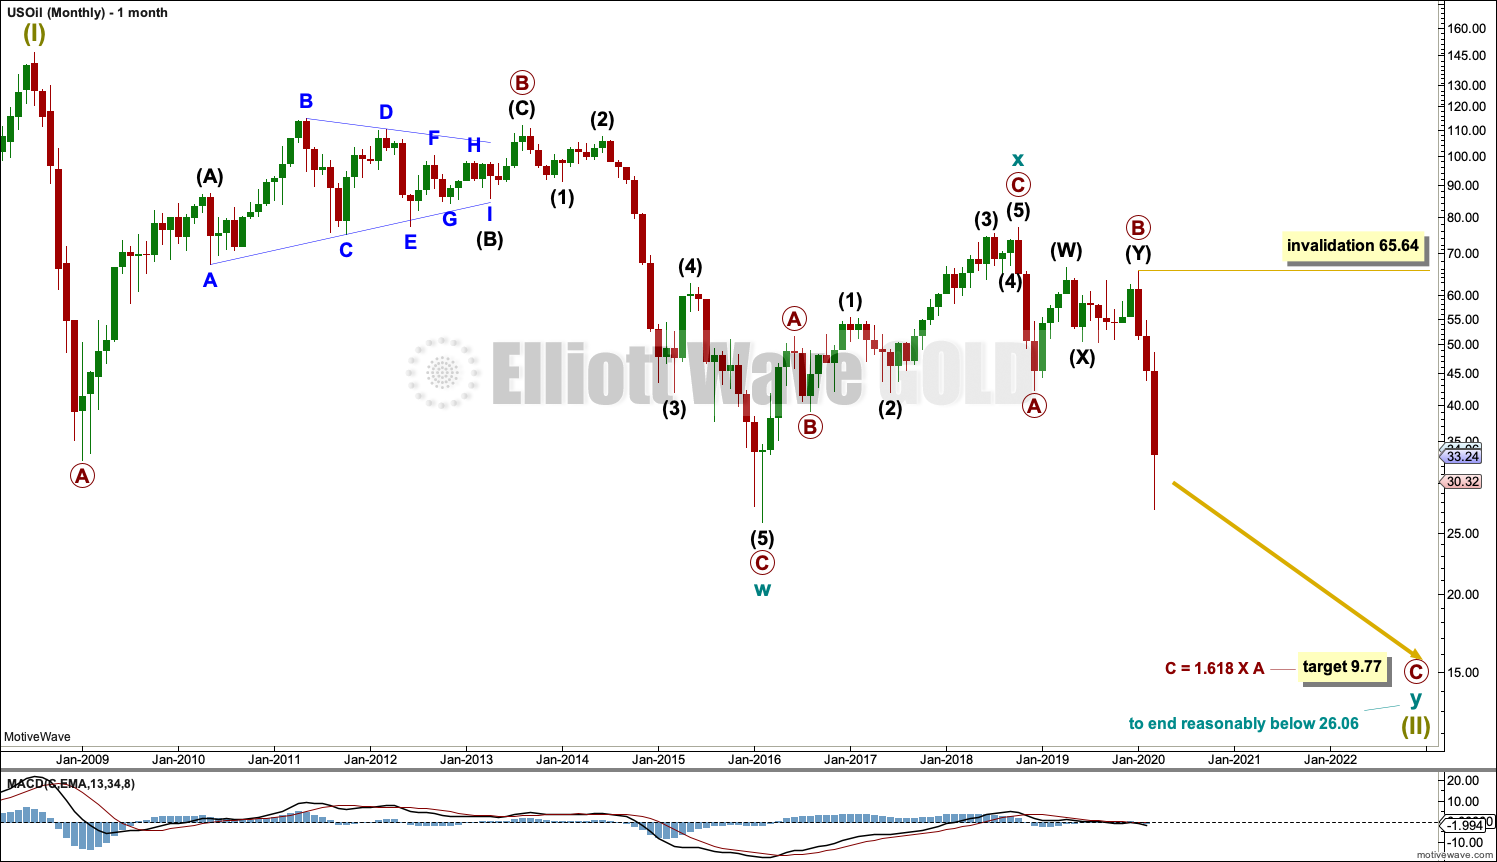
Click chart to enlarge.
The basic Elliott wave structure is five steps forward and three steps back. This Elliott wave count expects that US Oil is still within a three steps back pattern, which began in July 2008. The Elliott wave count expects that the bear market for US Oil continues.
This Elliott wave corrective structure is a double zigzag, which is a fairly common structure. The correction is labelled Super Cycle wave (II).
The first zigzag in the double is complete and labelled cycle wave w. The double is joined by a three in the opposite direction labelled cycle wave x, which subdivides as a zigzag. The second zigzag in the double may now have begun, labelled cycle wave y.
The purpose of a second zigzag in a double zigzag is to deepen the correction when the first zigzag does not move price deep enough. To achieve this purpose cycle wave y may be expected to move reasonably below the end of cycle wave w at 26.06.
Primary wave C would reach equality in length with primary wave A at 31.11. This target is not low enough; it would not see cycle wave y move reasonably below the end of cycle wave w at 26.06. The next Fibonacci ratio of 1.618 is used to calculate a target for primary wave C and cycle wave y to end.
Cycle wave y is expected to subdivide as a zigzag, which subdivides 5-3-5.
Cycle wave w lasted 7.6 years and cycle wave x lasted 2.7 years. Cycle wave y now looks like it may be over within a few more months.
Within primary wave C, no second wave correction may move beyond the start of its first wave above 65.64.
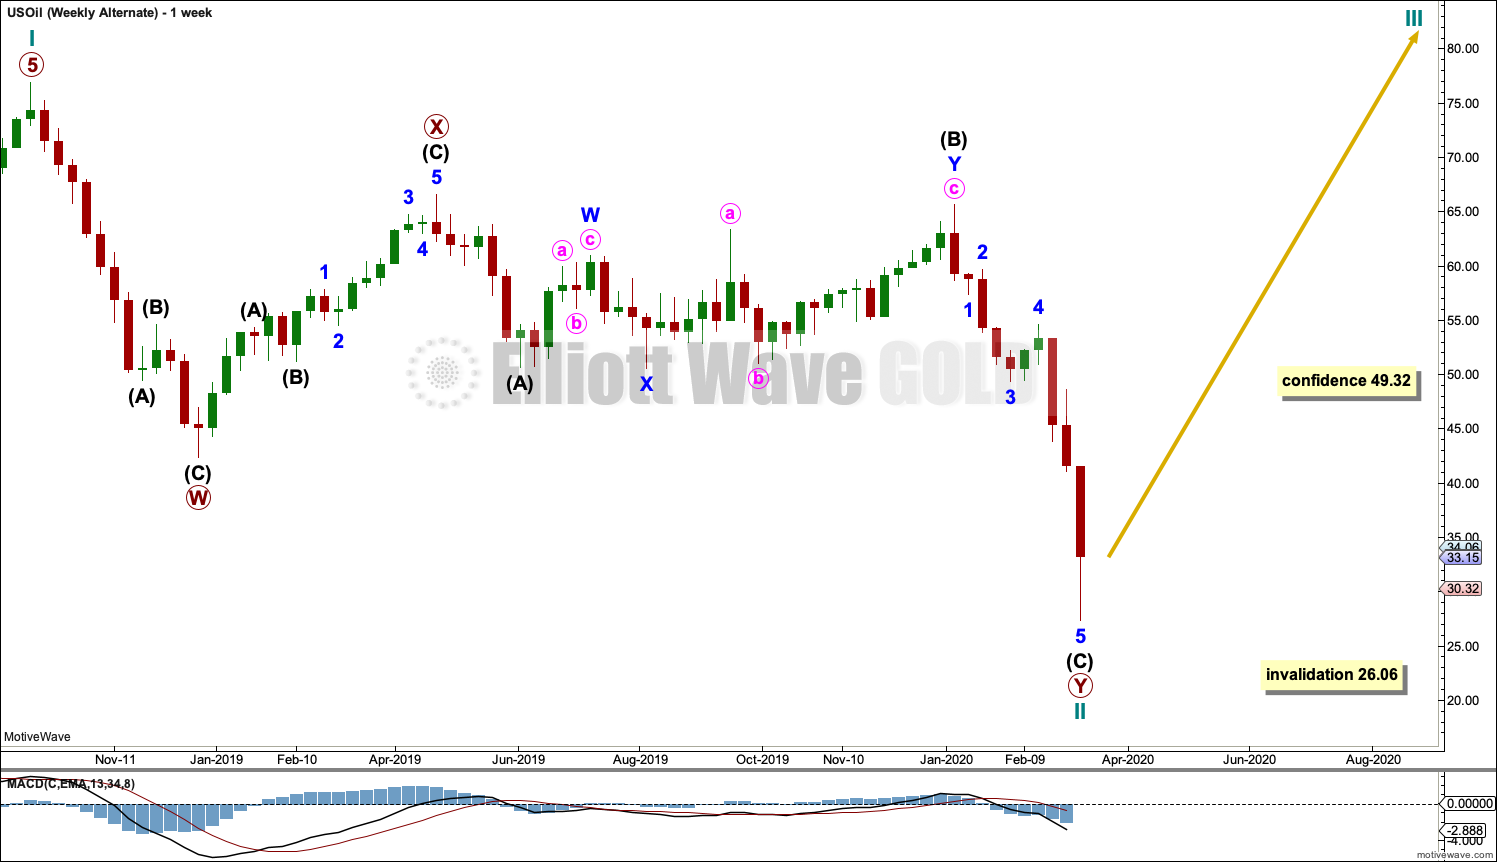
WEEKLY CHART

Click chart to enlarge.
This weekly chart shows all of cycle wave y so far.
Cycle wave y is expected to subdivide as a zigzag. A zigzag subdivides 5-3-5. Primary wave A must subdivide as a five wave structure if this wave count is correct.
Primary wave A may be a complete five wave impulse at the last low.
Primary wave B may be a complete double combination: zigzag – X – flat. Intermediate wave (W) fits as a zigzag. Intermediate wave (Y) may be a complete regular flat correction.
Primary wave C must subdivide as a five wave motive structure, most likely an impulse. Within primary wave C, intermediate waves (1) through to (3) may be complete. Intermediate wave (4) may not move into intermediate wave (1) price territory above 49.32.
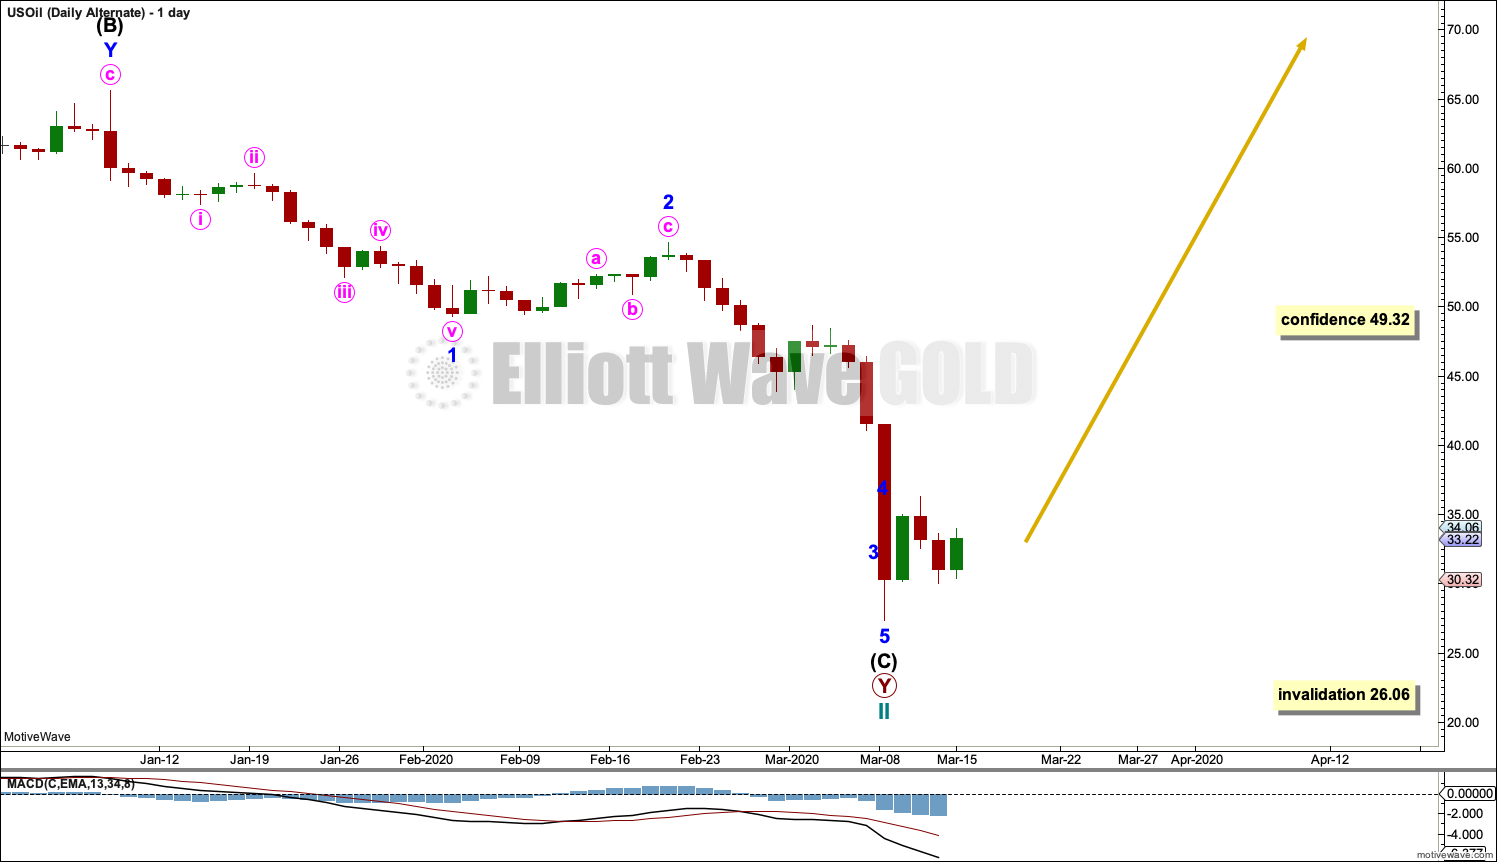
DAILY CHART
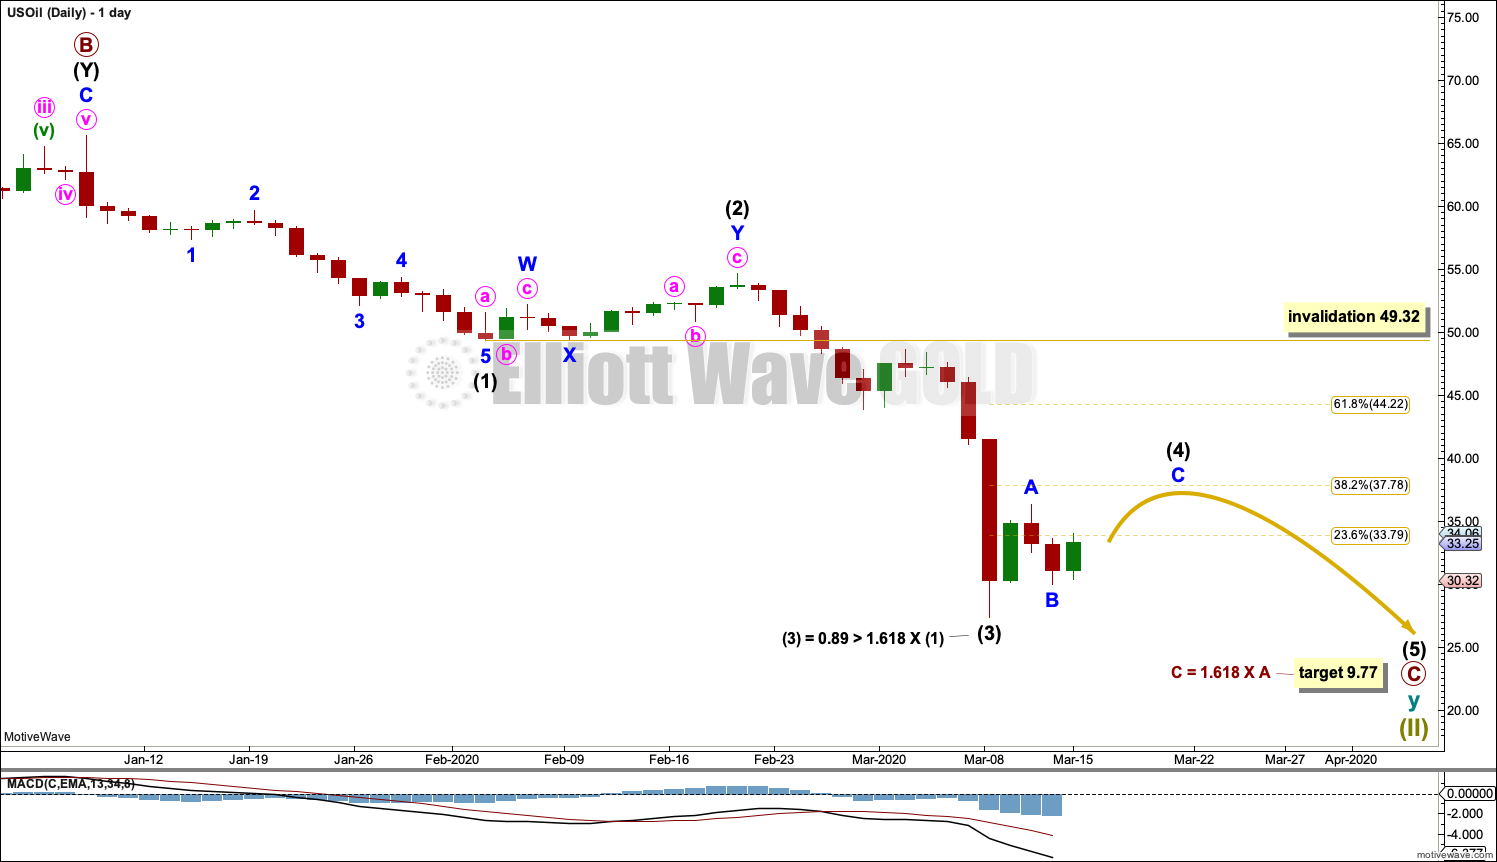
Click chart to enlarge.
Primary wave C must subdivide as a five wave motive structure, most likely an impulse. Within primary wave C, intermediate waves (1) through to (3) may now be complete.
Although it looks like a three wave structure, intermediate wave (3) is labelled as complete. There may have been a quick fourth wave correction that does not show up on the daily chart for minor wave 4. This would be typical behaviour for a commodity.
Intermediate wave (4) may end about the 0.382 Fibonacci ratio of intermediate wave (3). Thereafter, intermediate wave (5) may continue downwards towards the final target.
When intermediate wave (4) may be complete, then the final target may be calculated at intermediate, primary and cycle degrees. At that stage, the target may change or may widen to a zone.
ALTERNATE ELLIOTT WAVE COUNT
MONTHLY CHART
Click chart to enlarge.
It is possible that the bear market is over for Oil and a new bull market has begun.
For a bullish wave count for Oil, the upwards wave from the major low at 26.06 in February 2016 must be seen as a complete five wave impulse. This is labelled cycle wave I.
Cycle wave II may be continuing lower as a double zigzag. Cycle wave II may no move beyond the start of cycle wave I below 26.06.
WEEKLY CHART
Click chart to enlarge.
Cycle wave II may be continuing lower as a double zigzag. The structure may be complete here, or minor wave 5 of intermediate wave (C) may continue lower.
Cycle wave II may not move beyond the start of cycle wave I below 26.06.
DAILY CHART
Click chart to enlarge.
The structure of intermediate wave (C) may be complete. This wave count now requires a new high above 54.65 for confidence.
TECHNICAL ANALYSIS
MONTHLY CHART
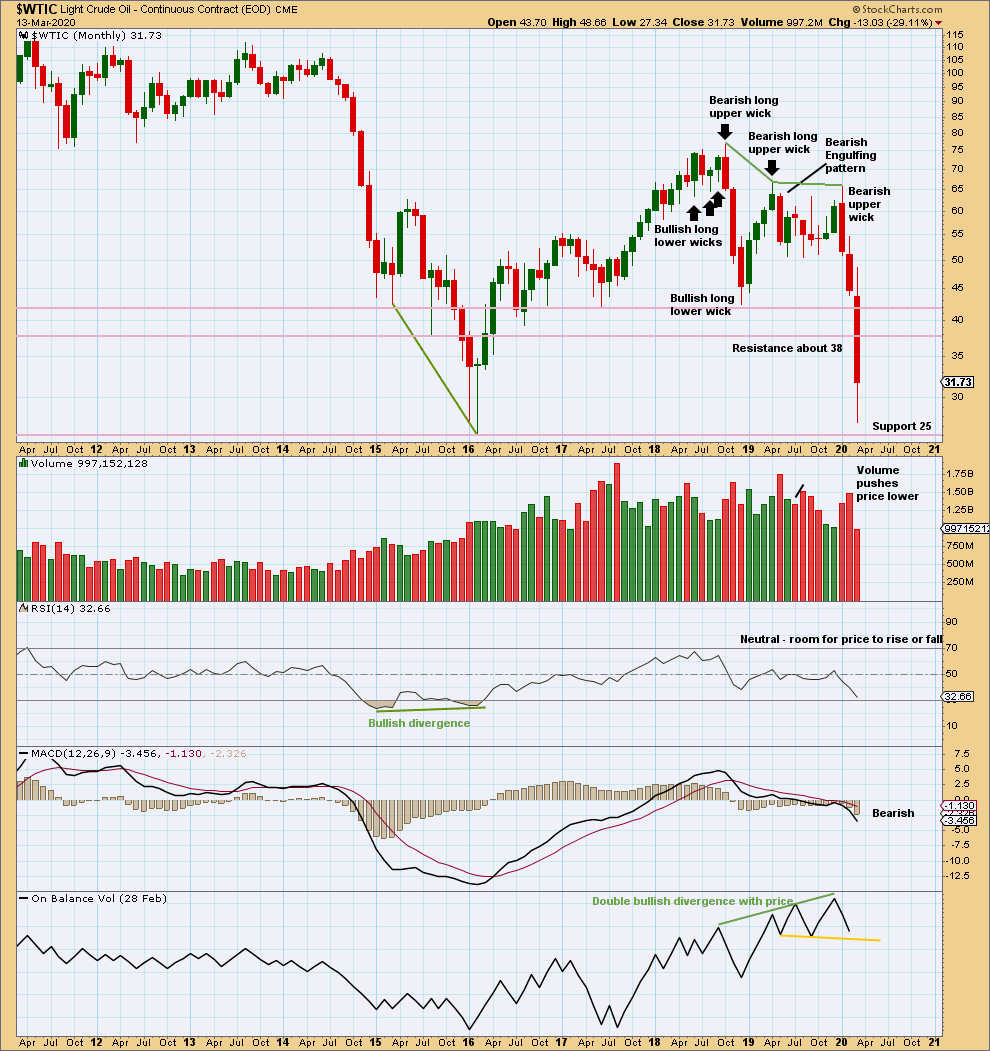
Click chart to enlarge. Chart courtesy of StockCharts.com.
Both January and February have increased range and volume for downwards movement. This supports the main Elliott wave count.
A close below support about 42 on a downwards day with support from volume is significant downwards breakout at this time frame.
WEEKLY CHART
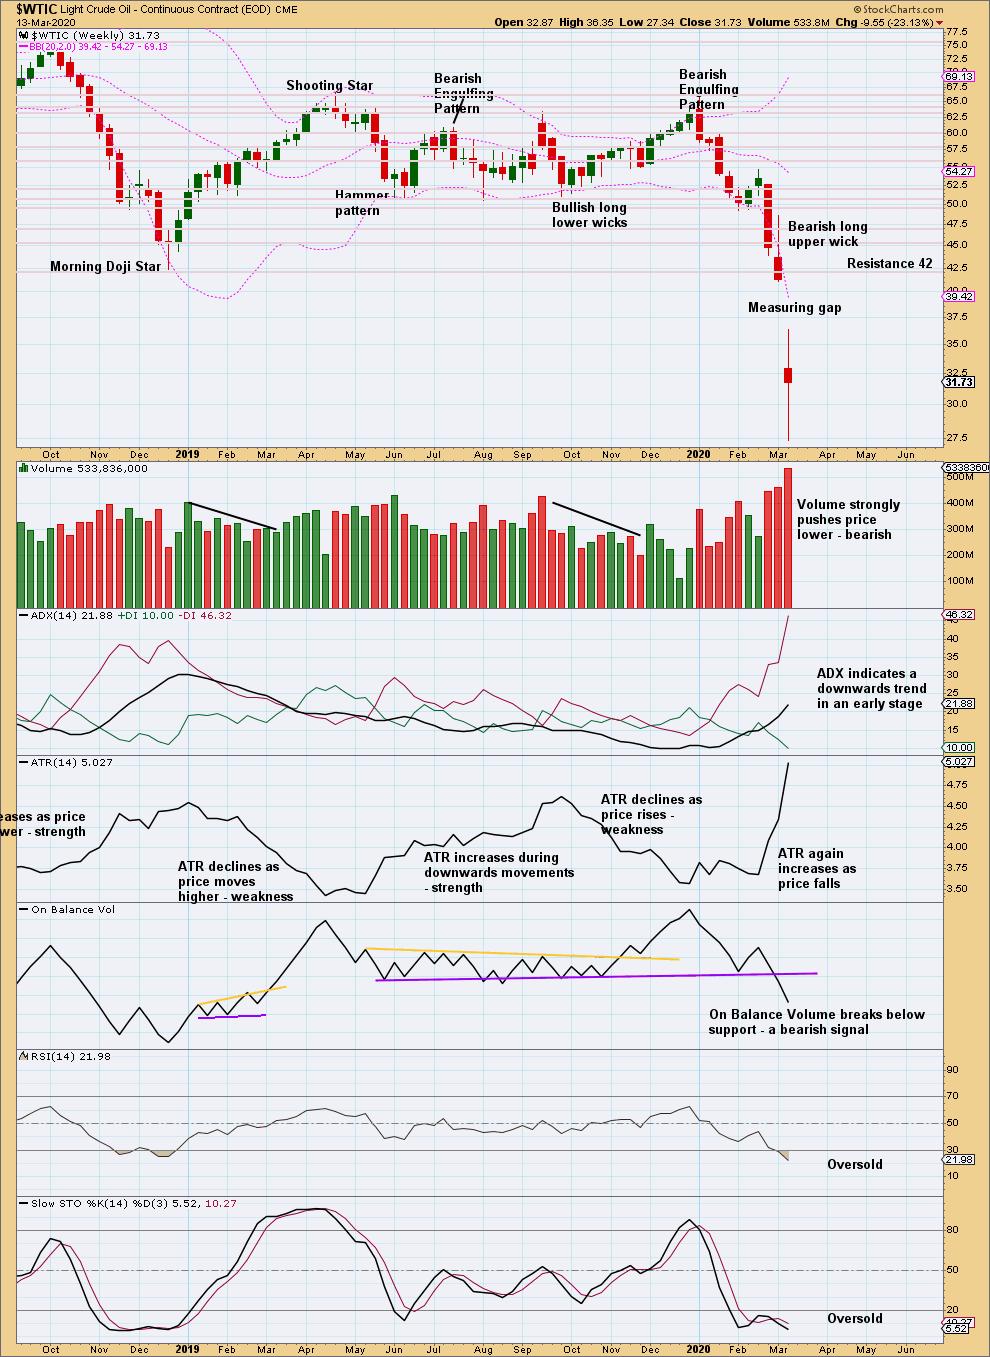
Click chart to enlarge. Chart courtesy of StockCharts.com.
A downwards breakout below prior support about 51 – 50 has been effected. This breakout has support from volume, so some confidence may be had in it.
This week’s measuring gap gives a new target at 22.74.
DAILY CHART
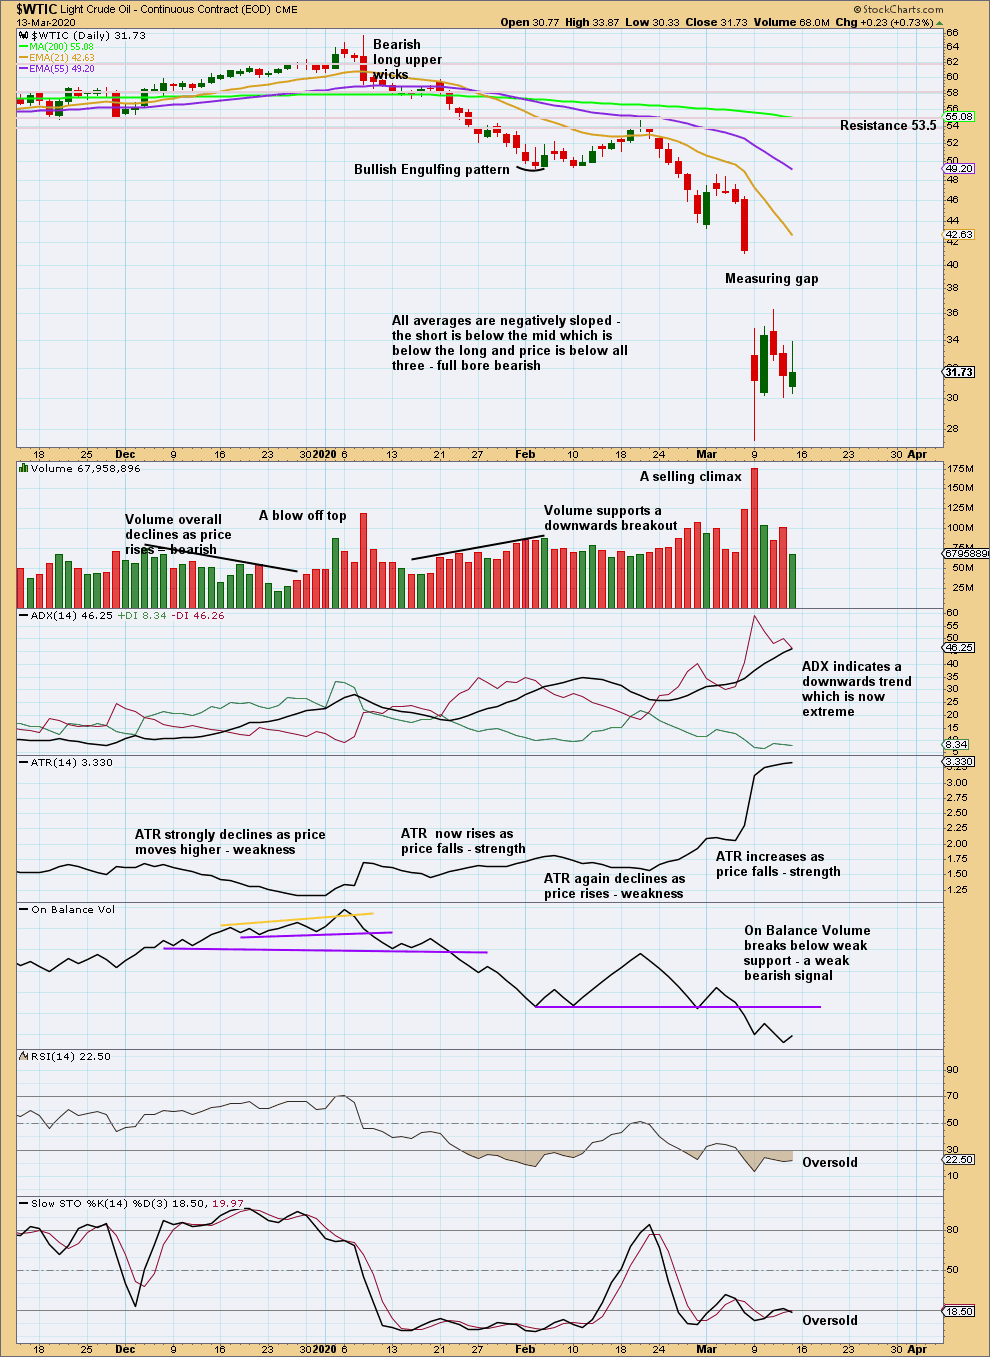
Click chart to enlarge. Chart courtesy of StockCharts.com.
A downwards trend is now in place at both daily and weekly time frames. Both volume and range support this trend.
RSI and Stochastics may remain very extreme for reasonable periods of time when this market trends. ADX may also remain very extreme for reasonable periods of time.
At the daily chart level, the calculation from the measuring gap gives a target at 27.27, which was almost met on the same day of the gap.
—
Always practice good risk management as the most important aspect of trading. Always trade with stops and invest only 1-5% of equity on any one trade. Failure to manage risk is the most common mistake new traders make.
Here is the chart of the expanded flat.
I guess my chart is not loading…. sorry about this … disregard.
Hi Lara,
For the S&P 500, I did some analysis and the chart pattern from October 2018 to today looks like a perfect Expanded flat… What do you think?
The sheer strength of this down move felt like a C wave of an Expanded Flat than an A wave… The down move was as big as the 1929 and 2008 crashes…. I don’t think we can repeat a move like that again soon…
Thanks and I appreciate your time in responding my comments.
Mathieu
Notice to members regarding comments:
We will be switching over to Disqus tomorrow for comments. This should be much better for you all.
If you don’t have a Disqus account I think you’ll need to create one.
This will take effect for the next Lara’s Weekly report.
Disqus will be in be installed today, an update to this website has broken the function allowing us to upload charts.
Disqus will resolve this problem.
Hi Lara,
(S&P 500) It looks like intermediate wave 5 is a diagonal…
Is it possible?
Thanks
Mathieu
So far I’ve charted minor 1 within intermediate (5) as a leading contracting diagonal.
If intermediate (5) is an ending diagonal then all subdivisions must be zigzags.
Now, I could be wrong, but I”m having a hard time seeing minor 1 and 2 both as zigzags. It looks like intermediate (5) is continuing lower as an impulse.
a very tight diagonal
It had an overflow before the late rebound….
I hope it is an ending diagonal…
Hi Lara,
I am struggling with the Elliott Wave count of the S&P 500…
Is possible it to send us what you have currently?
Thanks
Mathieu
Hi Lara,
Another question….
I saw that from the response of Ron below that 1705 is becoming more likely by the day…
If that’s so, it would be the biggest exception to the Market Breath rule…Correct? We wouldn’t have a shallow bear market anymore as we would be down 50%….
1946 and 1976 were the other exceptions…
This is crazy that we did not have any warnings or indications in the charts to get us out of this….. Unbelievable…
I did not see that coming in the charts….
That wave from the Christmas low to the high at 3393 look like a 3 wave structure…..
Very unfortunate.
Thanks for everything you do,
Mathieu
This is the daily chart right now for the S&P. Yes, the 1,708 target is now the main target for the eventual low.
Short term a new target at 2,173 for a major bounce / consolidation.
However, if in the interim price makes a new high by any amount at any time frame above 2,711.33 then I will label primary A over and primary B underway.
There were two historical examples of bear markets which began after less than 4 months of divergence between price and breadth, and both were shallow. So yes, this current bear market may be the first exception to the expectation of a shallow bear market following zero divergence with breadth.
However, so far it’s less than 30% of market value, so far it is shallow. My target may be too low.
Thanks Lara, very very much appreciated.
I analyzed the Apple chart… It looks very strong and resisting the downside very much….
QQQ is outperforming the S&P 500 in the last couple of days…
I am bullish overall.
Hi Lara,
For Oil, you mentioned that “The purpose of a second zigzag in a double zigzag is to deepen the correction when the first zigzag does not move price deep enough. To achieve this purpose cycle wave y may be expected to move reasonably below the end of cycle wave w at 26.06.” Would the zigzag still be valid if cycle wave y is ending here without going below 26.06? Or is it a rule that wave y must end below 26.06? (although we are already very close to that price as we speak.) I am asking because it looks like intermediate wave 4 might be completed and wave 5 could be completed anytime now that price has fallen below wave 3. Thank you so much.
Well, technically yes, it would be valid, because it is a guideline not a rule that y should move reasonably beyond w to deepen the correction.
Very rarely y may not move beyond w and the effect is the same as a truncation (although truncation refers correctly only to C and 5th waves).
It would be highly unusual. The wave count wouldn’t have the right look. So I wouldn’t publish the idea.
Yesterday a substantial number of Gold miners sprang up to life, even before gold. Today they are all up in unison. In the recent past, I have seen miners mostly lag gold. Does it seem different this time or is it my imagination?
I remember somebody here saying that when miners lead gold in an upswing, it portends a stronger up market for gold.
Any ideas??
Miners do currently seem to be leading.
But the markets are not reliably correlated. Any correlation they have from time to time may not be assumed to continue, the math shows it does not.
Thank you Lara.
How do I check on stockcharts that Friday was a 90% upday?
It’s approximate on Stockcharts.com…. It has the advance – decline numbers but not the volume like Lara said.
I get this info from my subscription to Lowry’s data. They have Operating Companies Only data which shows Friday was a 90% up day. Yet price continues to fall.
There is precedent for this behaviour in the bear market from 2007 to 2009. This market is currently vulnerable to massive whipsaws.
I’m going to move to a more conservative approach now to identifying a low in place. I will wait to see a 90% down day followed within three sessions by a 90% up day or two back to back 80% up days, a complete Elliott wave structure for the bear market and then finally and most conservatively a breach of a channel containing the bear market.
can we short TBONDS NOW!
Lara,
In the daily chart of the Main Count for SP500, waves 2 and 4 do not have proportionality. I went into the 4hr and then to the 1 hr time frames and to my untrained eye it makes it look like a w-x-y in those lower time frames. Kindly help me understand when we should look for proportionality and when we should ignore it, please.
Thank you.
I’m assuming you’re referring to intermediate (2) and (4) within primary wave A.
I’ll provide the hourly chart so you can see exactly how I’m counting those subdivisions.
The problem of proportionality is as you’ve identified one of the key issues with Elliott wave, it’s the hardest to get right, and as you have seen with my analysis at the last all time high of the S&P I did not get that right. And that’s after a decade of Elliott wave analysis on that specific market!
Normally the S&P has reasonable proportion at higher time frames. But not always. The wave up labelled primary 5 on the weekly chart has disproportionate intermediate waves (2) and (4), and that was the thing that led me to expect this current fall in price would be much more shallow.
When the S&P has bear moves it can behave more like a commodity. They tend to have more time consuming second waves, and more brief fourth waves. Because the third wave ends very swift and strong, forcing the fourth wave just after it to be brief and shallow. I think that’s what may have happened to intermediate (4) on this hourly chart.
I have intermediate (2) a zigzag lasting 18 hours, and intermediate (4) a flat lasting 4 hours.
Hi Lara,
This is the SPX chart from 2009 bottom. So far 38% retrace. Is it possible to go lower to 50% retrace to end the recent correction? You have highlighted second target as 1700 area which would be 61.8% retrace. But why not consider 50% level? Any specific reason? Thanks for your help. There is so much to learn here.
I’ve calculated so far from the all time high to the close today a 29.7% fall in price, so the 0.382 Fibonacci ratio is not quite yet met. But it’s very close.
I don’t consider the 0.5 ratio simply because it is not mathematically correctly a Fibonacci ratio.
My next target at 1,708 is increasing in probability, and may now actually be more likely. In todays analysis of the S&P500 over at Elliott Wave Stock Market it is now the preferred target.
Thanks Lara!. That would be awesome level to go long again. Hope we get there in couple of weeks.
Thank you Lara – for your patience and for sharing your expertise. Also, thank you for your extra help in providing the hourly chart. I can see the waves clearly there (after you have marked them, of course !!) which I did not in Tradingview.
I have learnt so much EW here in the 2 short years, thanks to you.
Sincerely appreciate your help, as always.
You’re most welcome Dave
Hello everybody. I do recommend for those of you who don’t like watching video (that includes myself) you may want to make an exception for this week’s S&P video.
If Friday turns out to be a 90% up day, then the new main wave count may label cycle wave II over at the last low. That’s very bullish.
Now, I know that may be a wildly unpopular view amongst traders, after the velocity of the fall in stock markets over the last couple of weeks and concern over Covid-19. But I’m gonna go with the math and data, I’m not here to win a popularity contest, I’m here to try and be right more often than wrong 🙂
Funny about watching videos !!!
Actually I am with you in thinking that cycle wave II might be over at the last low. Btw, what does “90% up day” mean? 90% of market being up?? And what chart or data can I use to see that, please?
Thank you for always being objective and for being a great teacher.
A 90% up day is a day where 90% (or more) of total up/down volume was up, and where 90% (or more) of total advances/declines were advances.
Those two criteria must be met.
Thank you kindly.
Hi Lara,
I agree with you…
The long term PPO indicator (PPO(200,440,150) in stockcharts.com) is still very positive… There is a chance that we have a V shape because of this….
I personally bought a lot on Thursday.
Dave, a 90% up day is Market Breath where 90% of the stocks are up during that day…. Stockcharts.com does that work…
All the best,
Mathieu
Thanks Mathieu. I shall check it out on Stockcharts.com.