
SILVER: Elliott Wave and Technical Analysis | Charts – February 14, 2020
A downwards week closes green and sees price remain again above the short-term invalidation point and within the channel.
Summary: The target for upwards movement to end is still at 21.375.
An alternate wave count looks at the possibility that Silver may have found a high at the same time as Gold. Confidence in this view may be had if price makes a new low below 16.523. This idea would be invalidated if price makes a new high above 19.628.
ELLIOTT WAVE COUNTS
Last updated monthly charts may be found here.
BEARISH WAVE COUNT
WEEKLY CHART
Click chart to enlarge.
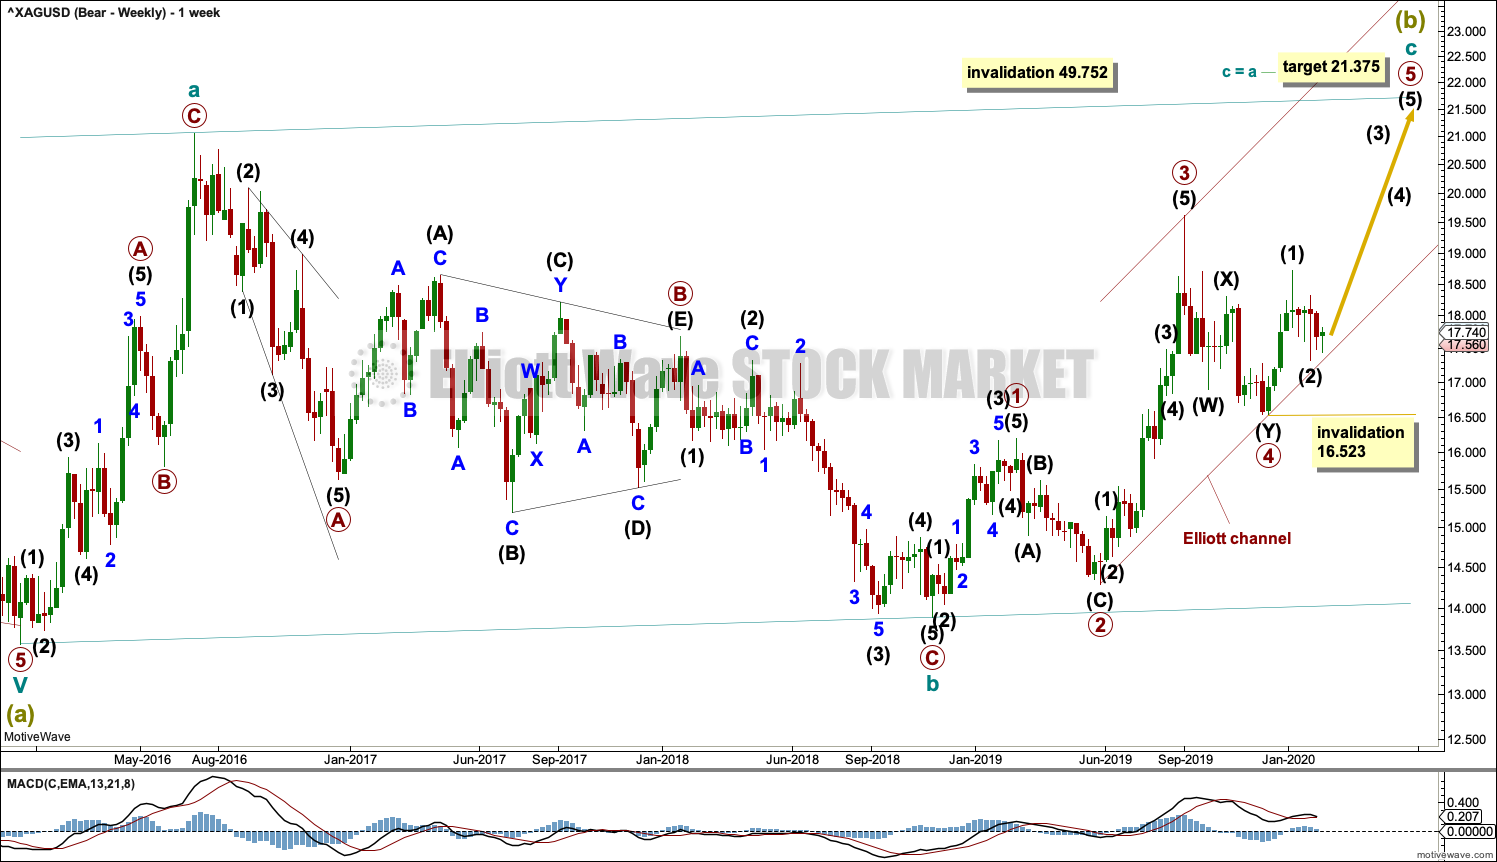
Super Cycle wave (b) may be an incomplete regular flat correction.
Within the regular flat correction, cycle wave a subdivides well as a zigzag and cycle wave b subdivides well as a zigzag, which is a 0.96 correction of cycle wave a.
Cycle wave c must complete as a five wave structure. Within cycle wave c, primary waves 1 through to 4 may be complete. Within primary wave 5, no second wave correction may make a new low below the start of its first wave below 16.523.
Regular flat corrections often fit within parallel channels. Cycle wave c may end about resistance at the upper edge of the channel. The most common Fibonacci Ratio for cycle wave c within a regular flat would be equality in length with cycle wave a.
It would be extremely likely, for this wave count, for cycle wave c to move at least slightly above the end of cycle wave a at 21.062 to avoid a truncation.
Primary waves 1, 2, 3 and 4, within cycle wave c, all lasted 14 weeks, one longer than a Fibonacci 13.
DAILY CHART
Click chart to enlarge.
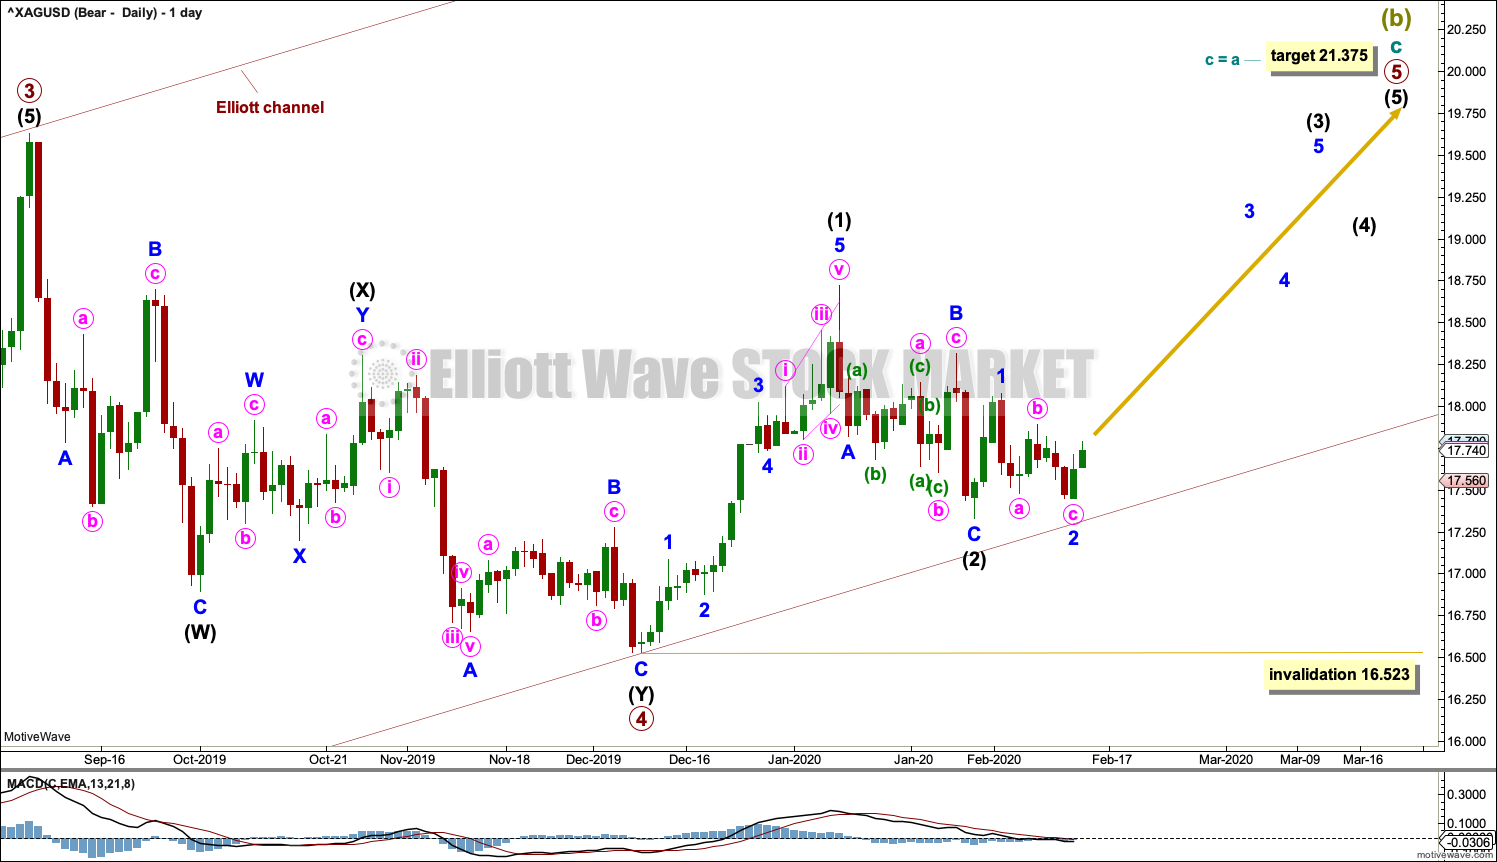
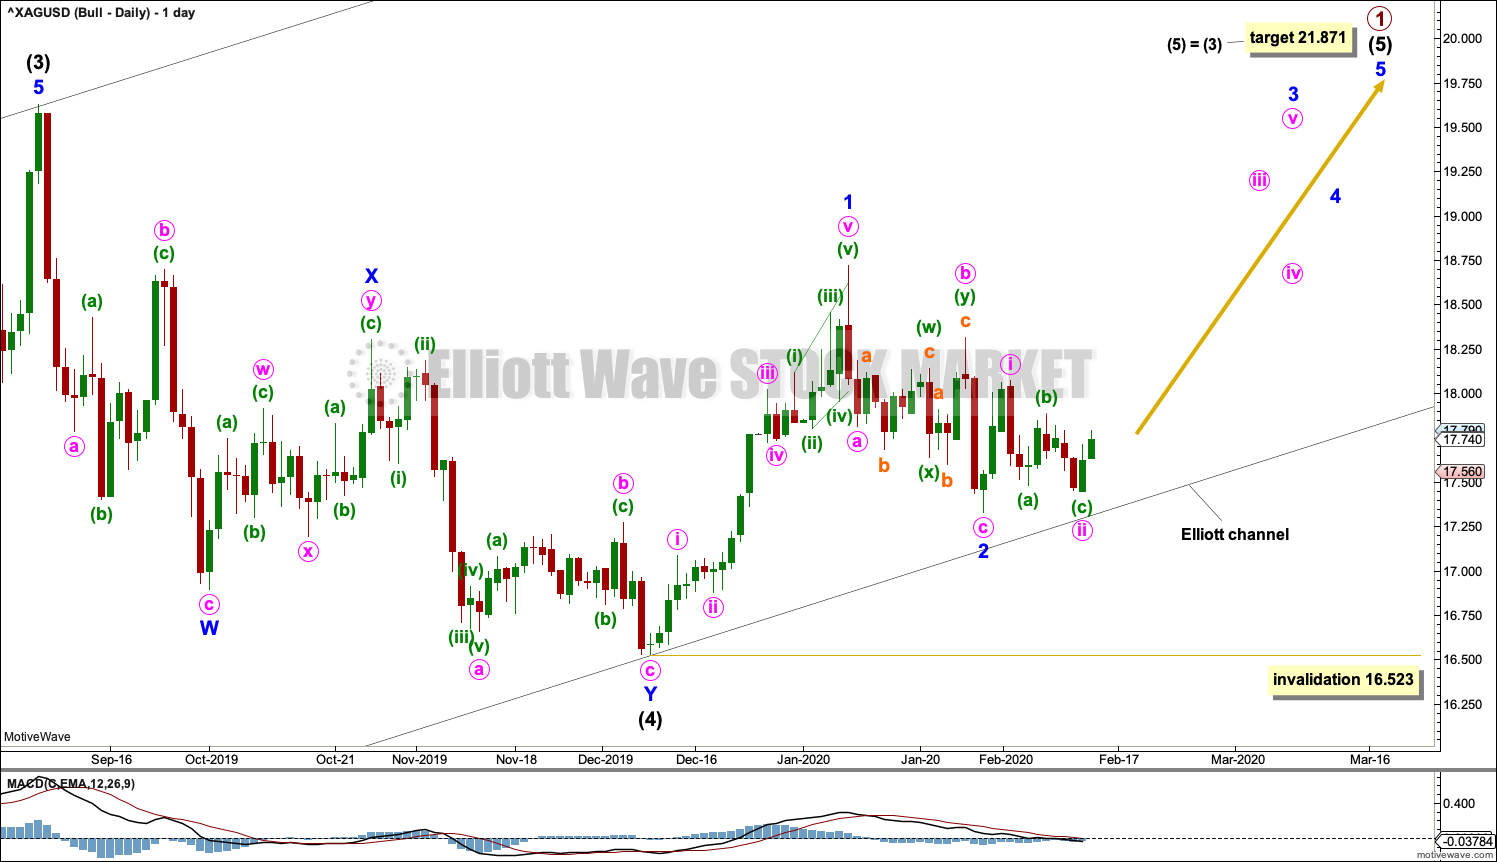
Cycle wave C may be subdividing as an impulse. Within the impulse, primary waves 1 to 4 may be complete.
Primary wave 5 must subdivide as a five wave structure. Within primary wave 5, so far intermediate waves (1) and (2) may both be complete. Within intermediate wave (3), minor waves 1 and 2 may be complete. If it continues further, then intermediate wave (2) may not move beyond the start of intermediate wave (1) below 16.523.
This wave count now expects upwards momentum to increase as intermediate wave (3) continues. A target is not calculated for intermediate wave (3) to end as intermediate (3) is fairly likely to end with a blow off top forcing intermediate wave (4) to be relatively brief and shallow. Primary wave 5 may exhibit a typically curved look.
ALTERNATE WEEKLY CHART
Click chart to enlarge.
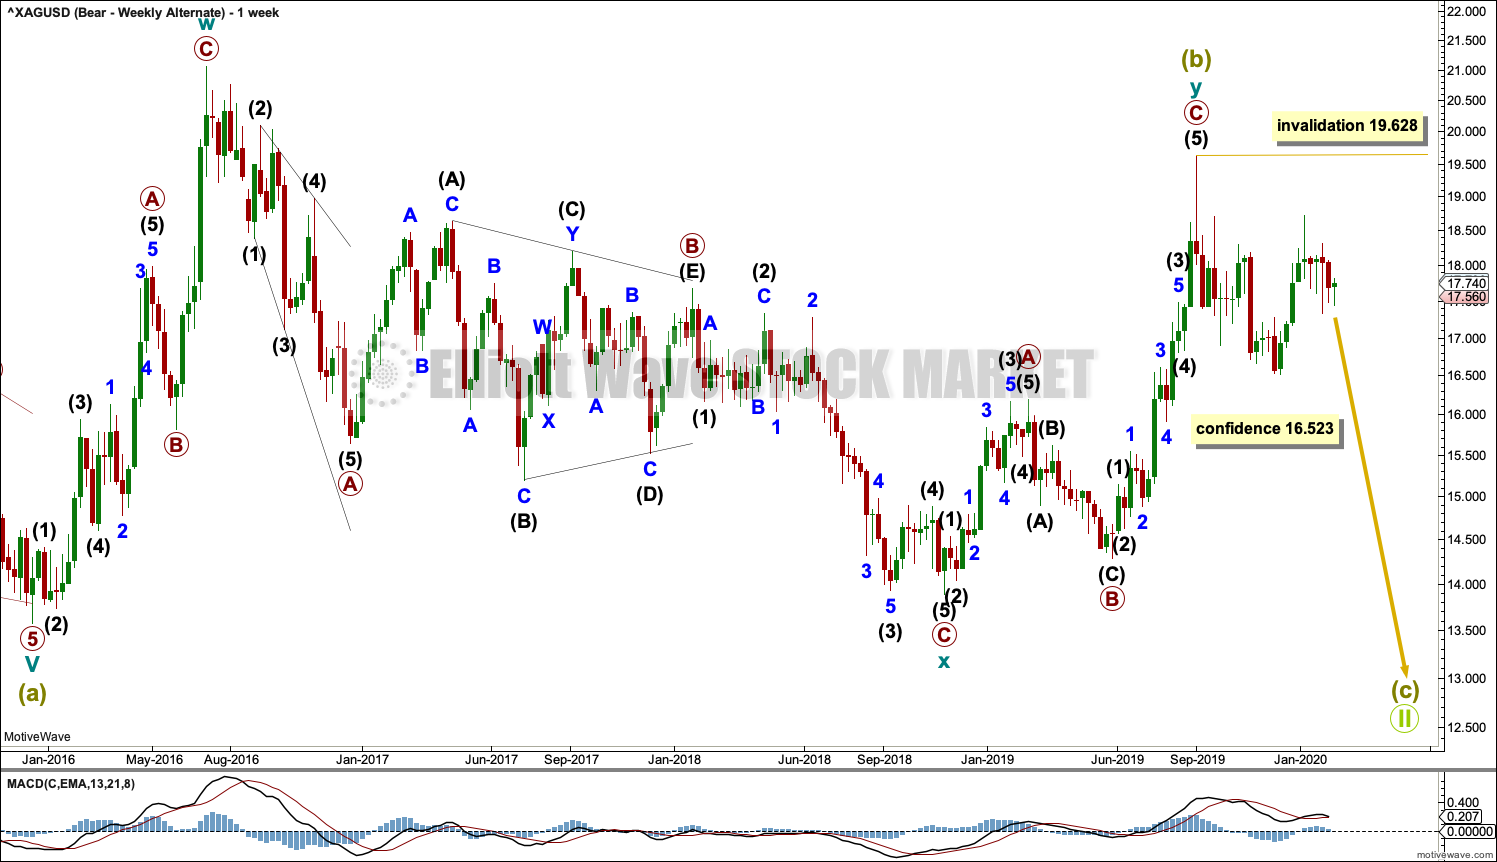
This alternate bearish wave count looks at the possibility that Gold and Silver may have found the last high together and may now both be in a new downwards trend.
If Super Cycle wave (b) is complete, then it may have subdivided as a double zigzag. The second zigzag in the double labelled cycle wave y has failed to achieve its purpose of deepening the correction; it has not given Super Cycle wave (b) an upwards slope. Cycle wave y has failed to move beyond the end of cycle wave w. This is not correctly technically a truncation (the term truncation refers only to 5th and C waves), but the effect is the same. This reduces the probability of this wave count.
If the main bearish wave count published above is invalidated with a new low below 16.523 by any amount at any time frame, then this alternate wave count would become the main wave count.
BULLISH WAVE COUNT
WEEKLY CHART
Click chart to enlarge.
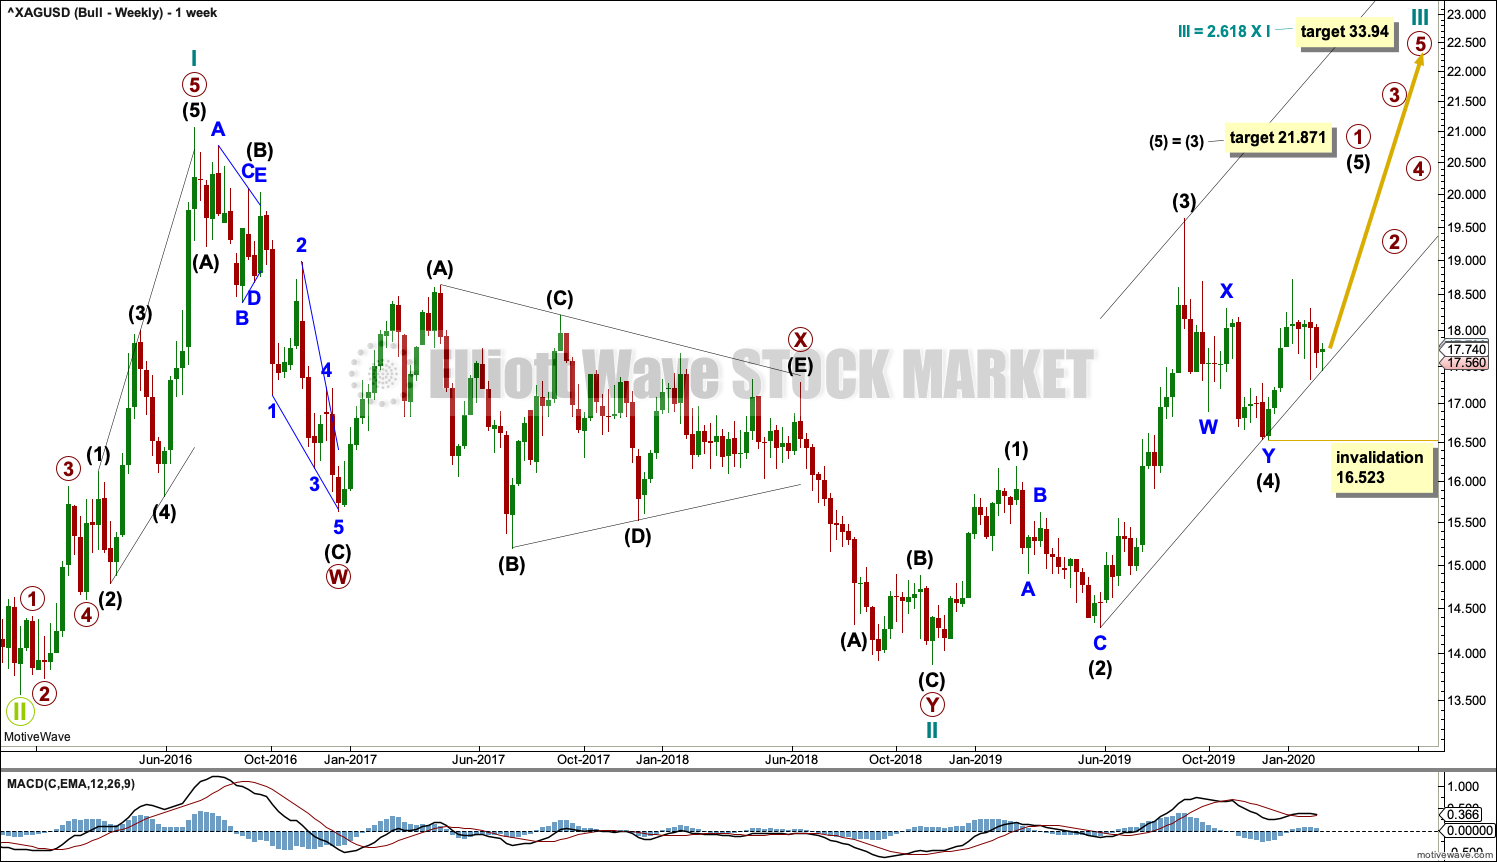
This bullish Elliott wave count sees a new bull market beginning for Silver at the low in December 2015.
A new bull market should begin with a five wave structure upwards. This is labelled cycle wave I.
Following five steps forward should be three steps back. This is labelled cycle wave II. The Elliott wave corrective structure of cycle wave II is labelled as a double zigzag, which is a fairly common structure.
Cycle wave III may only subdivide as an impulse. Within cycle wave III, only primary wave 1 may be unfolding. Within primary wave 1, intermediate waves (1) through to (4) may now be complete. Within intermediate wave (5) no second wave correction may move beyond its start below 16.523.
Intermediate wave (5) would be very likely to make at least a slight new high above the end of intermediate wave (3) at 19.628 to avoid a truncation.
Cycle wave III must move beyond the end of cycle wave I above 21.062. Cycle wave III must move far enough above this point to allow room for cycle wave IV to unfold and remain above cycle wave I price territory.
DAILY CHART
Click chart to enlarge.
Both this bullish Elliott wave count and the bearish Elliott wave count now expect a fourth wave has completed. The targets for the next upwards movement are different.
TECHNICAL ANALYSIS
WEEKLY CHART
Click chart to enlarge. Chart courtesy of StockCharts.com.
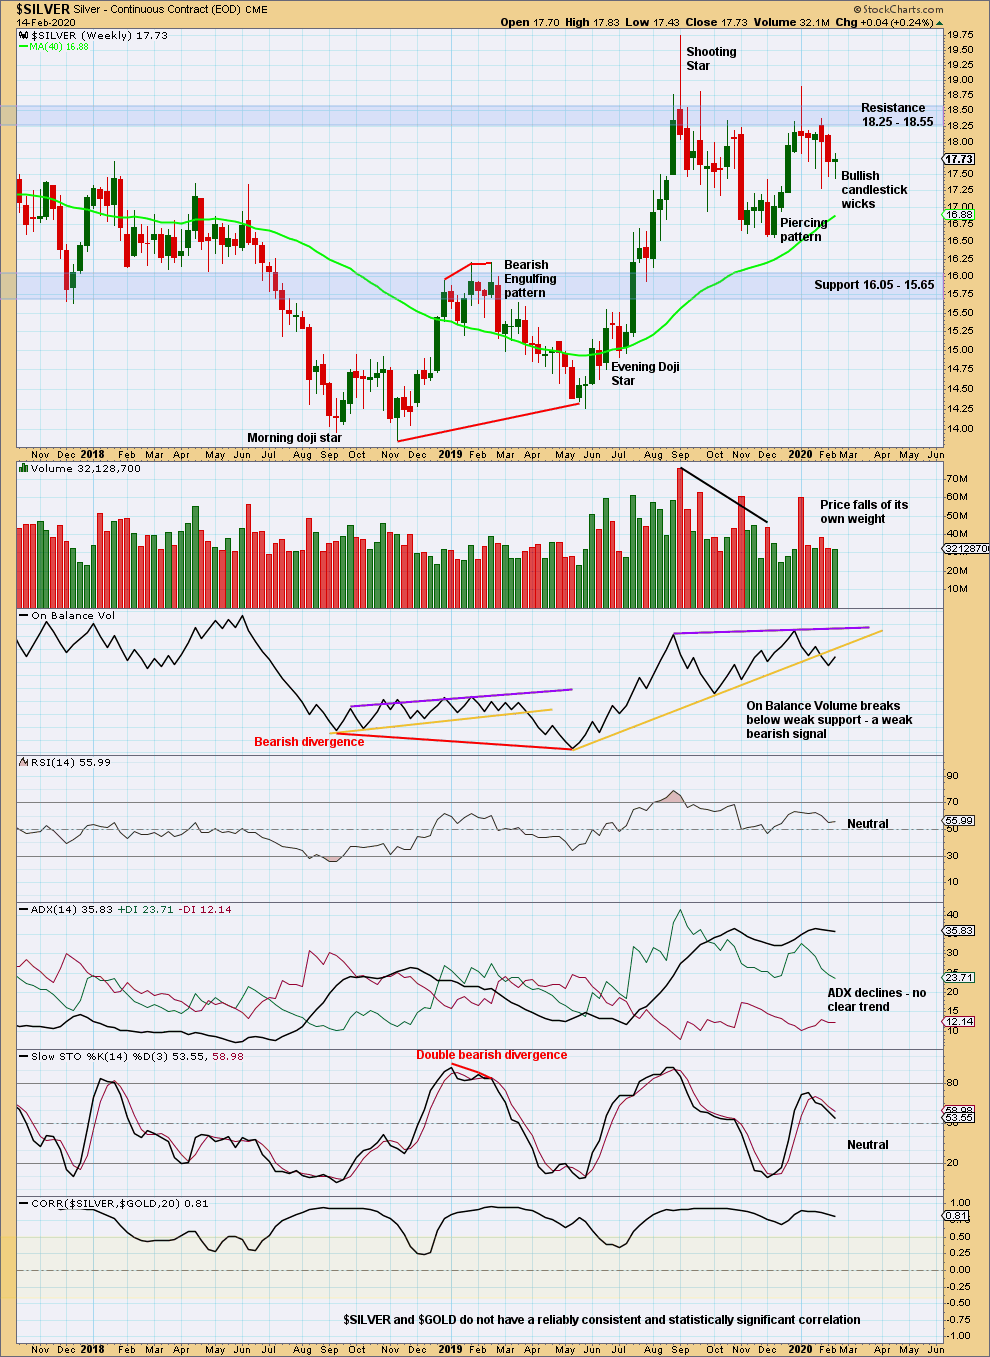
Silver is back within a strong area of resistance and support, identified by blue shaded areas. For the short term, there are now five weekly candlesticks with long lower wicks suggesting upwards movement here.
Volume declines as price moves now mostly sideways.
The prior upwards trend to the high in September 2019 reached extreme; RSI reached overbought and then a bearish candlestick reversal pattern was printed. It is fairly likely in these circumstances that a sustainable high may be in place. Sideways and lower movement has brought RSI down from extreme but has not yet brought ADX down to below both DX lines. If an upwards trend does again develop, it may be limited.
DAILY CHART
Click chart to enlarge. Chart courtesy of StockCharts.com.
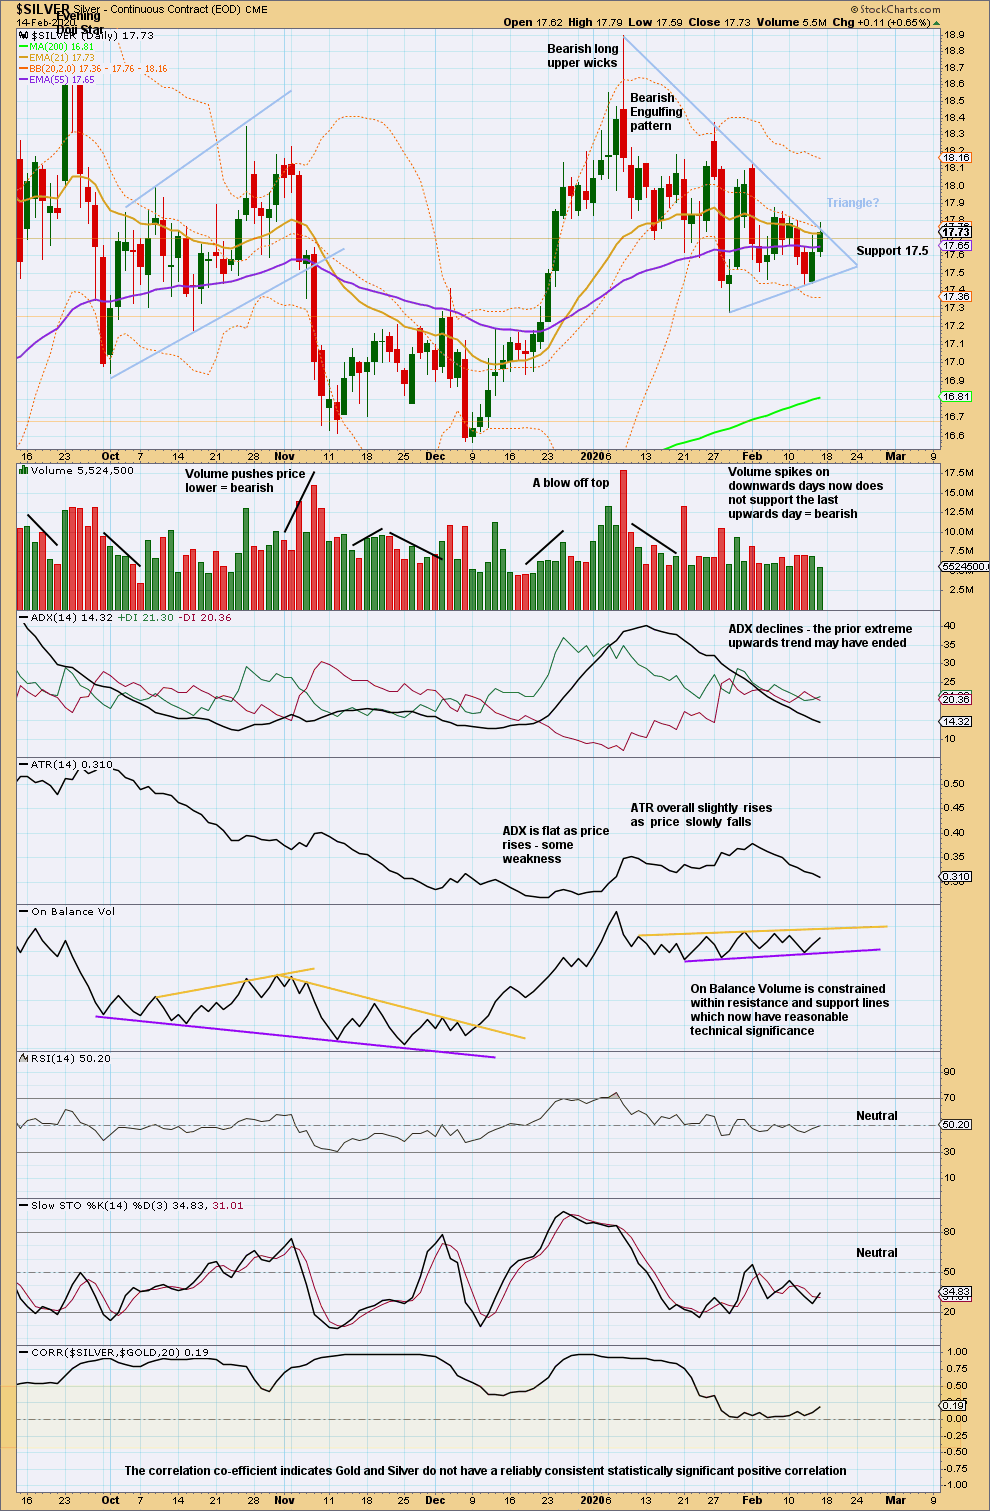
Watch carefully for a breakout from On Balance Volume. This may suggest the next direction for price.
A symmetrical triangle may be forming, although price is very close to the apex of the triangle and so the trend lines may be too strongly sloped. A breakout from the trend lines on a day with support from volume may indicate the next direction for price.
Published @ 03:39 p.m. EST on February 15, 2020.
—
Careful risk management protects your trading account(s).
Follow my two Golden Rules:
1. Always trade with stops.
2. Risk only 1-5% of equity on any one trade.
—
New updates to this analysis are in bold.
0 Comments