
SILVER: Elliott Wave and Technical Analysis | Charts – February 28, 2020
With both the main and first alternate wave counts invalidated with a new low below 17.443 on Friday, a prior alternate now becomes the new main wave count.
Summary: A target after the downwards breakout on Friday is now calculated at 14.10. A new low below 16.195 would add further confidence in a downwards trend.
ELLIOTT WAVE COUNTS
Last updated monthly charts may be found here.
BEARISH WAVE COUNT
WEEKLY CHART
Click chart to enlarge.
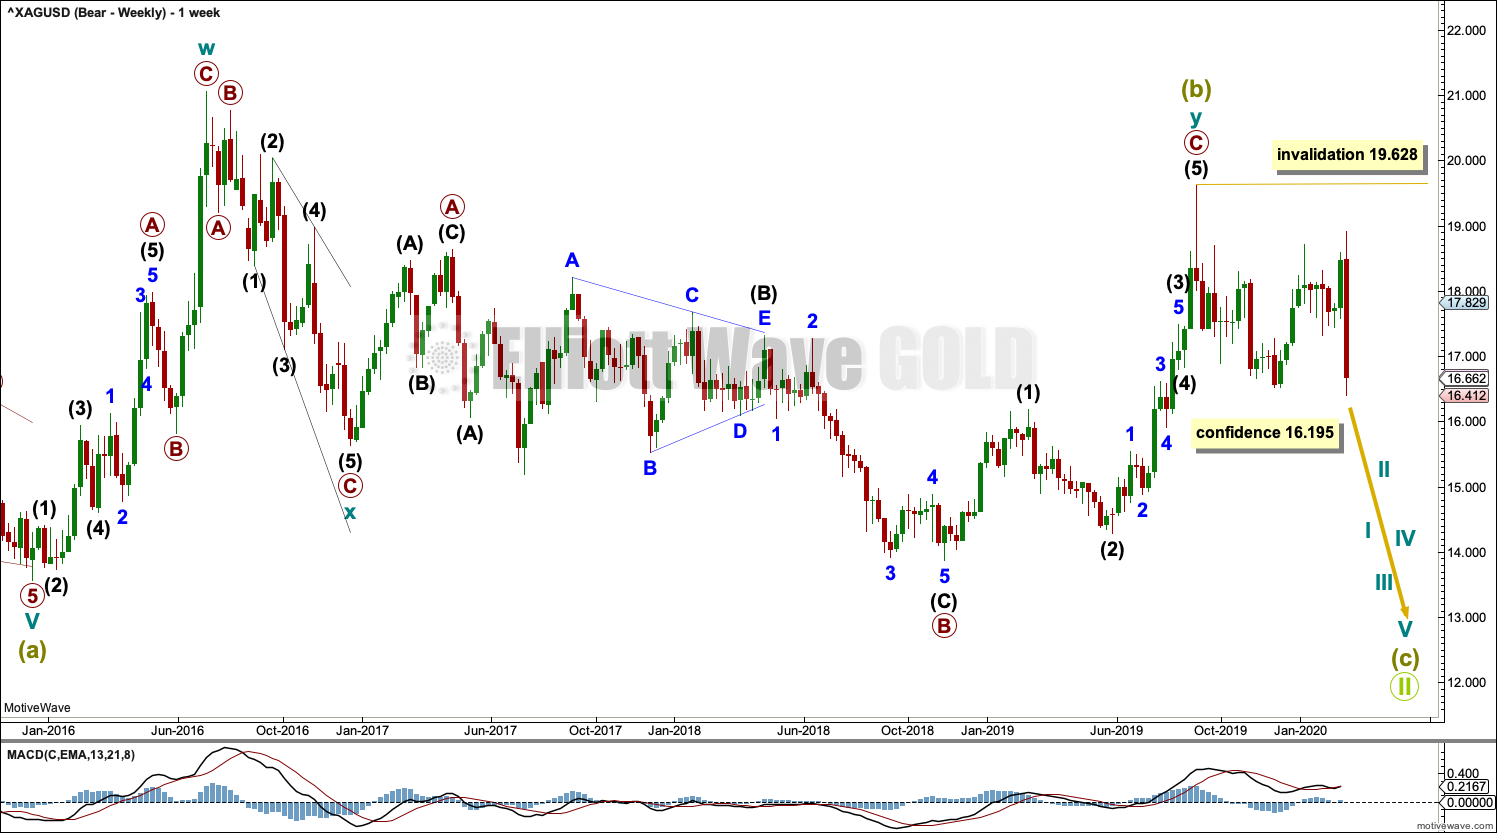
Super Cycle wave (b) may be a complete double combination. This structure has been relabelled after further consideration of this prior alternate (this process may be viewed in a supplemental video this week).
Within the double combination, cycle wave w may be a complete zigzag, cycle wave x completes as a corrective structure (a zigzag) in the opposite direction to join the two structures of the double combination, and cycle wave y may be a complete expanded flat correction. Within the expanded flat, primary wave B is a 1.58 length of primary wave A; this is longer than the common range of up to 1.38 but within an allowable guideline of up to 2. There is no Fibonacci ratio between primary waves C and A.
If Super Cycle wave (b) is over, then Super Cycle wave (c) may have begun. Super Cycle wave (c) must subdivide as a five wave motive structure, most likely an impulse. Within Super Cycle wave (c), cycle wave II may not move beyond the start of cycle wave I above 19.628.
DAILY CHART
Click chart to enlarge.
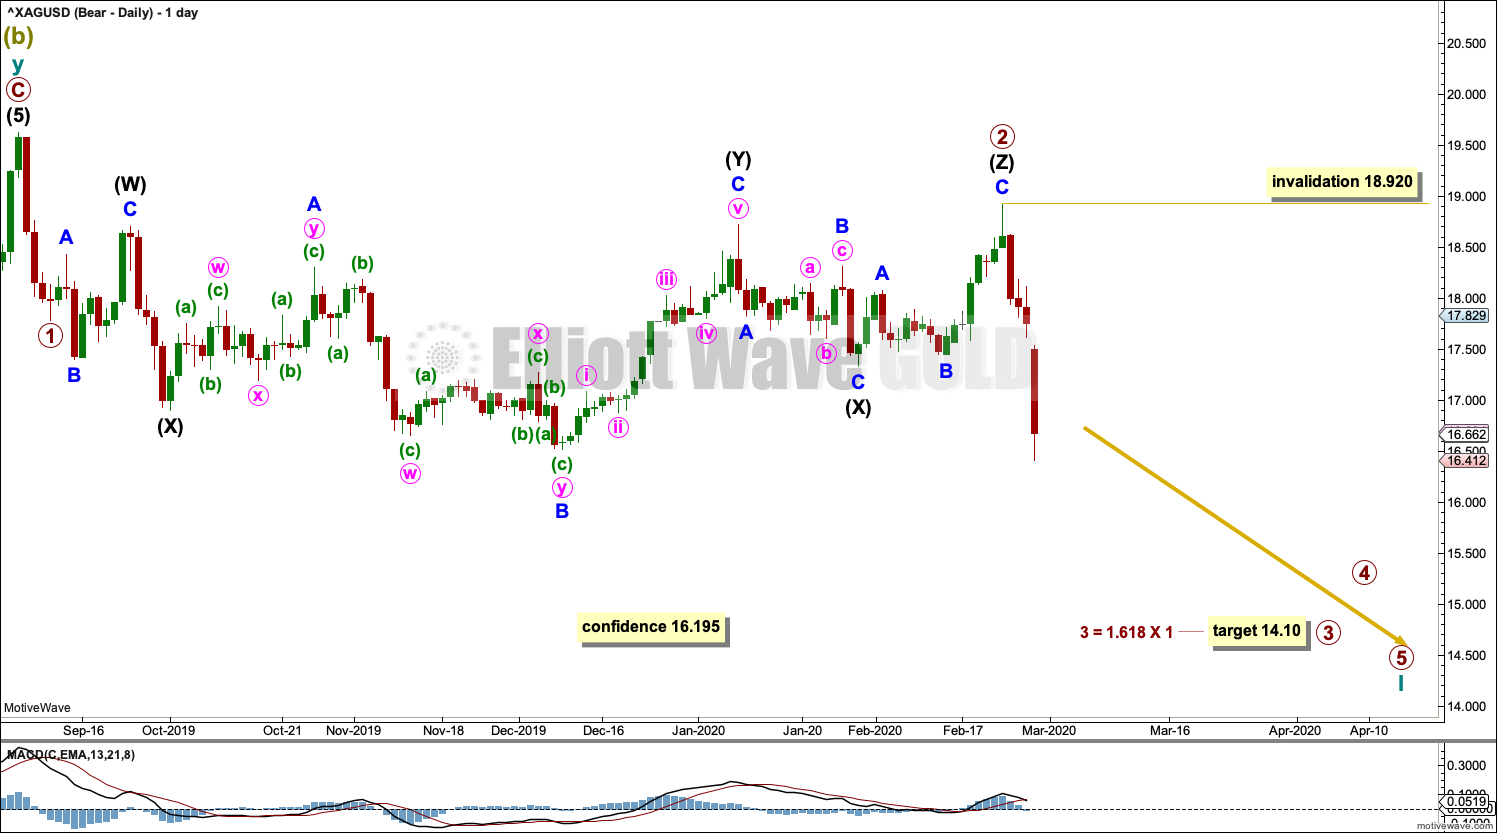
Cycle wave I must subdivide as a five wave motive structure, most likely an impulse.
Within cycle wave I, primary waves 1 and 2 may be complete. Primary wave 2 fits as a very rare triple combination: flat – X – flat – X – zigzag. All subdivisions fit very well, so a very rare structure in this position may be acceptable.
Primary wave 3 may only subdivide as an impulse. Within the impulse, no second wave correction may move beyond the start of its first wave above 18.920.
BULLISH WAVE COUNT
WEEKLY CHART
Click chart to enlarge.
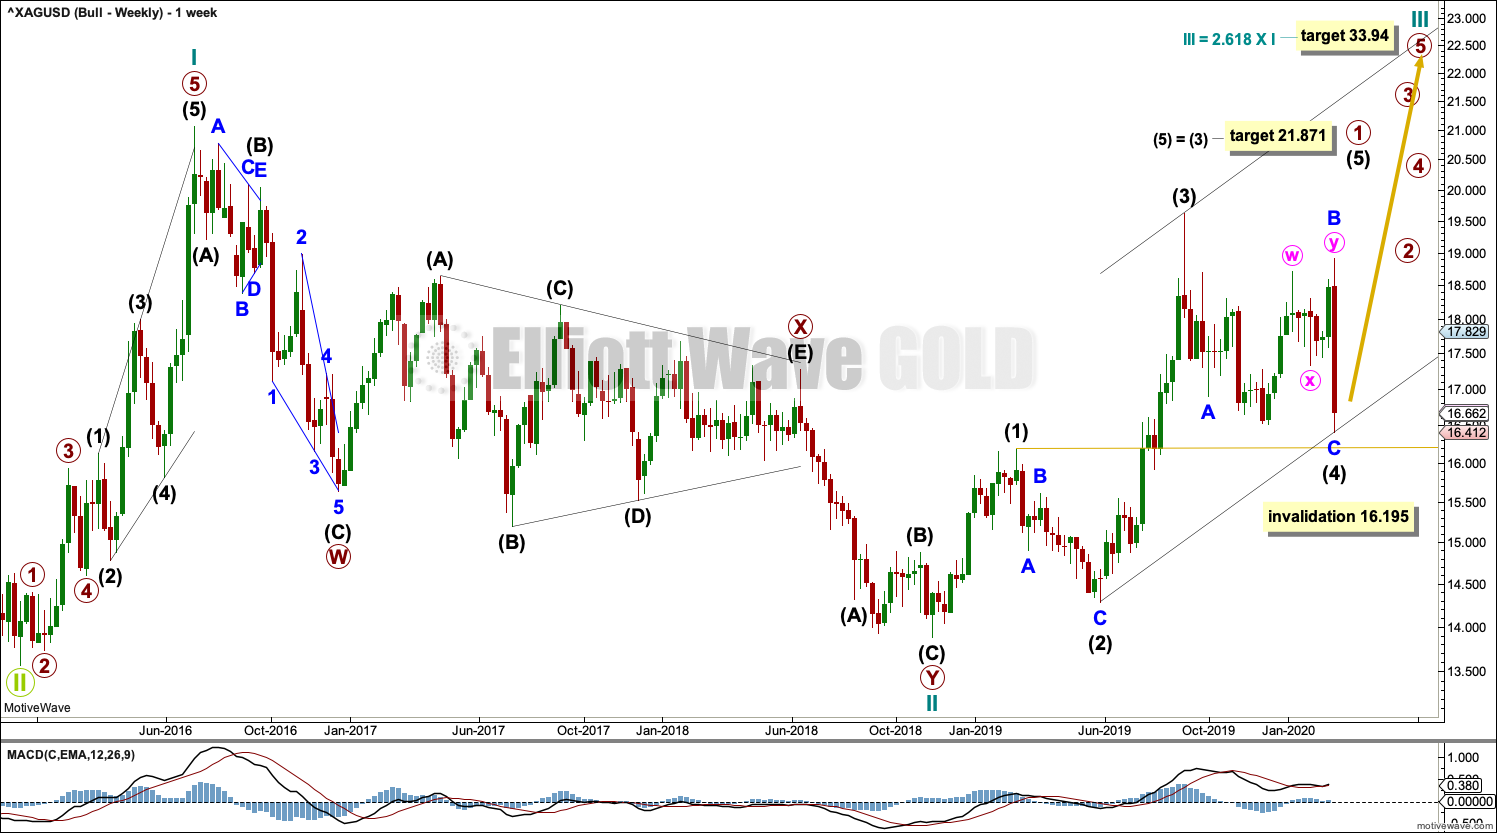
This bullish Elliott wave count sees a new bull market beginning for Silver at the low in December 2015.
A new bull market should begin with a five wave structure upwards. This is labelled cycle wave I.
Following five steps forward should be three steps back. This is labelled cycle wave II. The Elliott wave corrective structure of cycle wave II is labelled as a double zigzag, which is a fairly common structure.
Cycle wave III may only subdivide as an impulse. Within cycle wave III, only primary wave 1 may be unfolding. Within primary wave 1, intermediate waves (1) through to (4) may now be complete. Intermediate wave (4) may have moved lower this week as a zigzag. If minor wave C within it continues any lower, then intermediate wave (4) may not overlap intermediate wave (1) price territory below 16.195. If this price point is passed, then this alternate may be fully discarded.
Intermediate wave (5) would be very likely to make at least a slight new high above the end of intermediate wave (3) at 19.628 to avoid a truncation.
Cycle wave III must move beyond the end of cycle wave I above 21.062. Cycle wave III must move far enough above this point to allow room for cycle wave IV to unfold and remain above cycle wave I price territory.
DAILY CHART
Click chart to enlarge.
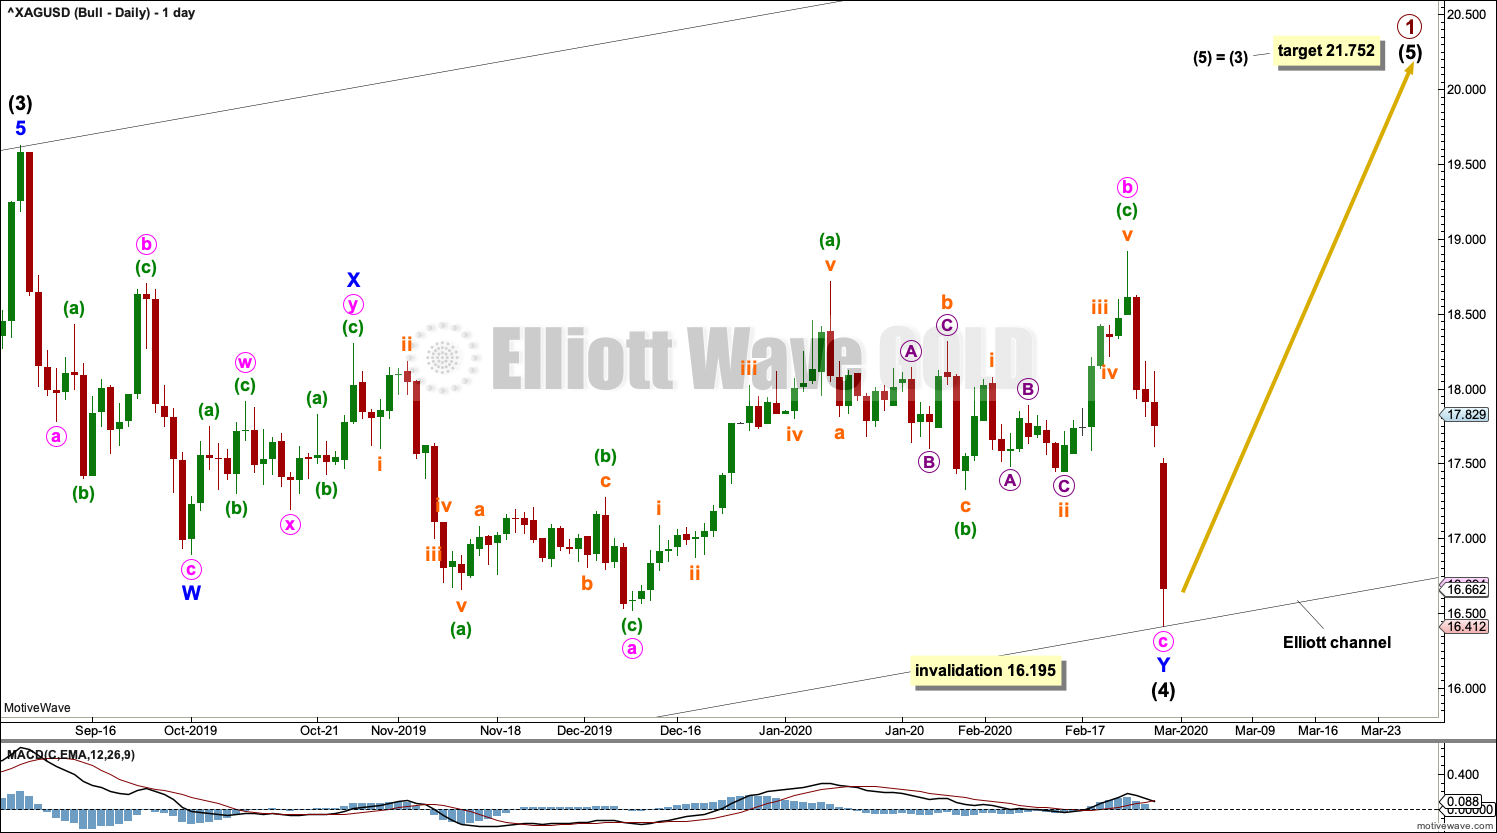
With intermediate wave (4) moving lower this week, a target for intermediate wave (5) is recalculated. The Elliott channel is adjusted and still uses Elliott’s second technique.
TECHNICAL ANALYSIS
WEEKLY CHART
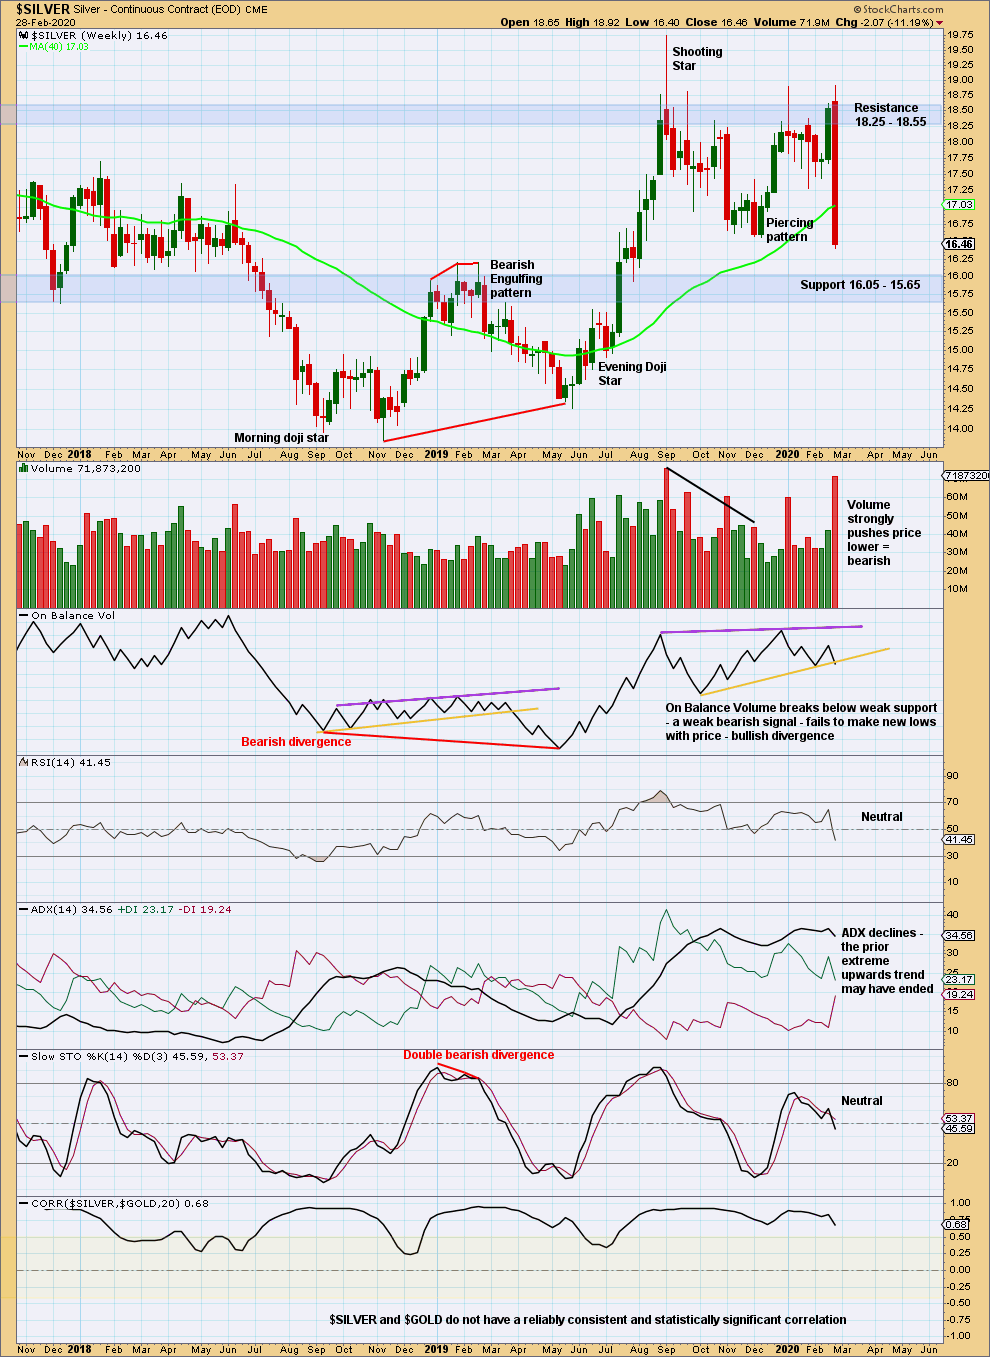
Click chart to enlarge. Chart courtesy of StockCharts.com.
This week price has closed below prior support at 16.57 with support from volume. Next area of support below is about 16.05 to 15.565.
DAILY CHART
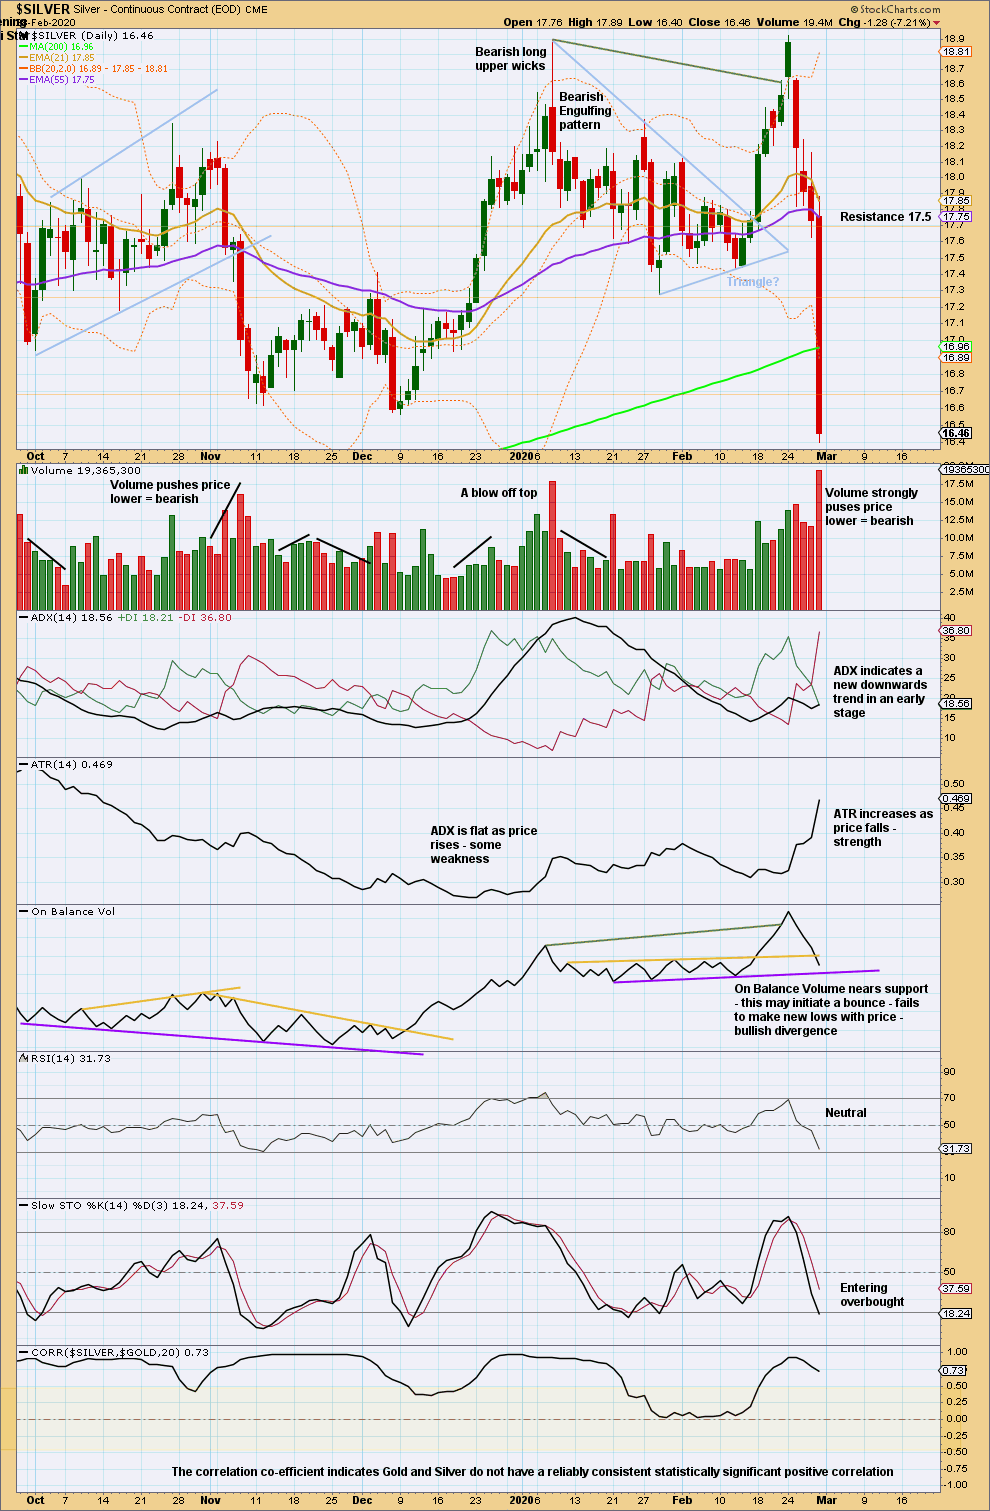
Click chart to enlarge. Chart courtesy of StockCharts.com.
An extremely strong downwards day for Friday closes near lows for the session. This may be a selling climax that may continue for another day or so before a strong bounce begins. Upon signs of a reversal in a long lower wick or a bullish reversal pattern on the daily chart, look for a sharp bounce. Thereafter, look for a downwards trend to resume.
A bounce may find resistance about 17.30 to 17.45, although it may not get that high.
Published @ 10:58 p.m. EST.
—
Careful risk management protects your trading account(s).
Follow my two Golden Rules:
1. Always trade with stops.
2. Risk only 1-5% of equity on any one trade.
—
New updates to this analysis are in bold.
0 Comments