
GOLD: Elliott Wave and Technical Analysis | Charts – March 31, 2020
Both the bearish and bullish Elliott wave counts have expected downwards movement, which is exactly what is happening.
Summary: The next target is at 1,237. Risk may now be moved down to 1,638.61.
Grand SuperCycle analysis is here.
Monthly charts were last updated here.
MAIN BEARISH ELLIOTT WAVE COUNT
WEEKLY CHART
Click chart to enlarge.
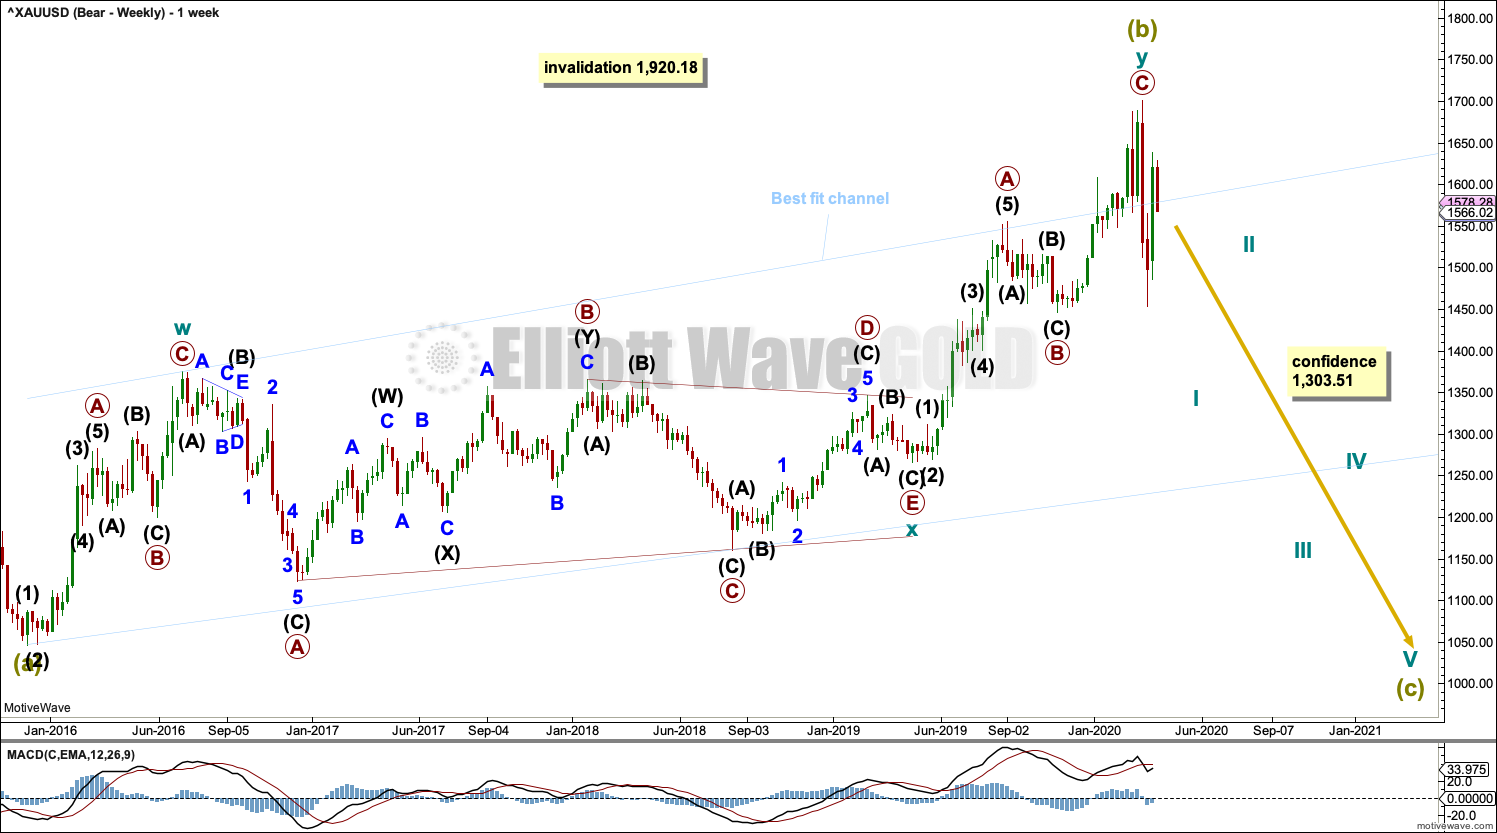
Super Cycle wave (b) may be a complete double zigzag.
The first zigzag in the double is labelled cycle wave w. The double is joined by a three in the opposite direction, a triangle labelled cycle wave x. The second zigzag in the double is labelled cycle wave y.
The purpose of the second zigzag in a double is to deepen the correction. Cycle wave y has achieved this purpose.
A wide best fit channel is added in light blue. Copy this channel over to daily charts. Price has now closed back below the upper edge of this channel.
DAILY CHART
Click chart to enlarge.
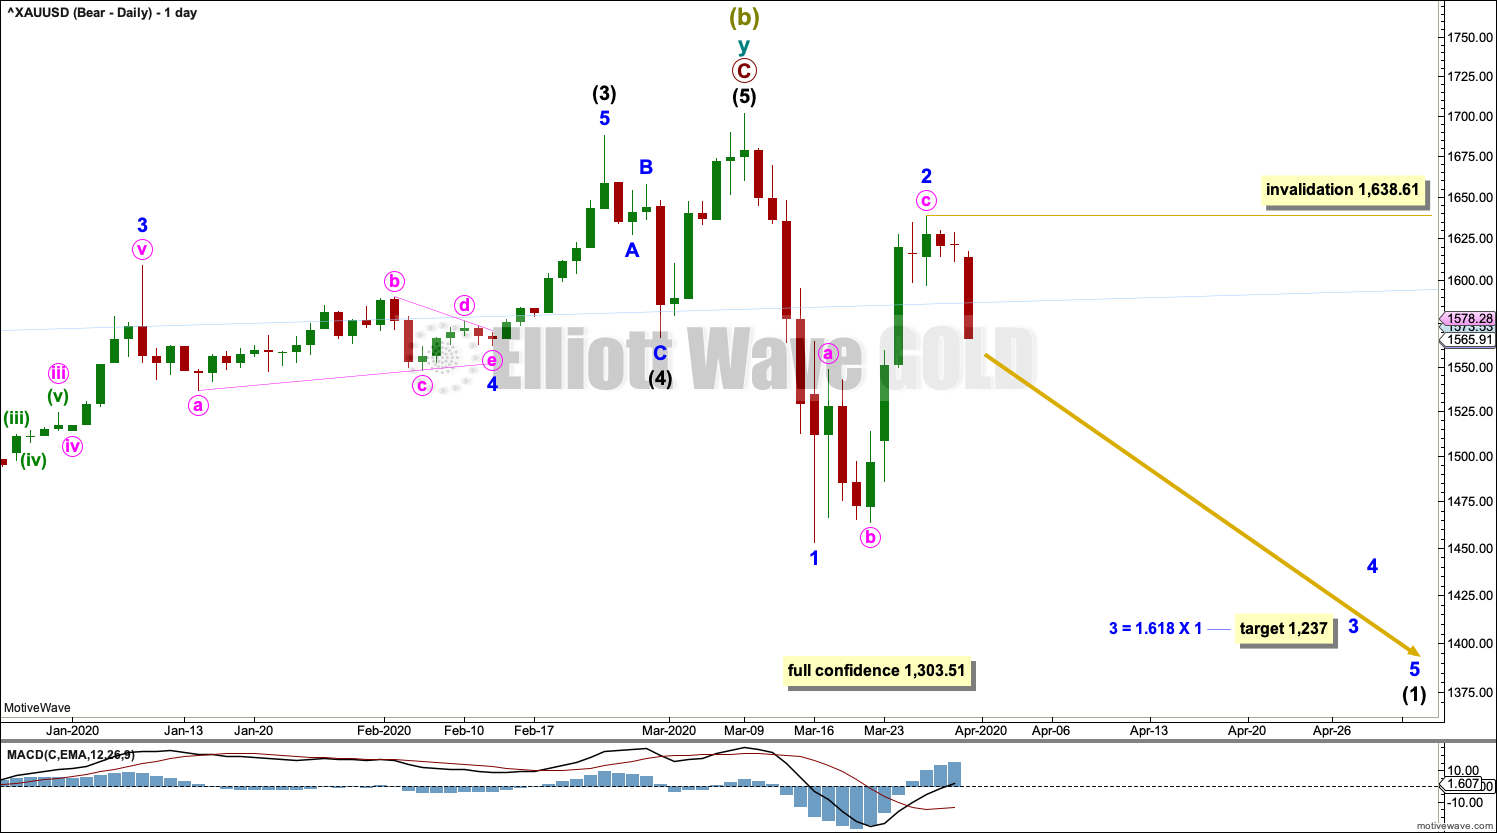
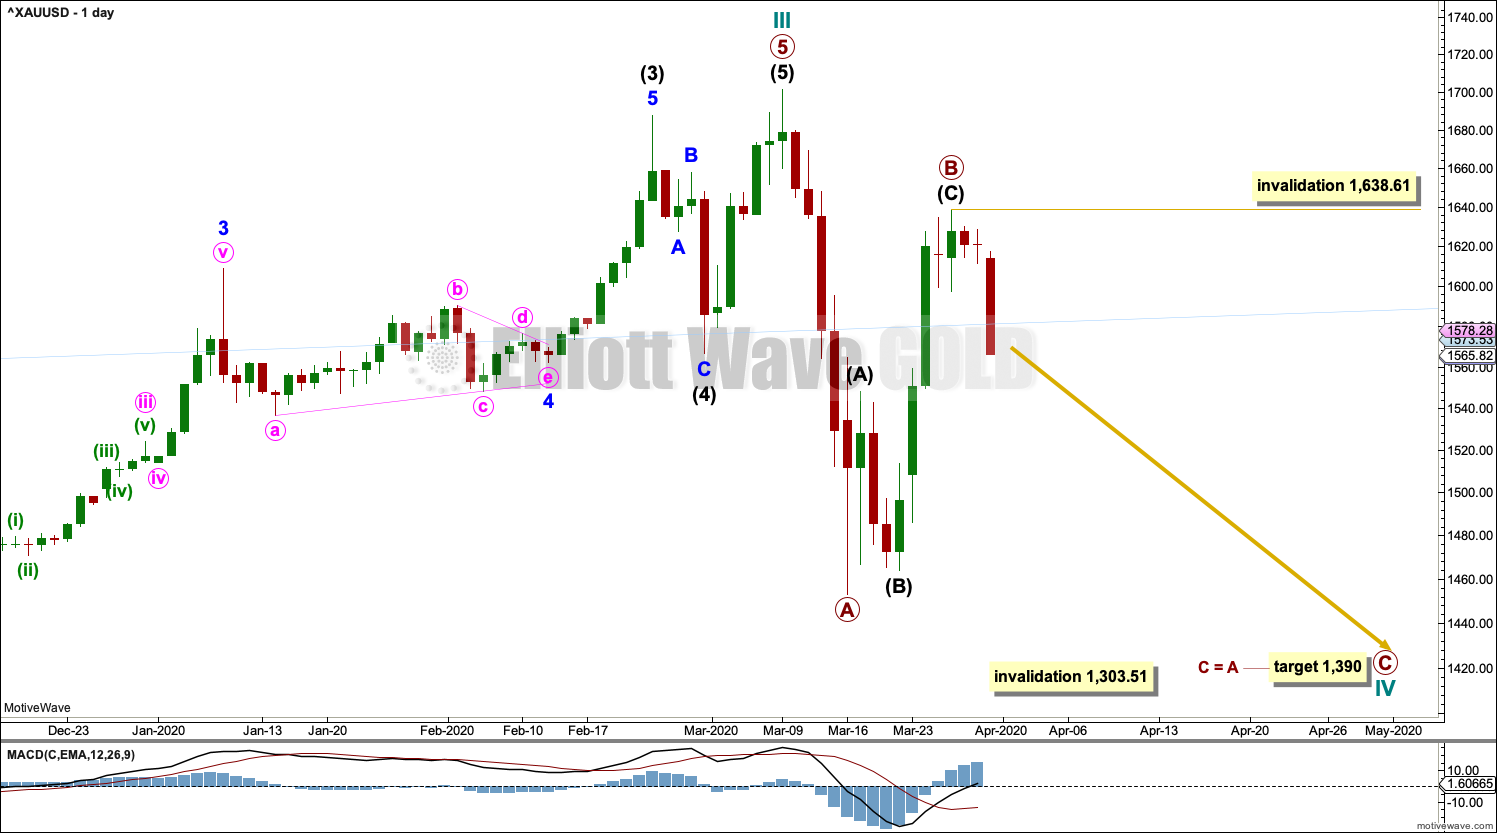
Super Cycle wave (b) may be complete.
The second zigzag in the double, labelled cycle wave y, may be complete. There is no Fibonacci ratio between primary waves A and C.
If there was a trend change at Super Cycle degree, then a five down should develop at daily, weekly and monthly time frames. The first five down at the daily chart level will be labelled intermediate wave (1), and it may be incomplete. Within intermediate wave (1), minor waves 1 and 2 may now be complete. Within minor wave 3, no second wave correction may move beyond its start above 1,638.61.
HOURLY CHART
Click chart to enlarge.
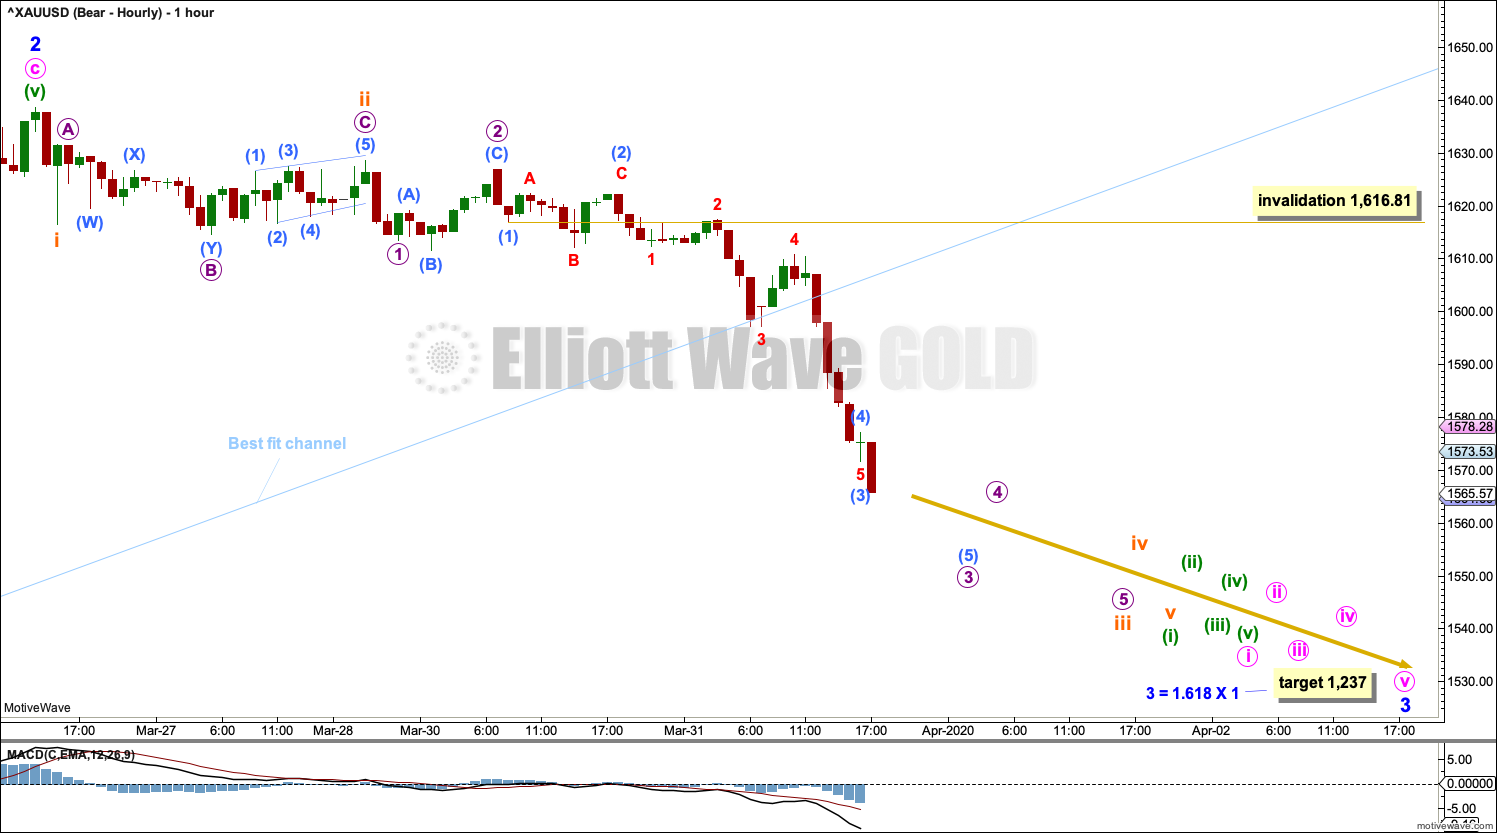
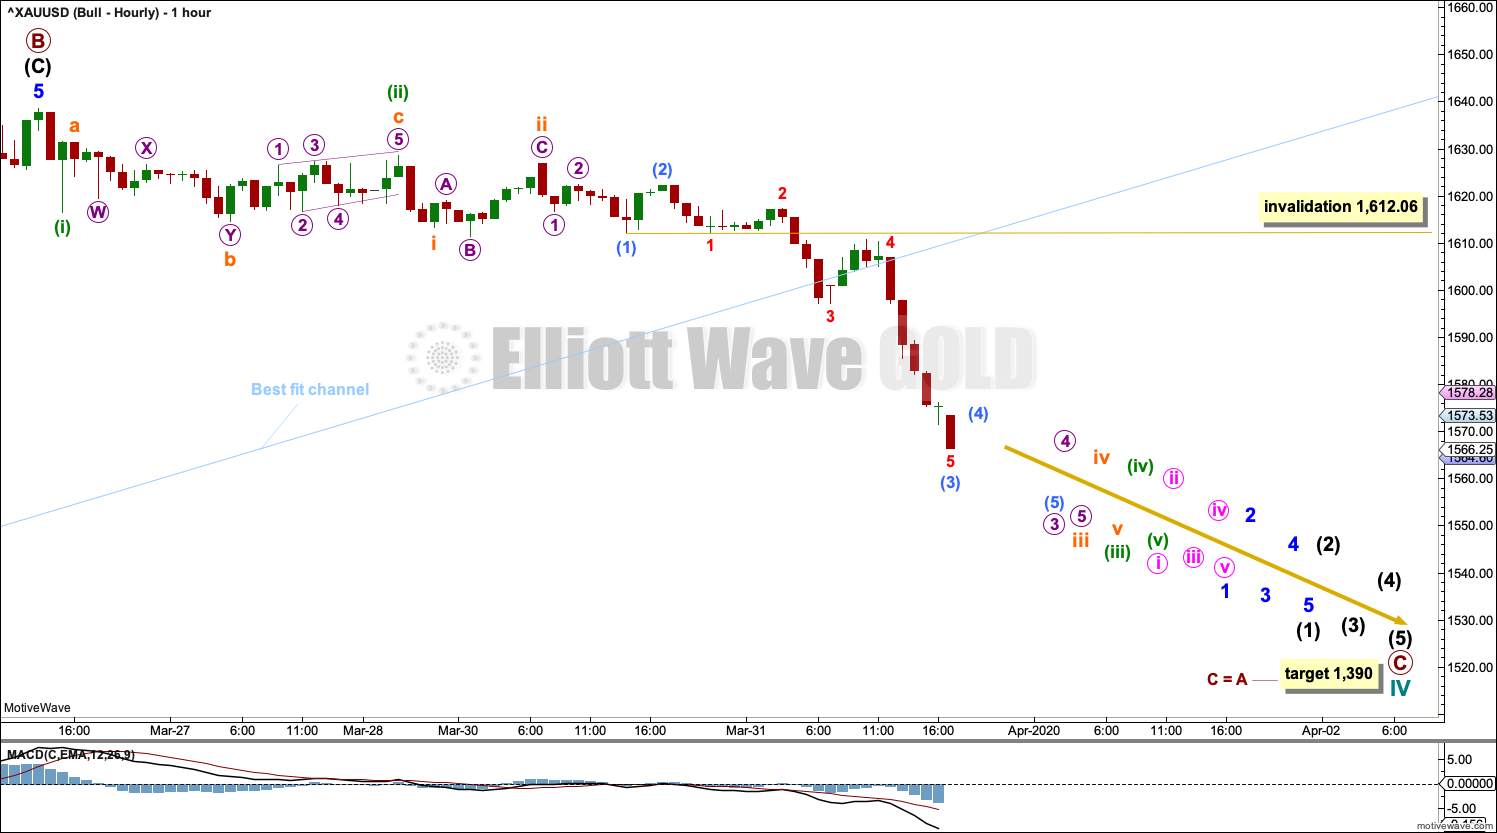
Minor wave 2 may now be a complete zigzag.
Confidence that a high is in place may now be had with the best fit trend channel breached by downwards movement.
Within minor wave 3, minute wave i may be incomplete. Minute wave i may be subdividing as an impulse. Within minute wave i, sub-micro wave (4) may not move into sub-micro wave (1) price territory above 1,616.81.
The target calculated expects minor wave 3 to exhibit a common Fibonacci ratio to minor wave 1.
ALTERNATE BULLISH ELLIOTT WAVE COUNT
WEEKLY CHART
Click chart to enlarge.
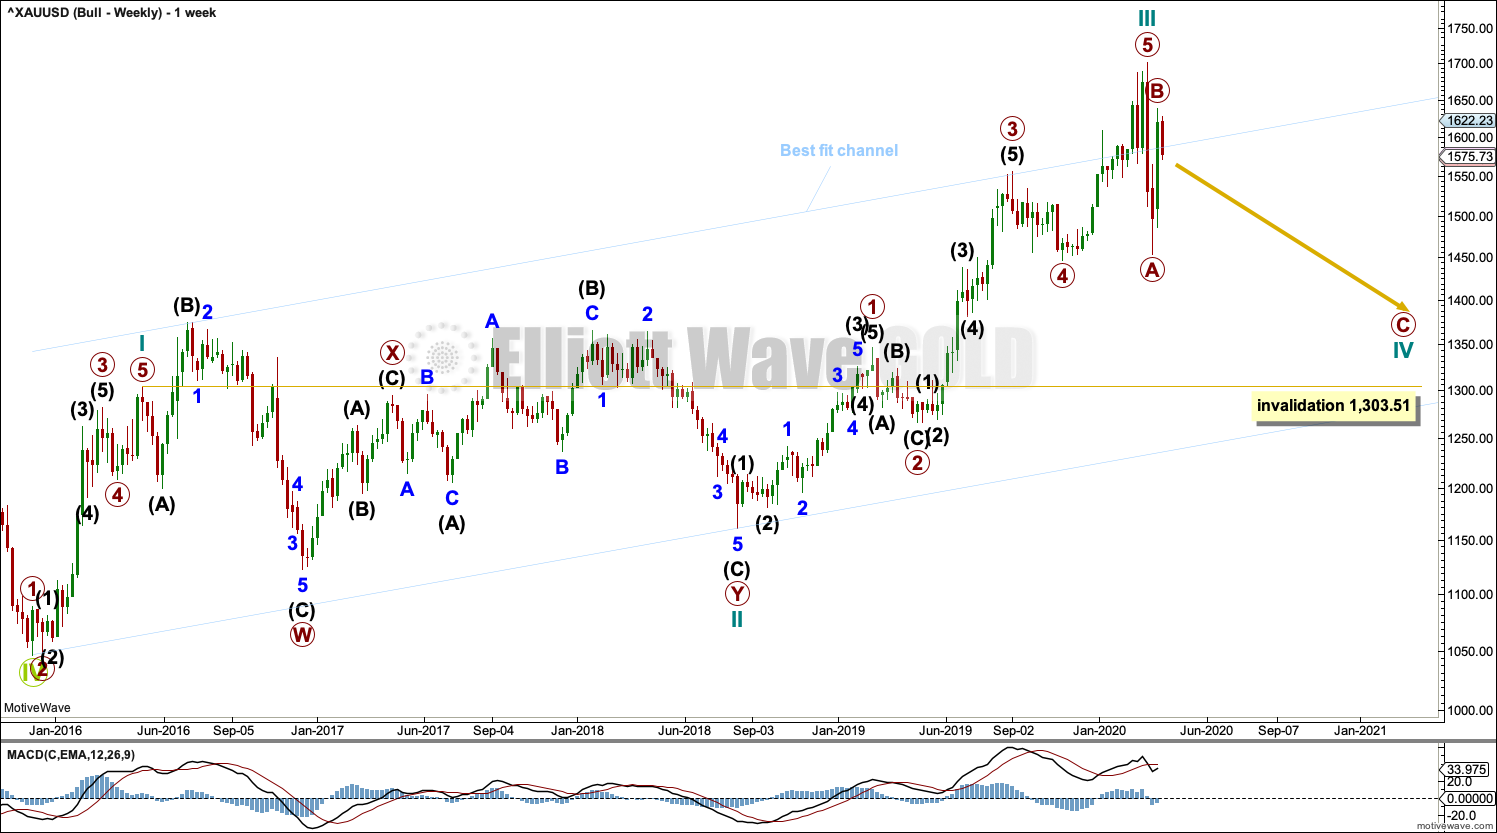
This wave count sees the the bear market complete at the last major low for Gold on 3 December 2015.
If Gold is in a new bull market, then it should begin with a five wave structure upwards on the weekly chart.
Cycle wave I fits as a five wave impulse with reasonably proportionate corrections for primary waves 2 and 4. This resolves a previous major problem with the bullish wave count.
Cycle wave II now fits as a double flat. However, a problem arises with the relabelling of this structure. Within the first flat correction labelled primary wave W, this wave count now needs to ignore what looks like an obvious triangle from July to September 2016 (this can be seen labelled as a triangle on the bear wave count above). This movement must now be labelled as a series of overlapping first and second waves.
Within the first flat correction labelled primary wave W of the double flat of cycle wave II, intermediate wave (B) is 1.69 the length of intermediate wave (A). This is longer than the common range of up to 1.38, but within an allowable guideline of up to 2. The length of intermediate wave (B) reduces the probability of this wave count.
Cycle wave III may be complete. Cycle wave IV may not move into cycle wave I price territory below 1,303.51.
DAILY CHART
Click chart to enlarge.
Cycle wave III may be complete. Cycle wave IV may not move into cycle wave I price territory below 1,303.51.
Cycle wave II was relatively deep at 0.55 of cycle wave I. If cycle wave IV exhibits alternation in depth, it may more likely be shallow; the first target at 0.382 of cycle wave III would be preferred.
Cycle wave II was a very long lasting double combination. It lasted 119 weeks. Cycle wave IV may most likely be a zigzag, which tend to be quicker structures, but it would still be expected to last several months.
HOURLY CHART
Click chart to enlarge.
Both hourly charts are essentially the same at this time. Both see an impulse unfolding lower.
TECHNICAL ANALYSIS
WEEKLY CHART
Click chart to enlarge. Chart courtesy of StockCharts.com.
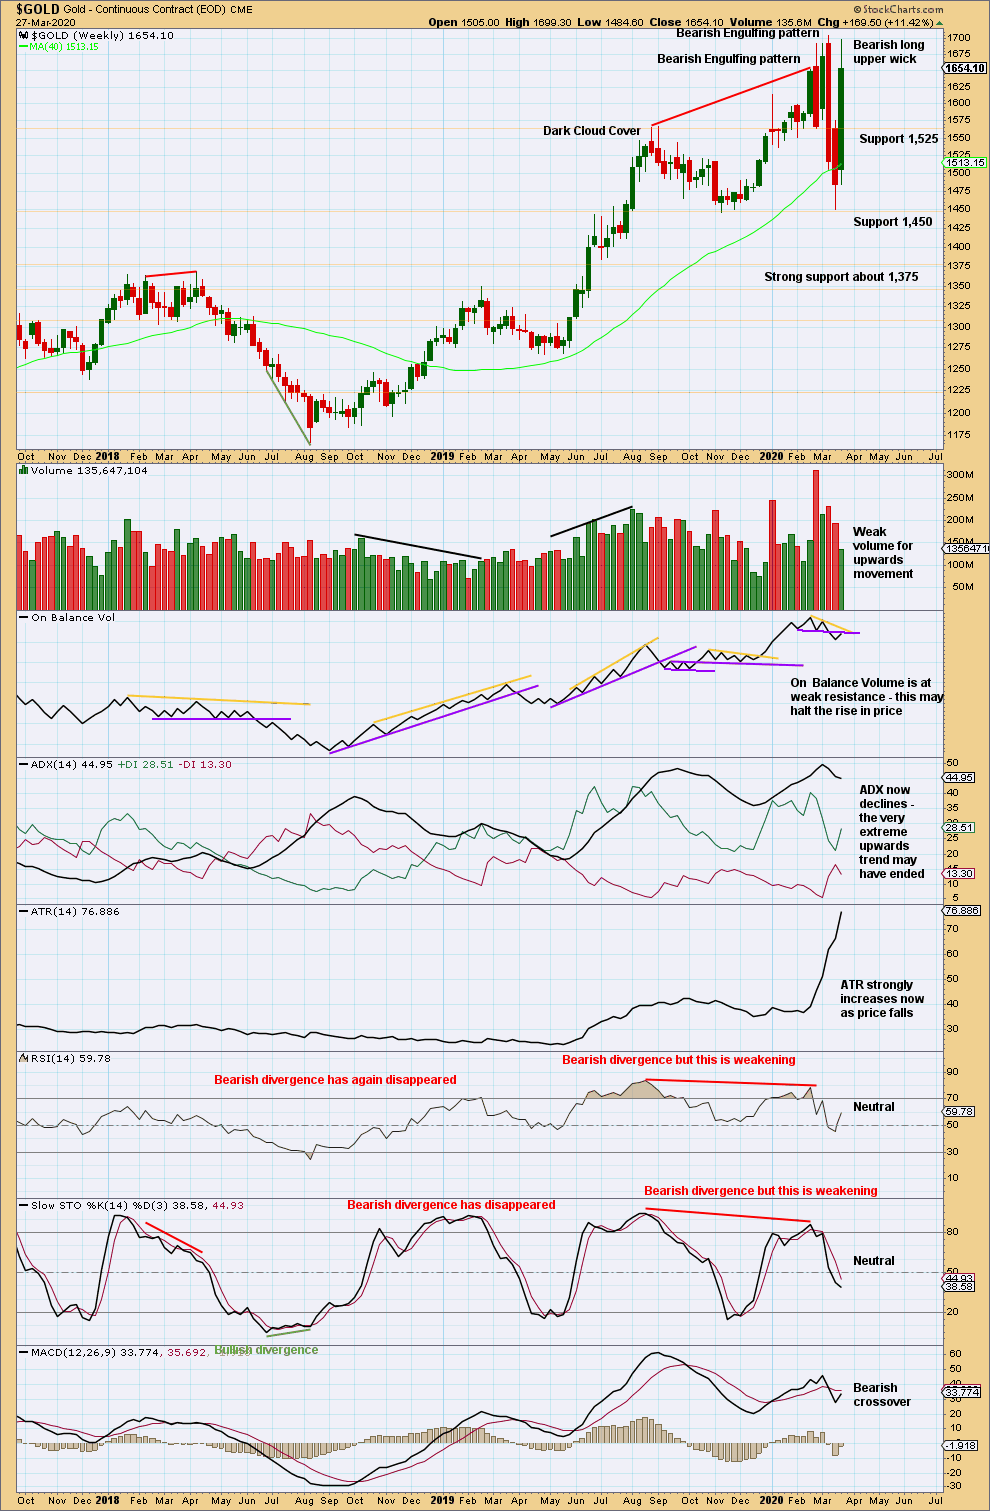
The last Bearish Engulfing pattern is extreme. The pattern fully engulfs the prior nine weekly candlesticks, and it has some support from volume. This strongly indicates a trend change after the upwards trend reached very extreme and conditions reached overbought and exhibited bearish divergence.
Price does not move in straight lines. Look out for bounces and consolidations on the way down. The first major bounce within a new trend for Gold is often very deep. That may be what has happened this week. It may now be over. This week with weak volume and a long upper wick looks bearish so far.
DAILY CHART
Click chart to enlarge. Chart courtesy of StockCharts.com.
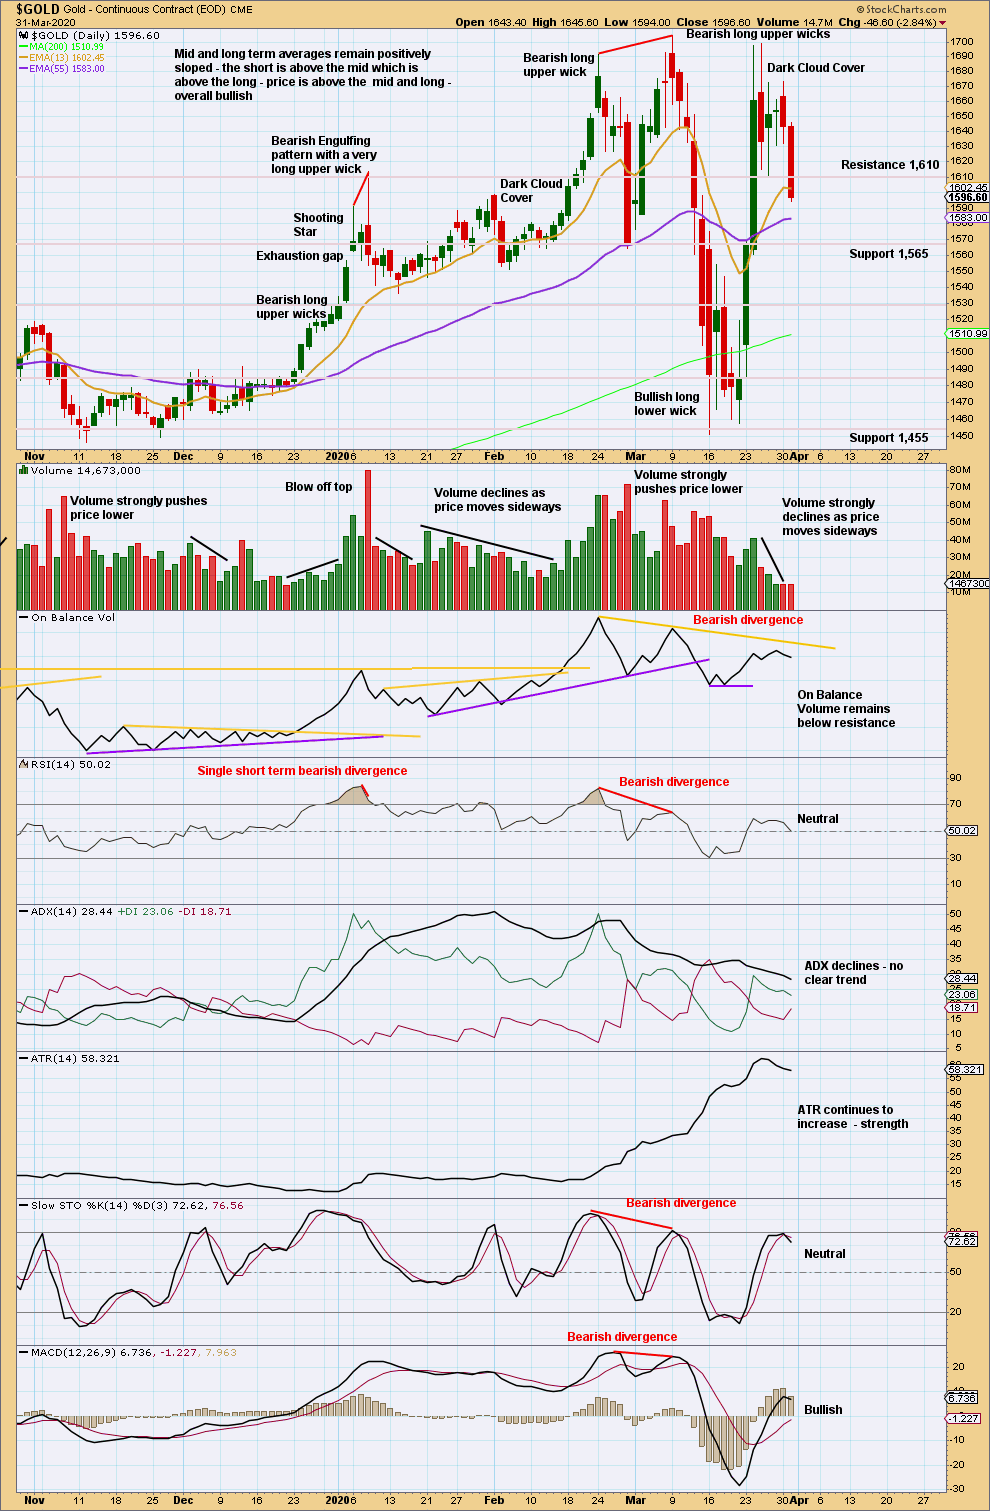
Two bearish long upper wicks, weak volume for upwards sessions, and a bearish candlestick reversal pattern are together a warning that this bounce may be over.
Next support is about 1,565 and below that about 1,530.
GDX WEEKLY CHART
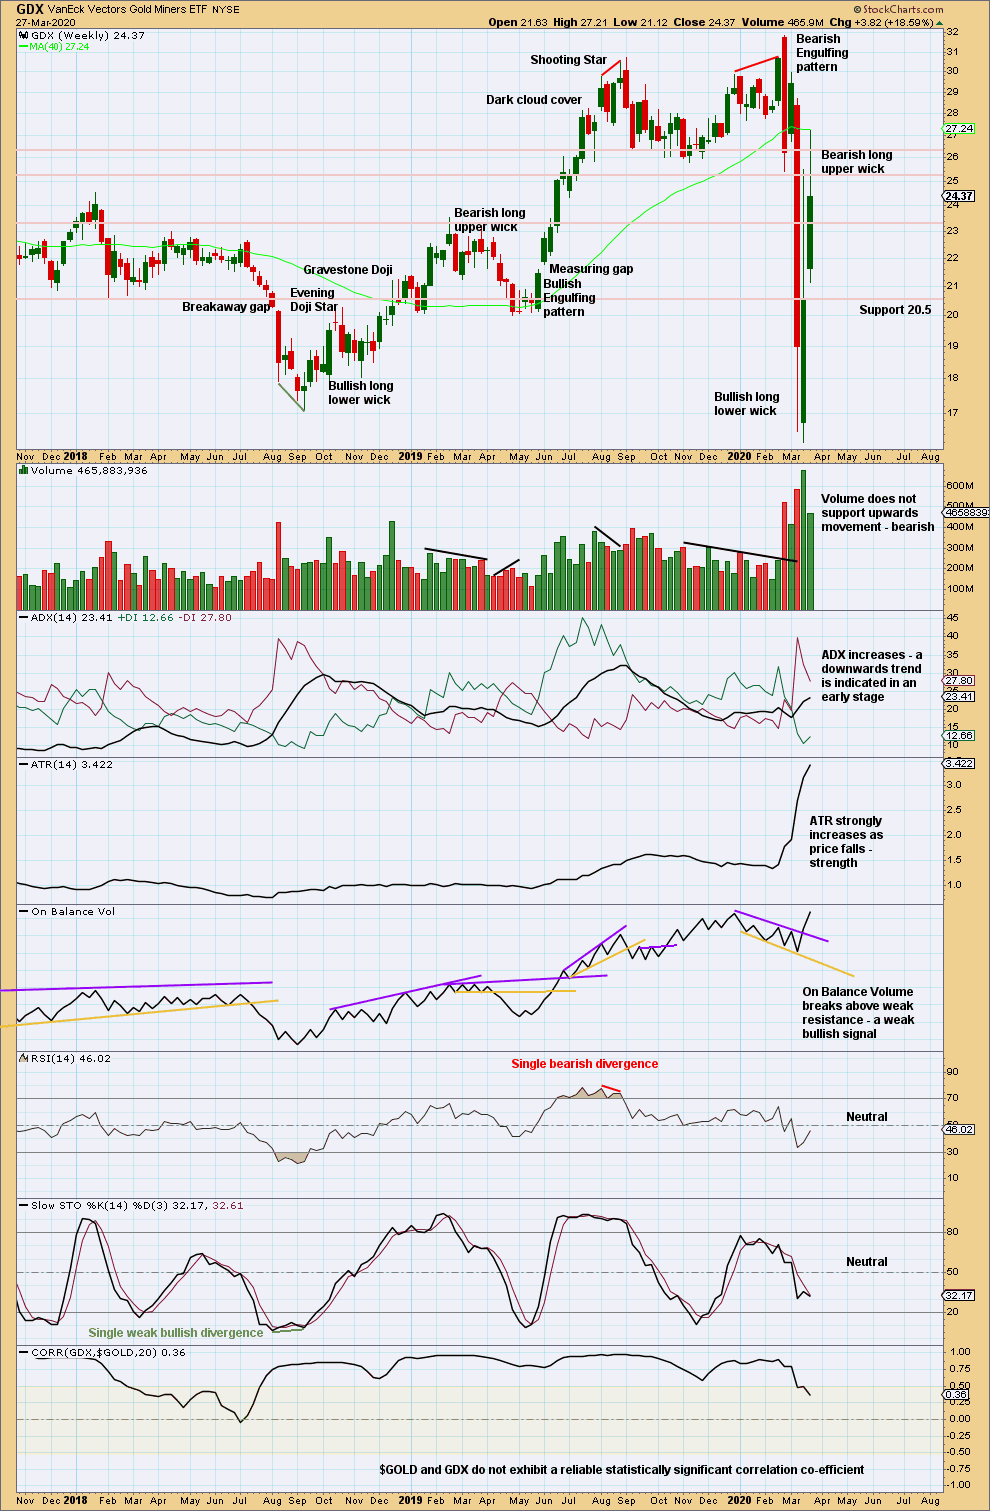
Click chart to enlarge. Chart courtesy of StockCharts.com.
There is support below in a zone about 16.75 to 15.85. Price has bounced up strongly again within this zone.
Weak volume and a long upper wick last week suggest a bounce may be over for GDX.
GDX DAILY CHART
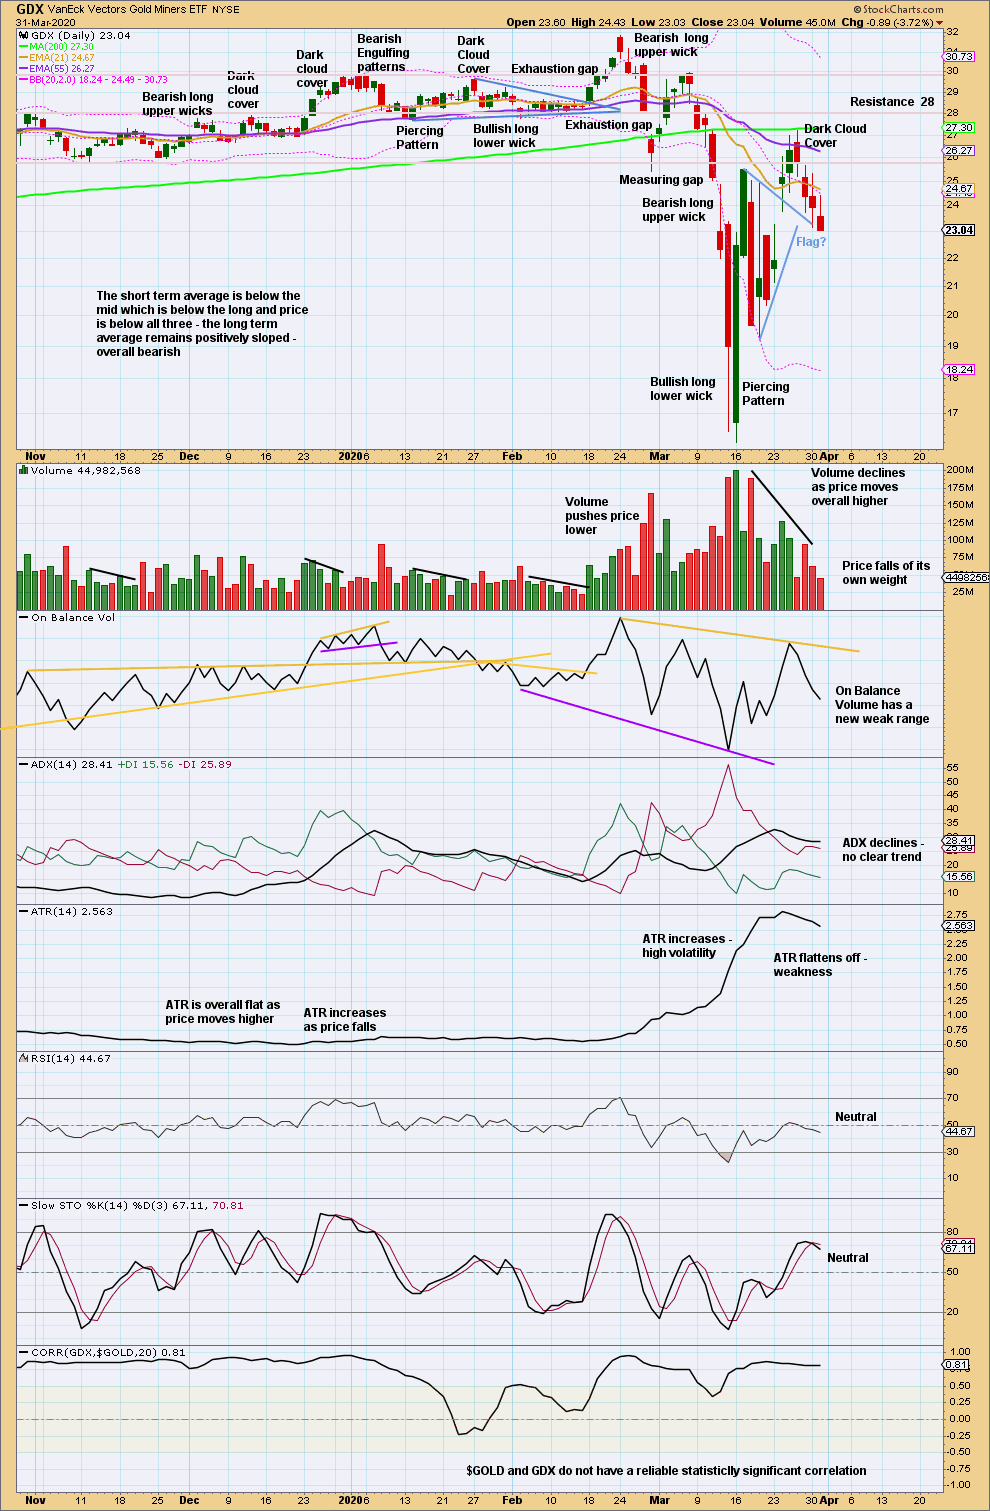
Click chart to enlarge. Chart courtesy of StockCharts.com.
There has been a trend change to downwards. This trend has support from volume pushing price lower and exhibits strength in increasing ATR.
The 55 day moving average has crossed below the 200 day moving average. This is fairly bearish.
Published @ 06:22 p.m. EST.
—
Careful risk management protects your trading account(s).
Follow my two Golden Rules:
1. Always trade with stops.
2. Risk only 1-5% of equity on any one trade.
—
New updates to this analysis are in bold.