
S&P 500: Elliott Wave and Technical Analysis | Charts – March 11, 2020

S&P 500
A new low below 2,728.81 has indicated a deeper pullback to end about the lower edge of a multi-year trend channel.
Summary: Downwards movement has now retraced just over 20% of market value (high to low). This now meets the technical definition of a bear market. However, it came after no divergence between price and market breadth at the last all time high, so statistically this bear market is more likely to be shallow.
Downwards movement over the last four weeks is expected to most likely be a deep pullback, which has precedent in this secular bull market that began in 2009.
This deep pullback may end at the lower edge of the teal multi-year trend channel. Instructions on how to draw it are slightly different for the new wave count and are given below.
The biggest picture, Grand Super Cycle analysis, is here.
ELLIOTT WAVE COUNTS
MAIN WAVE COUNT
MONTHLY CHART
Click chart to enlarge.
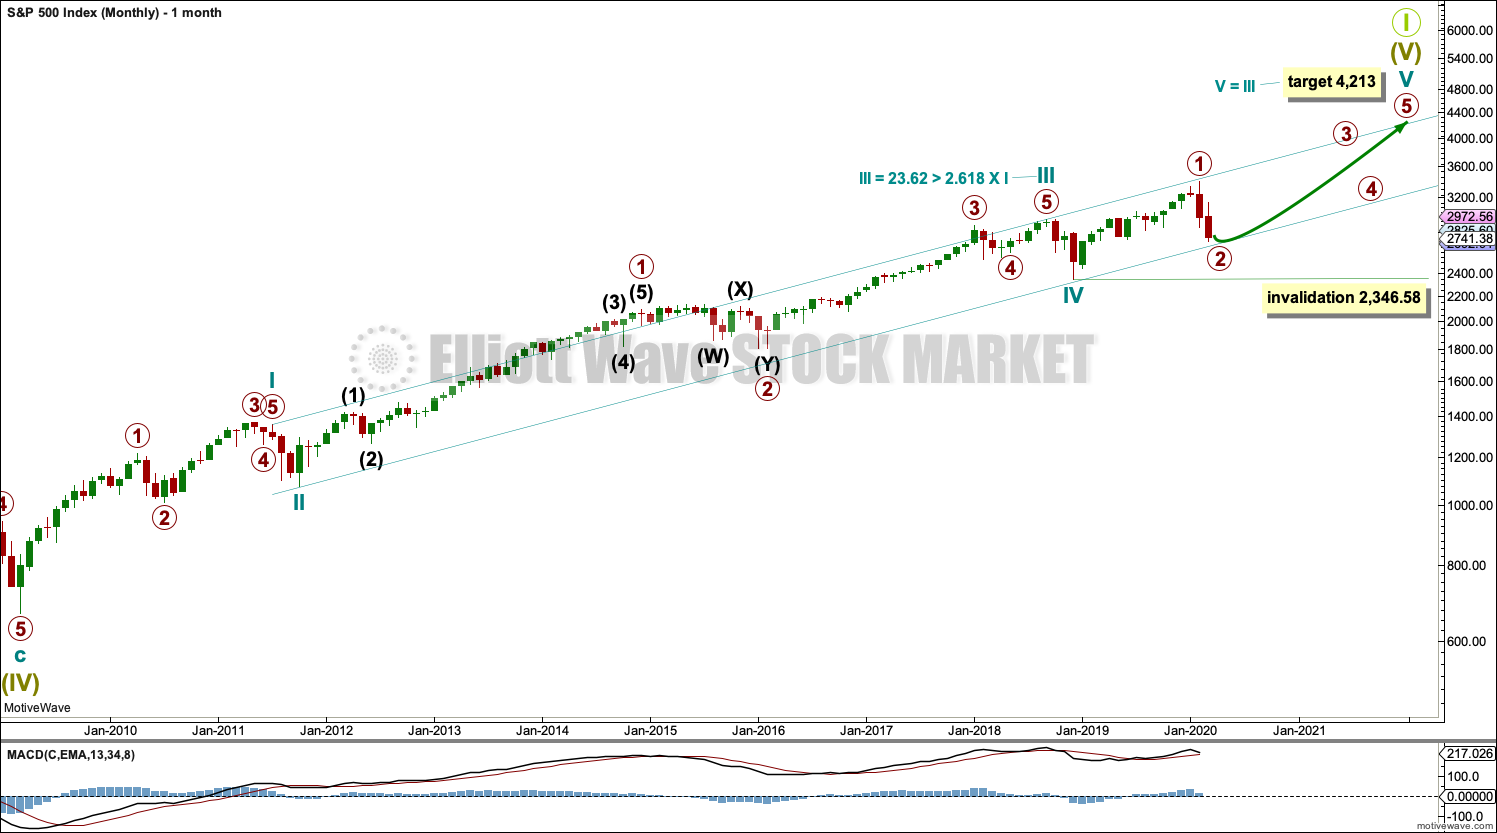
An impulse may be incomplete. The impulse is labelled Super Cycle wave (V). Within Super Cycle wave (V), cycle waves I through to IV may be complete. There is a Fibonacci ratio between cycle waves I and III. Cycle wave V may be incomplete.
Cycle wave I was not extended. Cycle wave III was extended. Two of the three actionary waves within an impulse may extend, so cycle wave V may be also extending.
Draw the Elliott channel now from the following dates and price points: the first trend line from the end of cycle wave I at 1,356.48 (July 7, 2011) to the end of cycle wave III at 2,940.91 (September 21, 2018), then place a parallel copy on the end of cycle wave II at 1,074.77 (October 4, 2011). The lower edge may provide support while cycle wave V is incomplete.
This wave count agrees with Lowry’s analysis.
WEEKLY CHART
Click chart to enlarge.
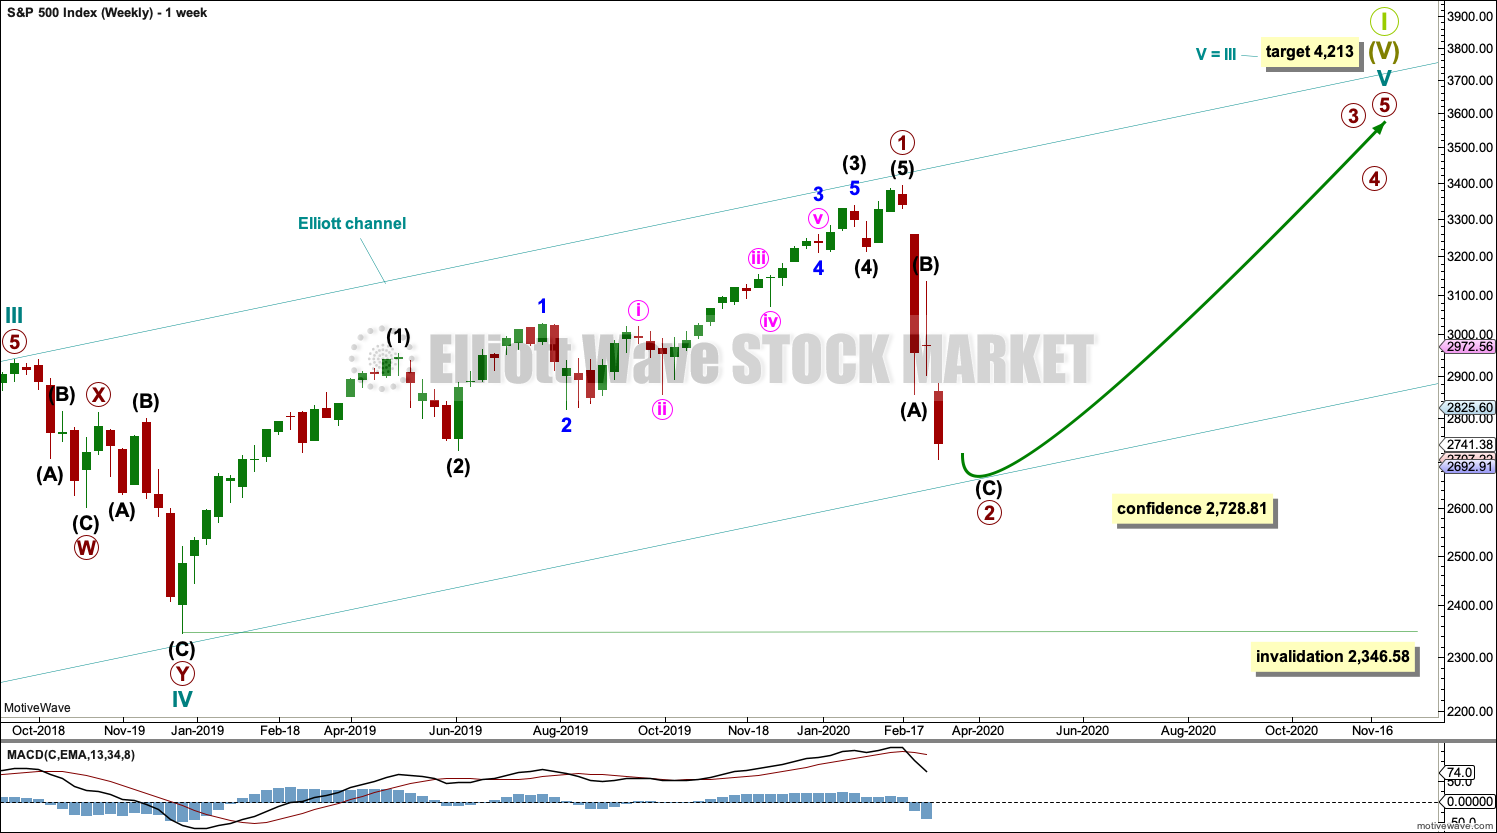
Cycle wave V may be unfolding as an impulse. Within the impulse, only primary wave 1 may be over at the last high.
Primary wave 1 is seen as an impulse. Within primary wave 1, there is poor proportion between the corrections of intermediate waves (2) and (4) and minor waves 2 and 4. This gives the wave count a forced look, but it is valid. The S&P does not always exhibit good proportion, so a little flexibility in the right look is sometimes required.
Primary wave 2 may be unfolding as a zigzag. It may find strong support about the lower edge of the multi-year teal trend channel.
Primary wave 2 may not move beyond the start of primary wave 1 below 2,346.58.
DAILY CHART
Click chart to enlarge.
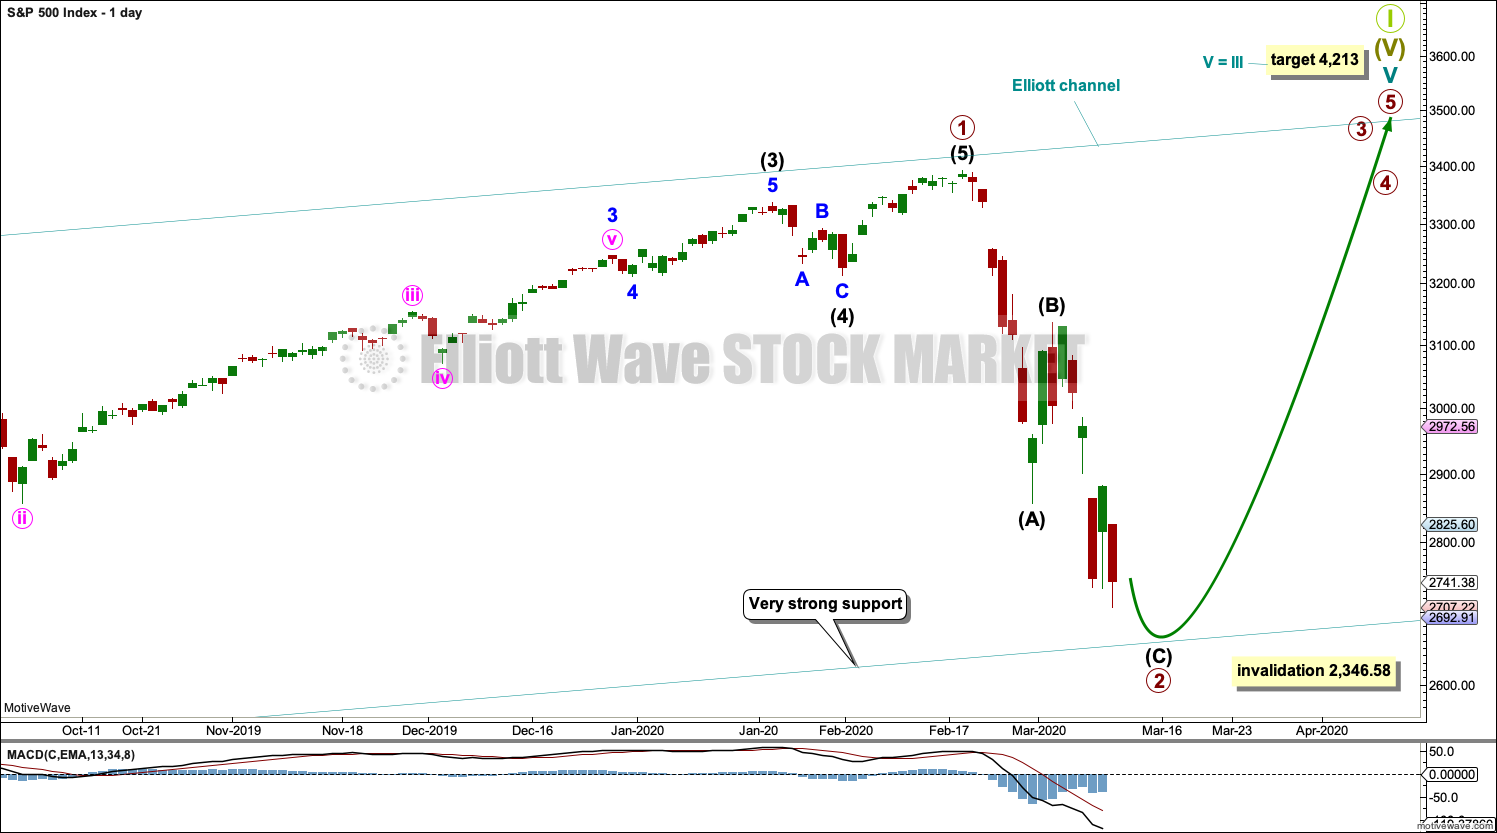
This wave count allows for more downwards movement here. Primary wave 2 may not end until price comes down again to test the lower edge of the teal channel.
Primary wave 2 may be subdividing as a zigzag; this is the most common Elliott wave structure for a second wave. Primary wave 2 may not move beyond the start of primary wave 1 below 2,346.58.
It is possible that primary wave 2 could be over at today’s low, but it is also possible it may continue further to test the teal trend channel.
FIRST ALTERNATE WAVE COUNT
MONTHLY CHART
Click chart to enlarge.
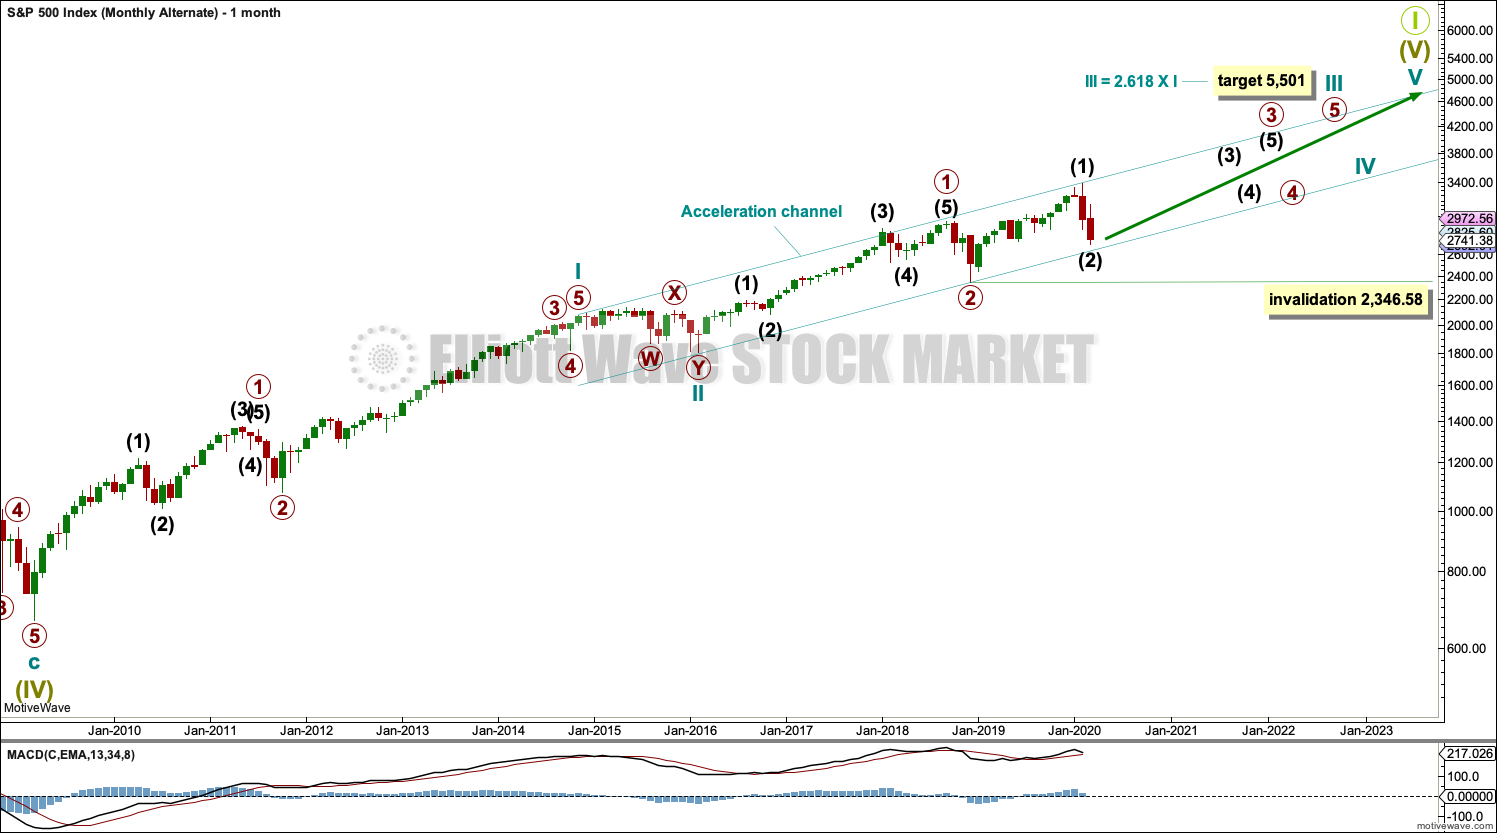
It is also possible that there may be a series of three overlapping first and second waves for this bull market. This wave count would be very bullish once intermediate wave (2) is over.
Intermediate wave (2) may not move beyond the start of intermediate wave (1) below 2,346.58.
SECOND ALTERNATE WAVE COUNT
MONTHLY CHART
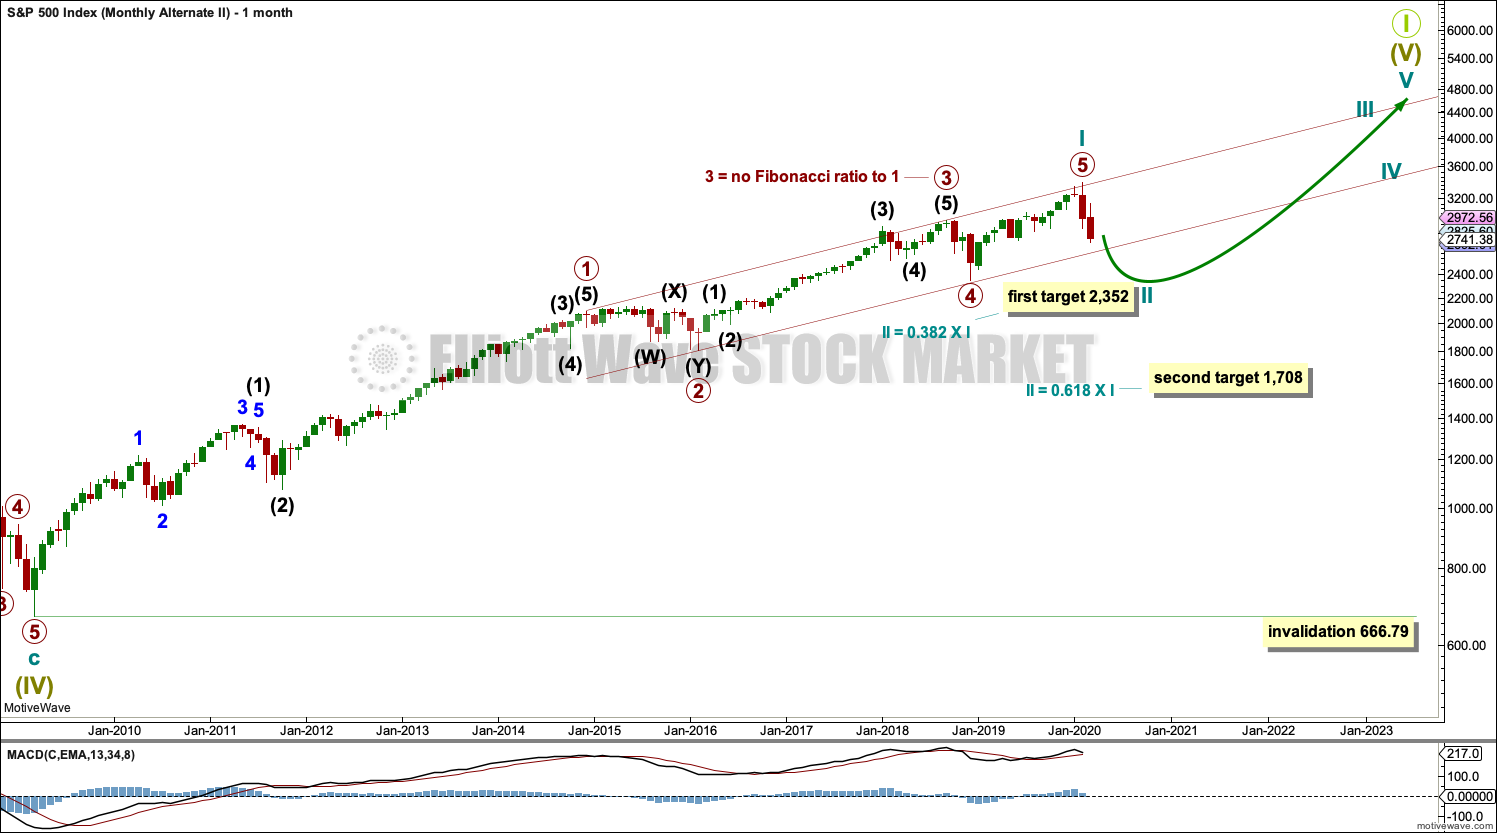
Click chart to enlarge.
It is also possible that an impulse is complete and the bull market is over, but this does not have support from Lowry’s analysis. For this reason, this wave count must be judged to have the lowest probability.
If the channel is breached by a full daily candlestick below and not touching the lower edge, then this would become the main wave count.
If the bull market is over and a bear market has begun, it has come after no divergence at the last all time high between price and the AD line as a measure of market breadth. Statistically this indicates the bear market to follow would most likely be relatively shallow. The 0.382 Fibonacci ratio would be a preferred target. The 0.236 Fibonacci ratio at 2,750.01 has already been passed.
The second target at the 0.618 Fibonacci ratio would have a low probability.
Although this wave count has the lowest probability in terms of classic technical analysis, it does have the best fitting Elliott trend channel.
TECHNICAL ANALYSIS
WEEKLY CHART
Click chart to enlarge. Chart courtesy of StockCharts.com.
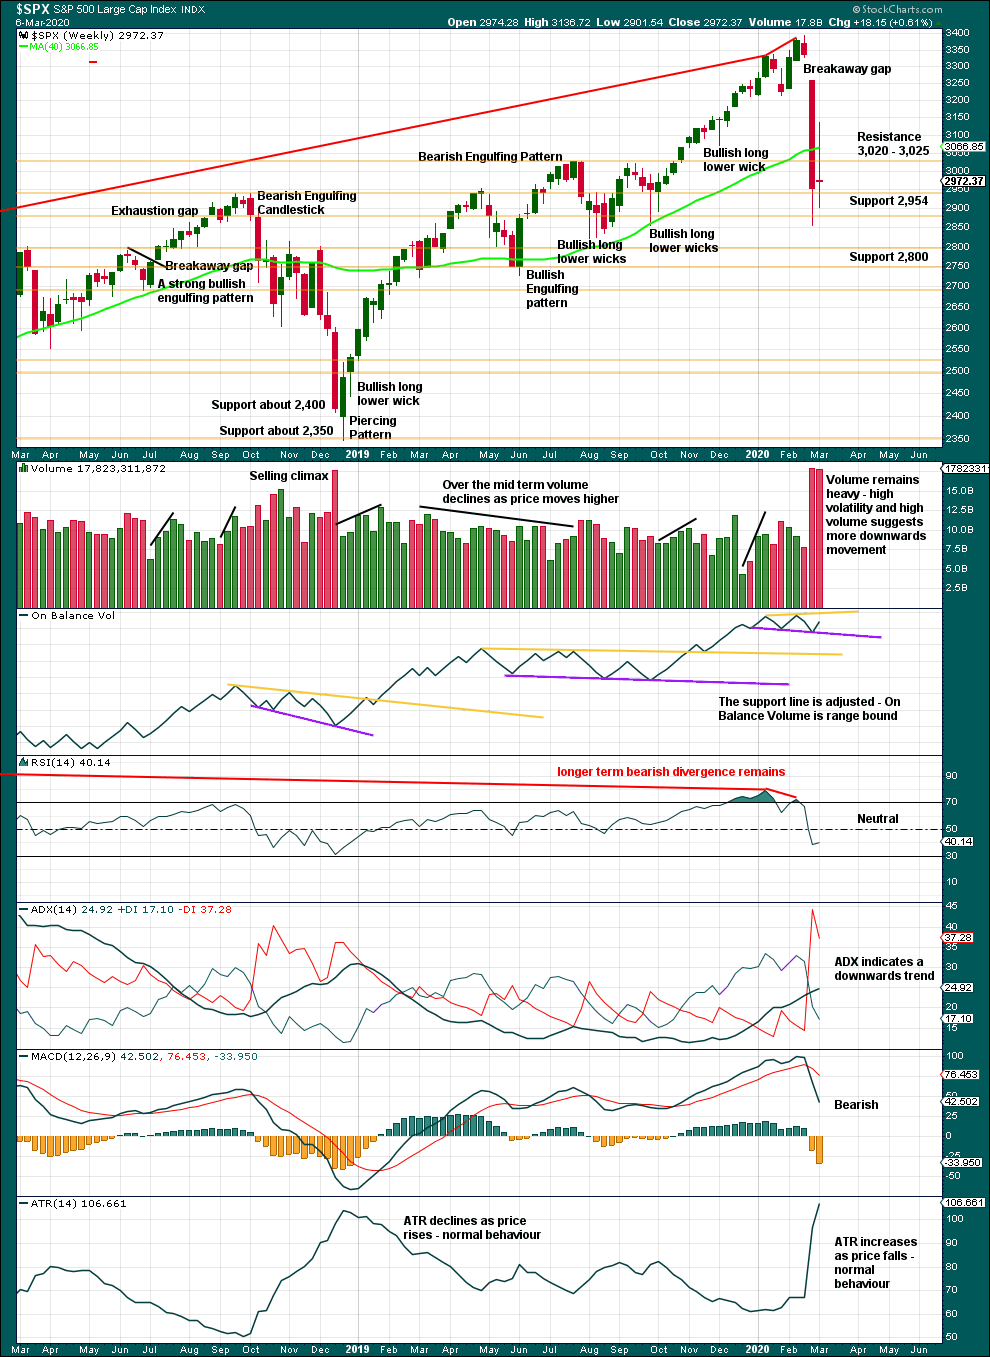
A 19.4% drop in price (high to low) so far has precedent within the larger bull market. It does not necessarily mean the secular bull market must be over.
At the weekly chart level, conditions are not yet oversold; this pullback may be expected to continue further.
A long legged doji last week represents a pause, a balance of bulls and bears. This is not a reversal pattern; doji appear within trends or consolidations.
DAILY CHART
Click chart to enlarge. Chart courtesy of StockCharts.com.
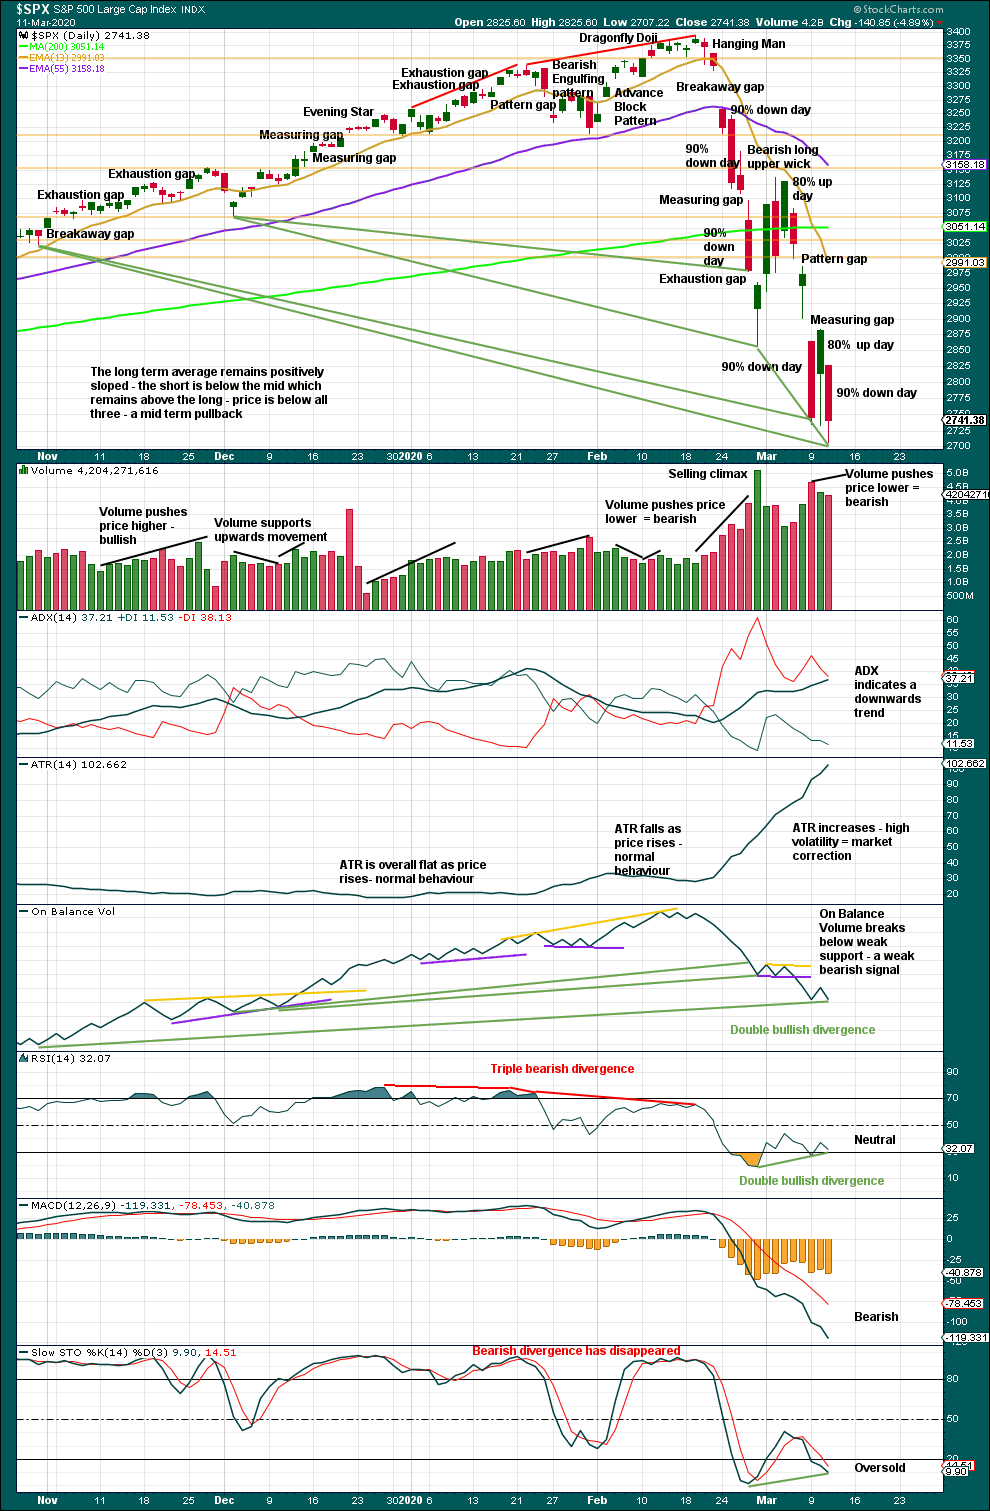
There are now five 90% downwards days in this strong downwards movement.
The following indicators now suggest a low may be in place here or very soon indeed:
– RSI reached deeply oversold and now exhibits short-term bullish divergence with price.
– Stochastics reached oversold and now exhibits short-term bullish divergence with price.
– On Balance Volume continues to exhibit bullish divergence with price.
The following indications will be looked for to provide confidence that a low is in place:
– A 90% upwards day.
– Two back to back 80% upwards days.
– A bullish candlestick reversal pattern.
Next support is in a zone from 2,600 to 2,550.
BREADTH – AD LINE
WEEKLY CHART
Click chart to enlarge. Chart courtesy of StockCharts.com. So that colour blind members are included, bearish signals will be noted with blue and bullish signals with yellow.
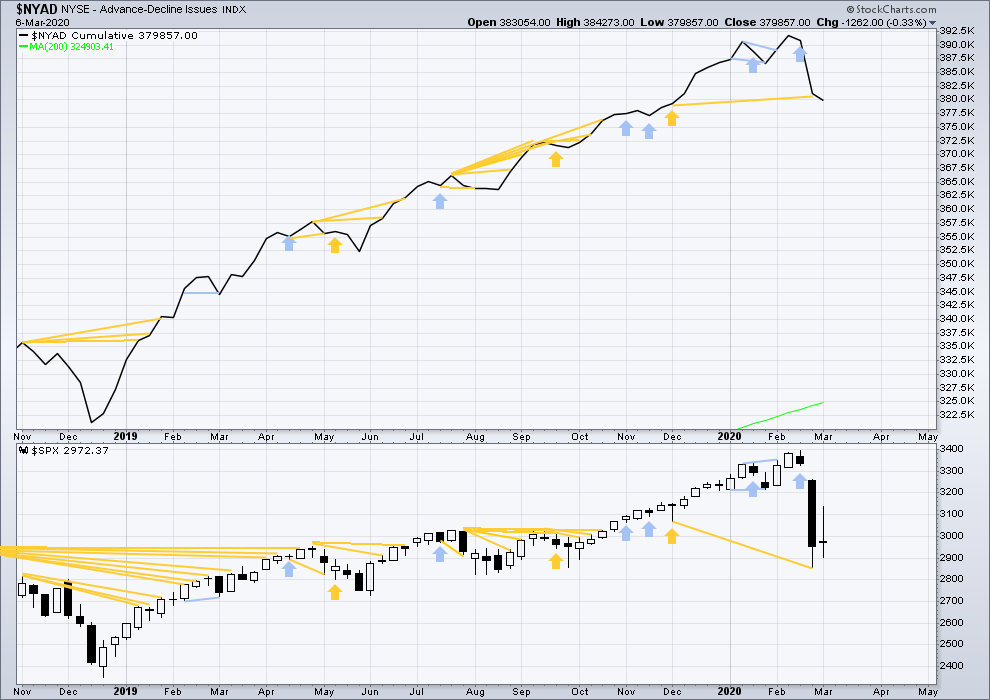
Bear markets from the Great Depression and onwards have been preceded by an average minimum of 4 months divergence between price and the AD line with only two exceptions in 1946 and 1976. With the AD line making new all time highs with last all time highs from price, the end of this bull market and the start of a new bear market is very likely a minimum of 4 months away, which is mid June 2020.
In all bear markets in the last 90 years there is some positive correlation (0.6022) between the length of bearish divergence and the depth of the following bear market. No to little divergence is correlated with more shallow bear markets. Longer divergence is correlated with deeper bear markets.
If a bear market does develop here, it comes after no bearish divergence. It would therefore more likely be shallow.
Last week price has moved sideways and the AD line has slightly declined. This is very slight bearish divergence.
Large caps all time high: 3,393.52 on 19th February 2020.
Mid caps all time high: 2,109.43 on 20th February 2020.
Small caps all time high: 1,100.58 on 27th August 2018.
DAILY CHART
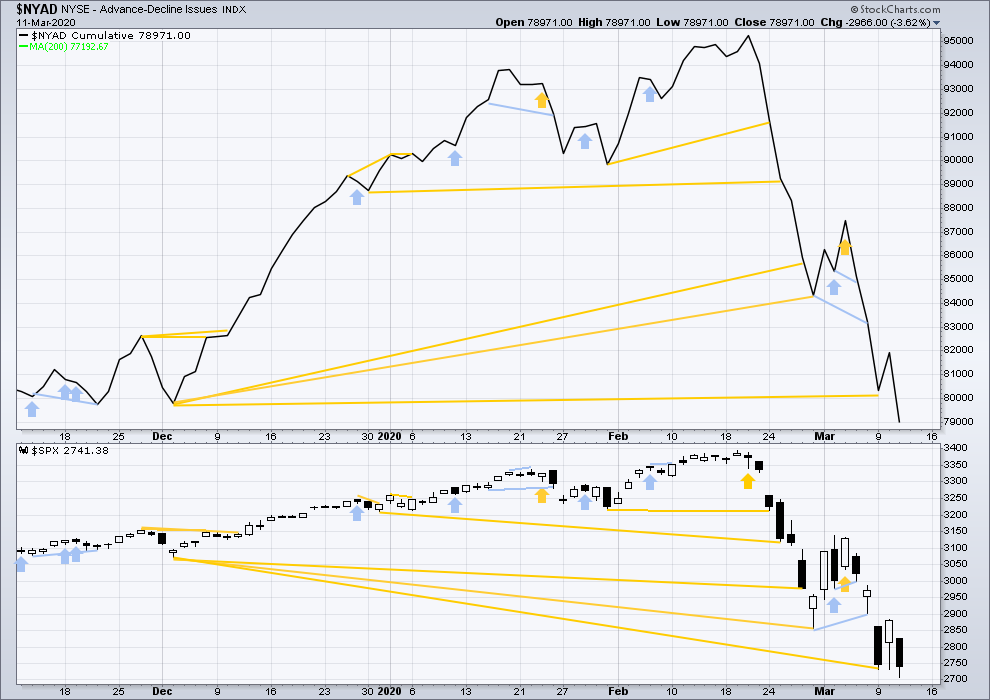
Click chart to enlarge. Chart courtesy of StockCharts.com. So that colour blind members are included, bearish signals will be noted with blue and bullish signals with yellow.
Breadth should be read as a leading indicator.
Both price and the AD line have moved lower today. Short-term bullish divergence has disappeared, but there is still mid-term bullish divergence. Price has made new lows below August 5, 2019, but the AD line has not (not shown on this chart, best viewed on the weekly chart). Price continues to fall faster than breadth.
VOLATILITY – INVERTED VIX CHART
WEEKLY CHART
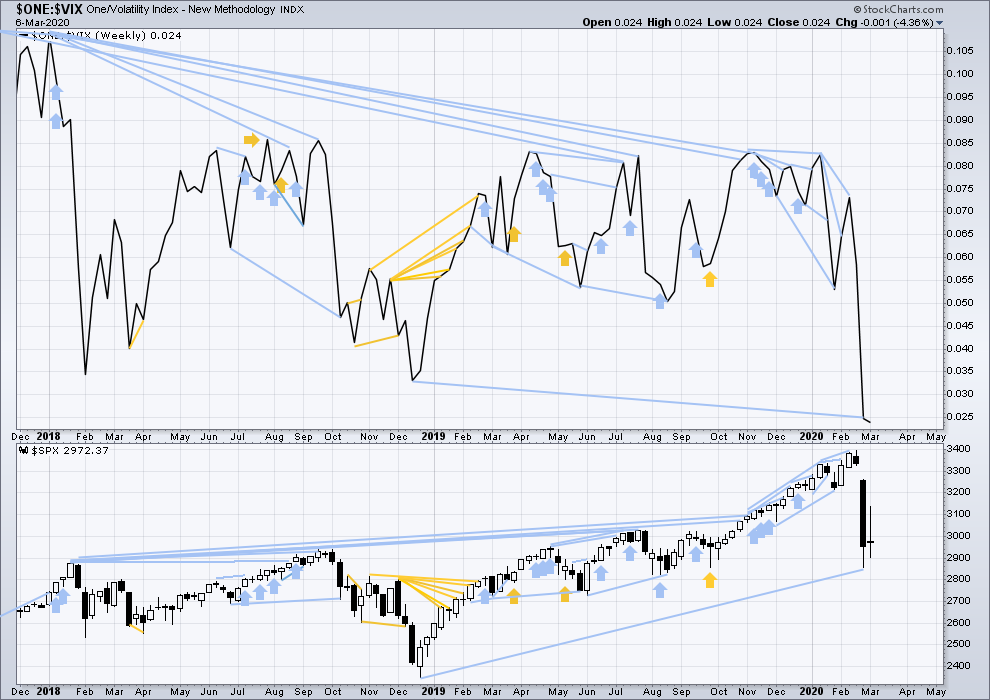
Click chart to enlarge. Chart courtesy of StockCharts.com. So that colour blind members are included, bearish signals will be noted with blue and bullish signals with yellow.
The all time high for inverted VIX was on 30th October 2017. There is now over two years of bearish divergence between price and inverted VIX.
The rise in price is not coming with a normal corresponding decline in VIX; VIX remains elevated. This long-term divergence is bearish and may yet develop further as the bull market matures.
This divergence may be an early warning, a part of the process of a top developing that may take years. It is clearly not useful in timing a trend change from bull to a fully fledged bear market.
Last week price has moved sideways and inverted VIX has moved slightly lower. This divergence is bearish for the short term.
DAILY CHART
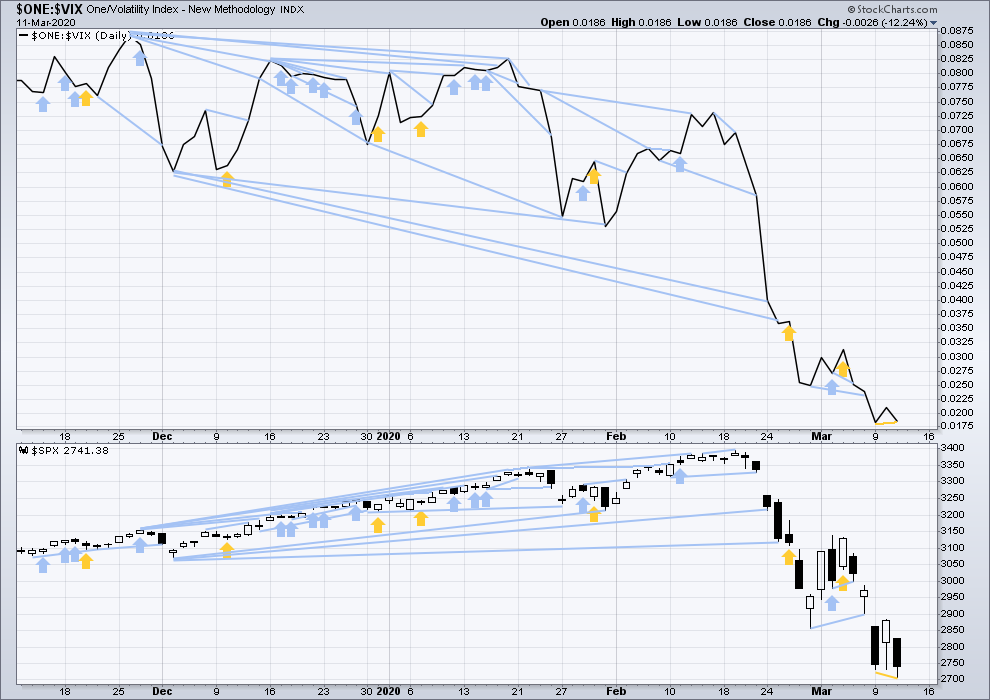
Click chart to enlarge. Chart courtesy of StockCharts.com. So that colour blind members are included, bearish signals will be noted with blue and bullish signals with yellow.
Both price and inverted VIX have moved lower today. Price has made a new short-term low below the low two sessions prior, but inverted VIX has not. This divergence is bullish for the short term, but it is weak and not confirmed by similar short-term divergence between price and the AD line, so it shall be given no weight in this analysis.
DOW THEORY
Dow Theory would confirm a bull market if the following highs are made:
DJIA: 26,951.81 – a close above this point has been made on the 3rd of July 2019.
DJT: 11,623.58 – to date DJT has failed to confirm an ongoing bull market.
S&P500: 2,940.91 – a close above this point was made on the 29th of April 2019.
Nasdaq: 8,133.30 – a close above this point was made on the 26th of April 2019.
Dow Theory would confirm a bear market if the following lows are made on a closing basis:
DJIA: 21,712.53
DJT: 8,636.79 – a close below this point has been made on March 9, 2020.
S&P500: 2,346.58
Nasdaq: 7,292.22
—
Always practice good risk management as the most important aspect of trading. Always trade with stops and invest only 1-5% of equity on any one trade. Failure to manage risk is the most common mistake new traders make.
We bounced off the 60 month moving average (orange line)… We still have higher highs and higher lows among the big corrections…
Still a bull market to me…
On Thursday, it was a potential low as we had 90% down day and a 90% up day on Friday.
My opinion is that it is a great buying opportunity.
Thanks for the update, Lara.
The big channel on my first two monthly charts is now being breached.
The second alternate monthly may become the main wave count, if those channels are breached by a full daily candlestick below and not touching the lower trend line.
Target for a final low would be 2,352.
thanks for update