
SILVER: Elliott Wave and Technical Analysis | Charts – March 13, 2020
A target for downwards movement has not yet been met. A new low this week below 16.195 has added further confidence to the main wave count and a downwards trend.
Summary: A target after the downwards breakout is now calculated at 14.10. About there, a multi-week consolidation may begin. The larger trend for Silver is now down.
ELLIOTT WAVE COUNTS
MAIN WAVE COUNT
MONTHLY CHART
Click chart to enlarge.
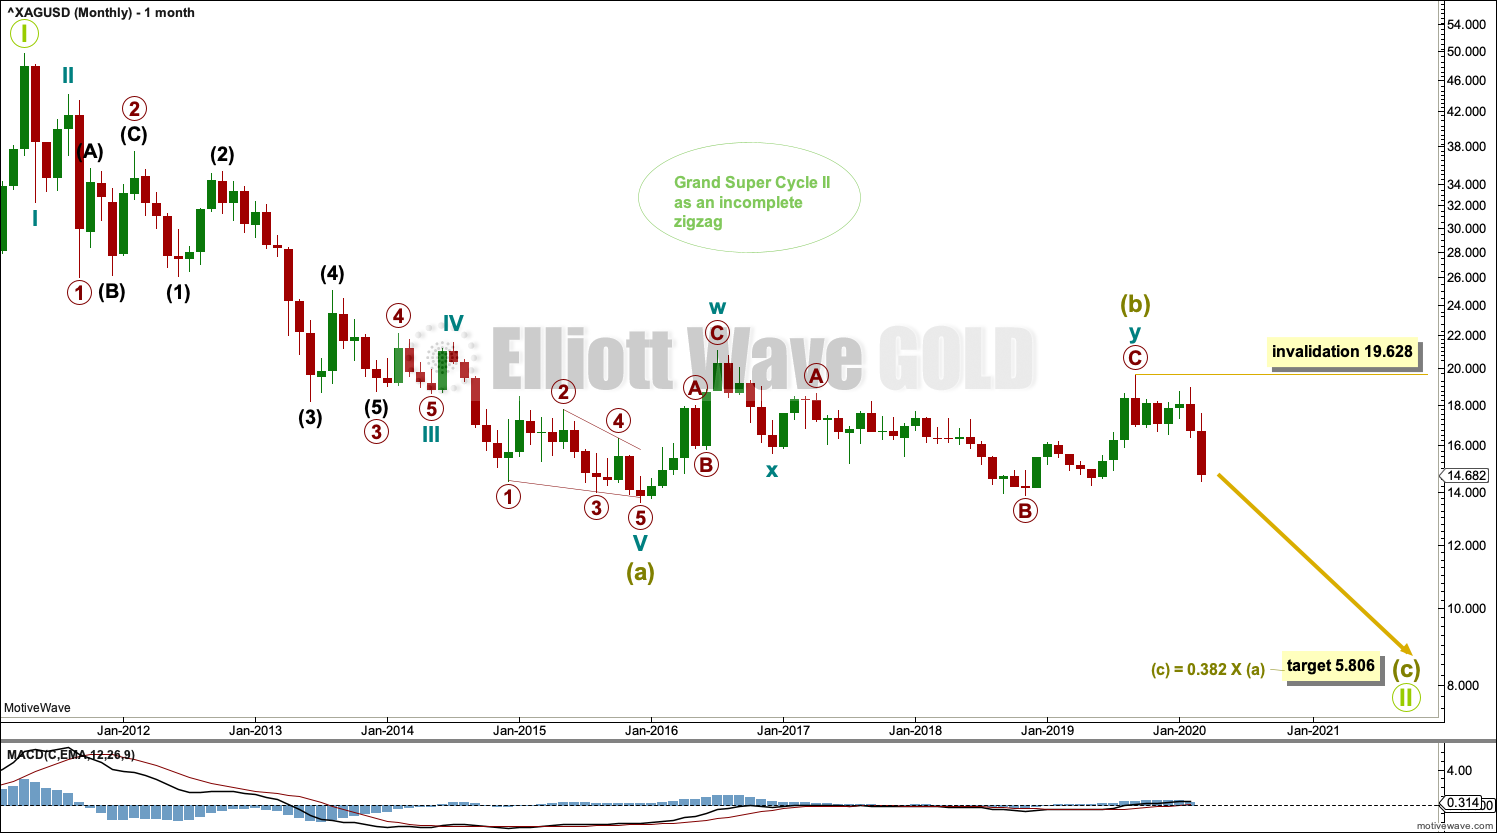
The bear market for Silver may be incomplete. Within a bearish movement, in the middle there should be a large interruption to the trend in the form of a B wave; bearish movements should have a three wave look to them. This wave count expects that normal look, so it has a higher probability than the alternate.
This Elliott wave structure for this bear market is labelled as a single zigzag for Grand Super Cycle wave II. Single zigzags are the most common Elliott wave corrective structure.
Within the zigzag, Super Cycle wave (a) subdivides as a five wave impulse, and Super Cycle wave (b) may now be a complete double combination. Super Cycle wave (c) may not have begun and must subdivide as a five wave motive structure, either an impulse (much more likely) or an ending diagonal (less likely but still possible).
A target is now calculated for Super Cycle wave (c) to complete the zigzag for Grand Super Cycle wave II. Calculations using the more common ratios of equality and 0.618 yield negative results, so the next Fibonacci ratio in the sequence of 0.382 is used.
Within Super Cycle wave (c), no second wave correction may move beyond its start above 19.628.
WEEKLY CHART
Click chart to enlarge.
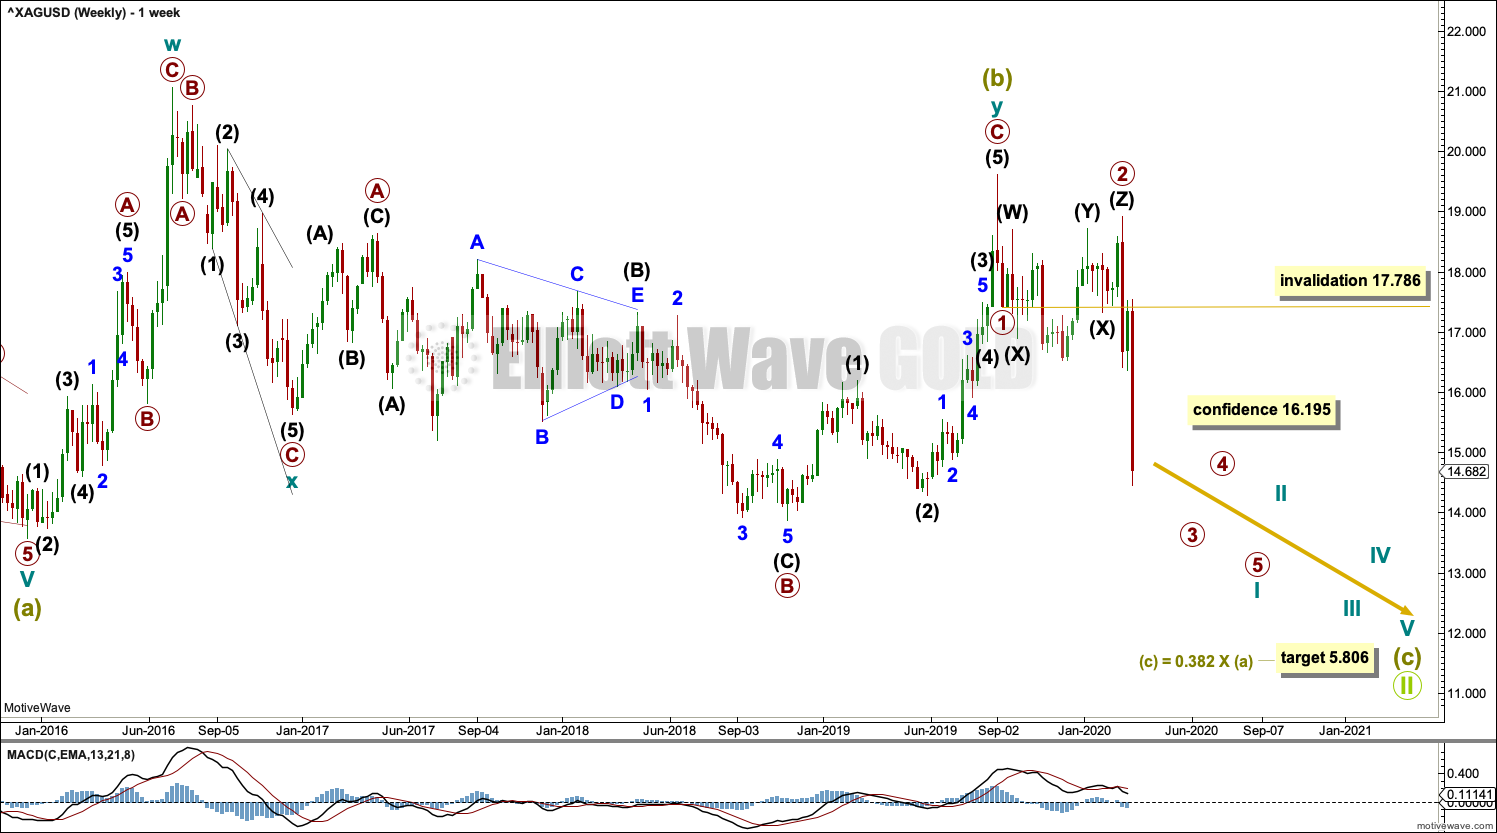
Super Cycle wave (b) may be a complete double combination.
Within the double combination, cycle wave w may be a complete zigzag, cycle wave x completes as a corrective structure (a zigzag) in the opposite direction to join the two structures of the double combination, and cycle wave y may be a complete expanded flat correction. Within the expanded flat, primary wave B is a 1.58 length of primary wave A; this is longer than the common range of up to 1.38 but within an allowable guideline of up to 2. There is no Fibonacci ratio between primary waves C and A.
If Super Cycle wave (b) is over, then Super Cycle wave (c) may have begun. Super Cycle wave (c) must subdivide as a five wave motive structure, most likely an impulse. The first five down within Super Cycle wave (c) at this time frame is labelled cycle wave I. Within cycle wave I, primary waves 1 and 2 may be complete. Primary wave 4 may not move into primary wave 1 price territory above 17.786 (this point is taken from detail on the daily chart).
DAILY CHART
Click chart to enlarge.
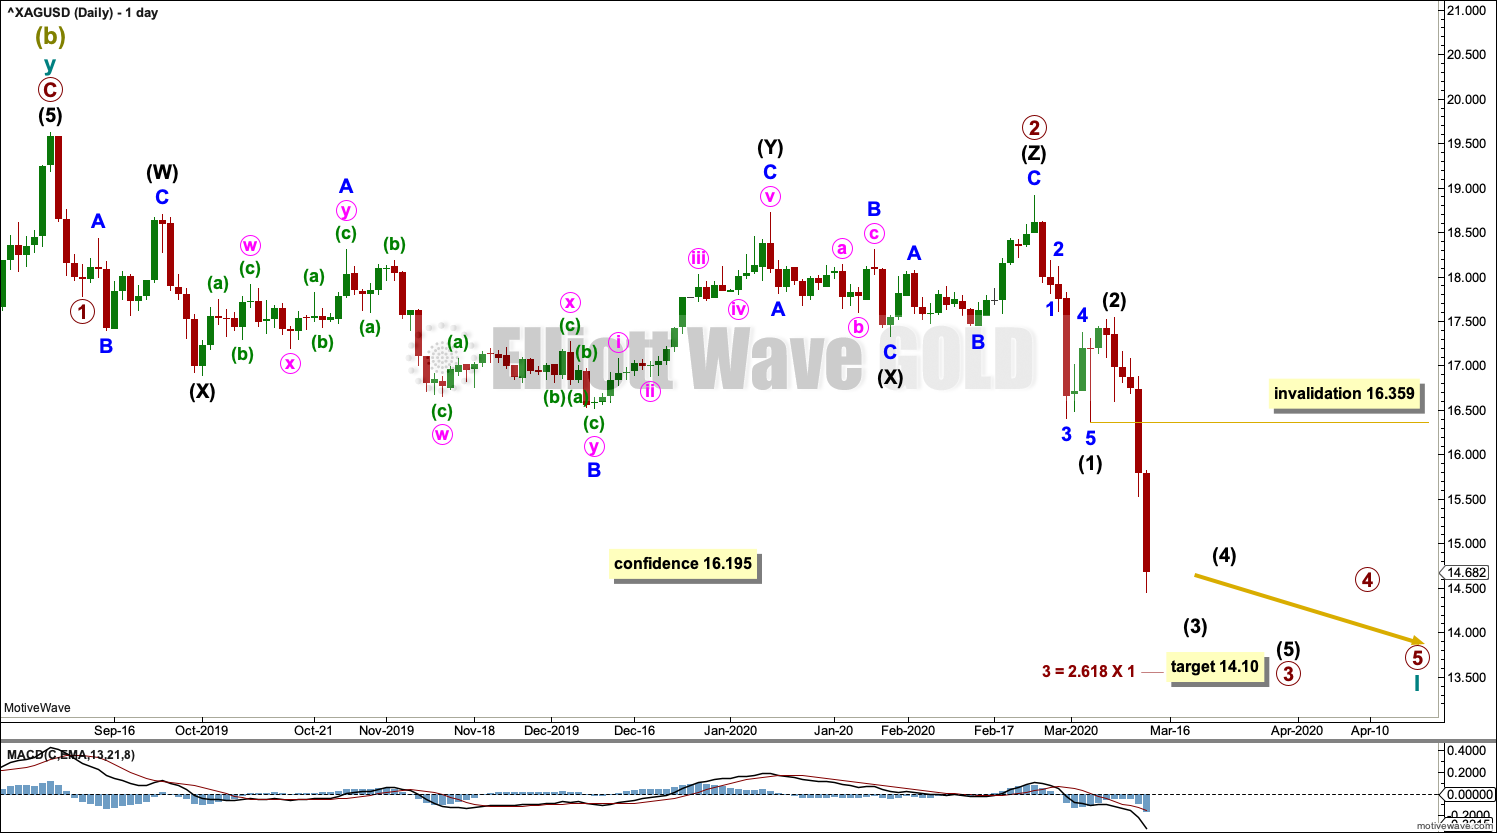
Cycle wave I must subdivide as a five wave motive structure, most likely an impulse.
Within cycle wave I, primary waves 1 and 2 may be complete. Primary wave 2 fits as a very rare triple combination: flat – X – flat – X – zigzag. All subdivisions fit very well, so a very rare structure in this position may be acceptable.
Primary wave 3 may only subdivide as an impulse. Within the impulse, intermediate waves (1) and (2) may be over. Intermediate wave (3) may continue lower. When it arrives, intermediate wave (4) may be relatively brief and shallow and may not move into intermediate wave (1) price territory above 16.359.
Primary wave 2 was a triple combination lasting 24 weeks. Primary wave 4 may exhibit alternation as a zigzag; it may be much quicker than primary wave 2, but it may still count in weeks.
ALTERNATE WAVE COUNT
MONTHLY CHART
Click chart to enlarge.
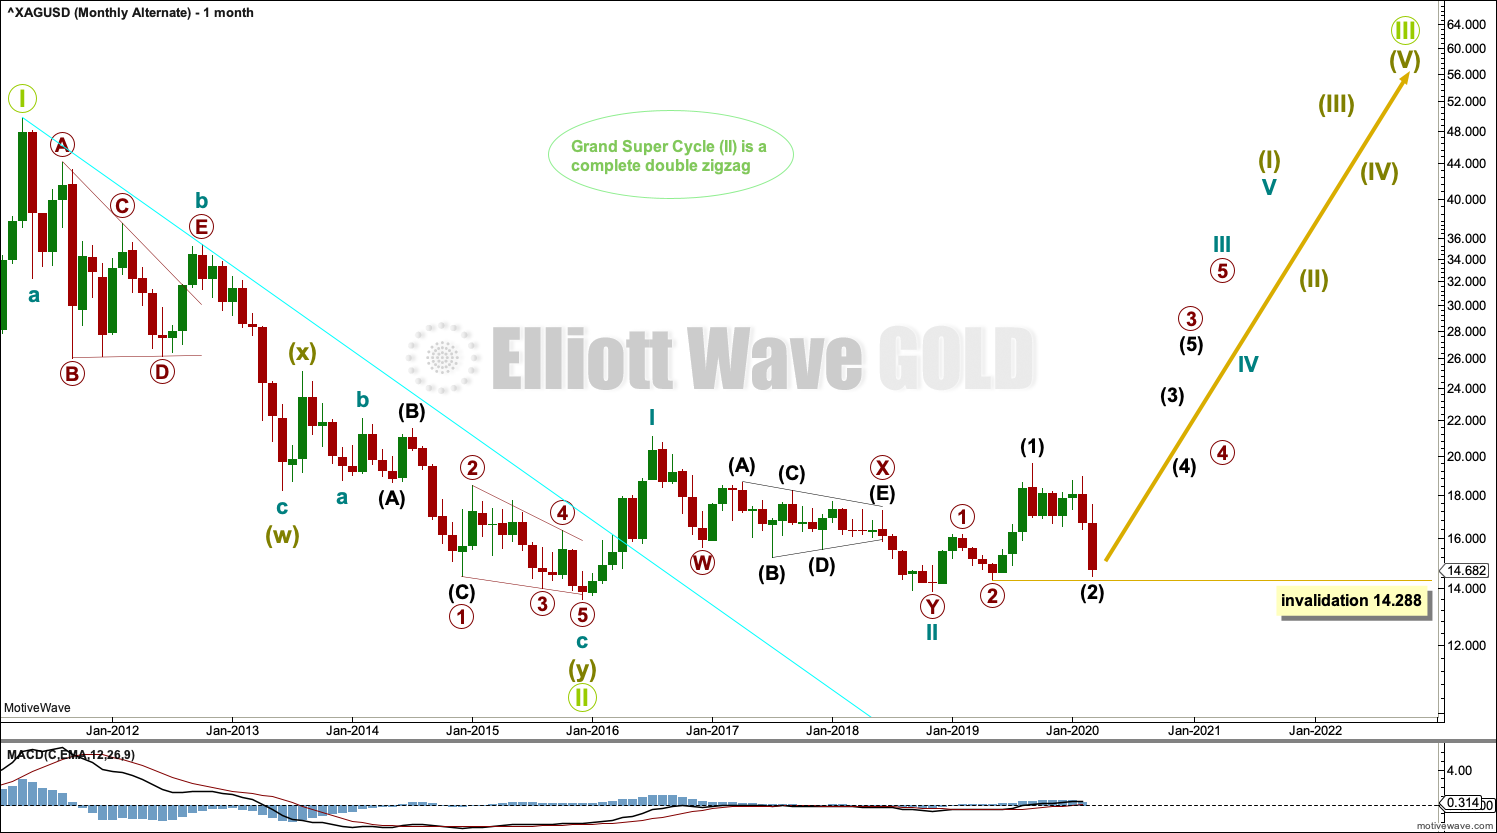
This bullish Elliott wave count sees a new bull market beginning for Silver at the low in December 2015.
A new bull market should begin with a five wave structure upwards. This is labelled cycle wave I.
Following five steps forward should be three steps back. This is labelled cycle wave II. The Elliott wave corrective structure of cycle wave II is labelled as a double zigzag, which is a fairly common structure.
Cycle wave III may only subdivide as an impulse. Within cycle wave III, primary waves 1 and 2 may be complete. Within primary wave 3, intermediate waves (1) and (2) may be complete. Intermediate wave (2) may not move beyond the start of intermediate wave (1) below 14.288.
If price makes a new low below 14.288 now, then it would be very difficult for the subdivisions of this wave count to fit into an alternate labelling. This wave count may then be fully discarded.
TECHNICAL ANALYSIS
WEEKLY CHART

Click chart to enlarge. Chart courtesy of StockCharts.com.
A downwards breakout has completed as expected was most likely. Look now for resistance at prior support in a zone 16.05 to 15.65. A close this week very near lows suggests more downwards movement next week. Look for support in identified areas below.
DAILY CHART
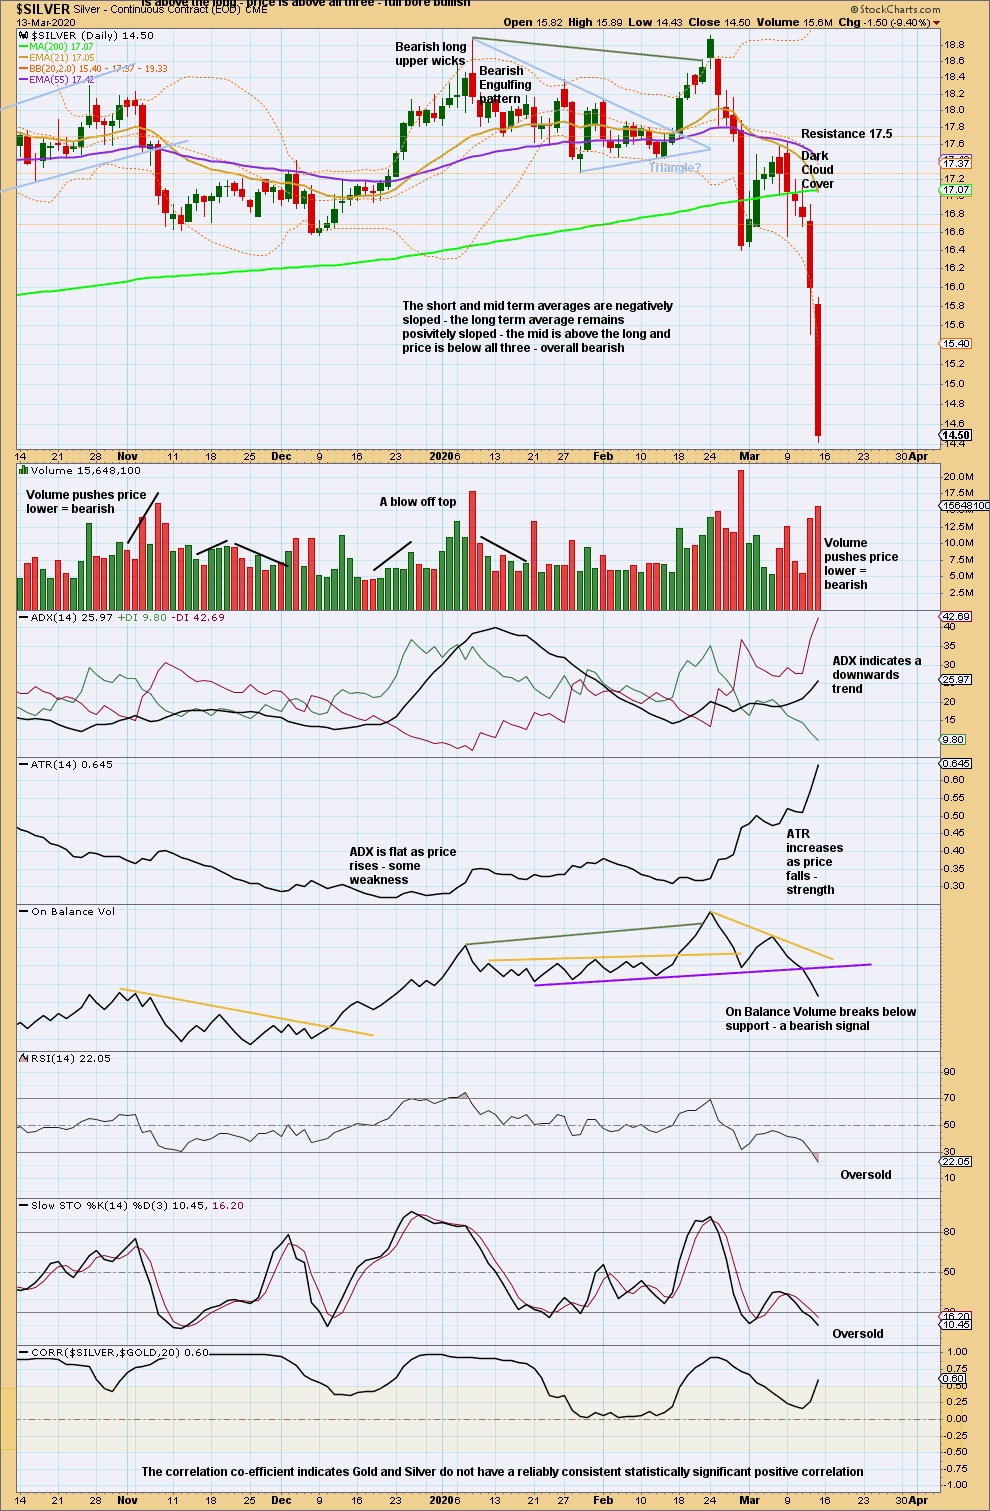
Click chart to enlarge. Chart courtesy of StockCharts.com.
Last week the bounce was expected to be over, which has turned out to be correct.
There is a downwards trend. RSI may reach further oversold and Stochastics may remain oversold for long periods of time when this market trends.
Published @ 01:36 p.m. EST on March 14, 2020.
—
Careful risk management protects your trading account(s).
Follow my two Golden Rules:
1. Always trade with stops.
2. Risk only 1-5% of equity on any one trade.
—
New updates to this analysis are in bold.
Lara, Have you considered a triangle for Super Cycle B?
https://www.tradingview.com/x/e44DWDCQ/
Why no, I have not. But that looks really good. I’ll chart the idea and check subdivisions…
This is a good looking chart and might help explain a bounce in risk assets into the summer months.
Well, back to the drawing board. Silver sliced right through the bottom today