
US OIL: Elliott Wave and Technical Analysis | Charts – March 13, 2020
A target for support was at 28.24. Oil has fallen to 27.35, where it bounced, which was 0.89 below the target.
Summary: A multi-week interruption to the downwards trend may continue for another few days. Thereafter, the downwards trend may resume to a final target at 9.77.
MAIN ELLIOTT WAVE COUNT – BEARISH
MONTHLY CHART
Click chart to enlarge.
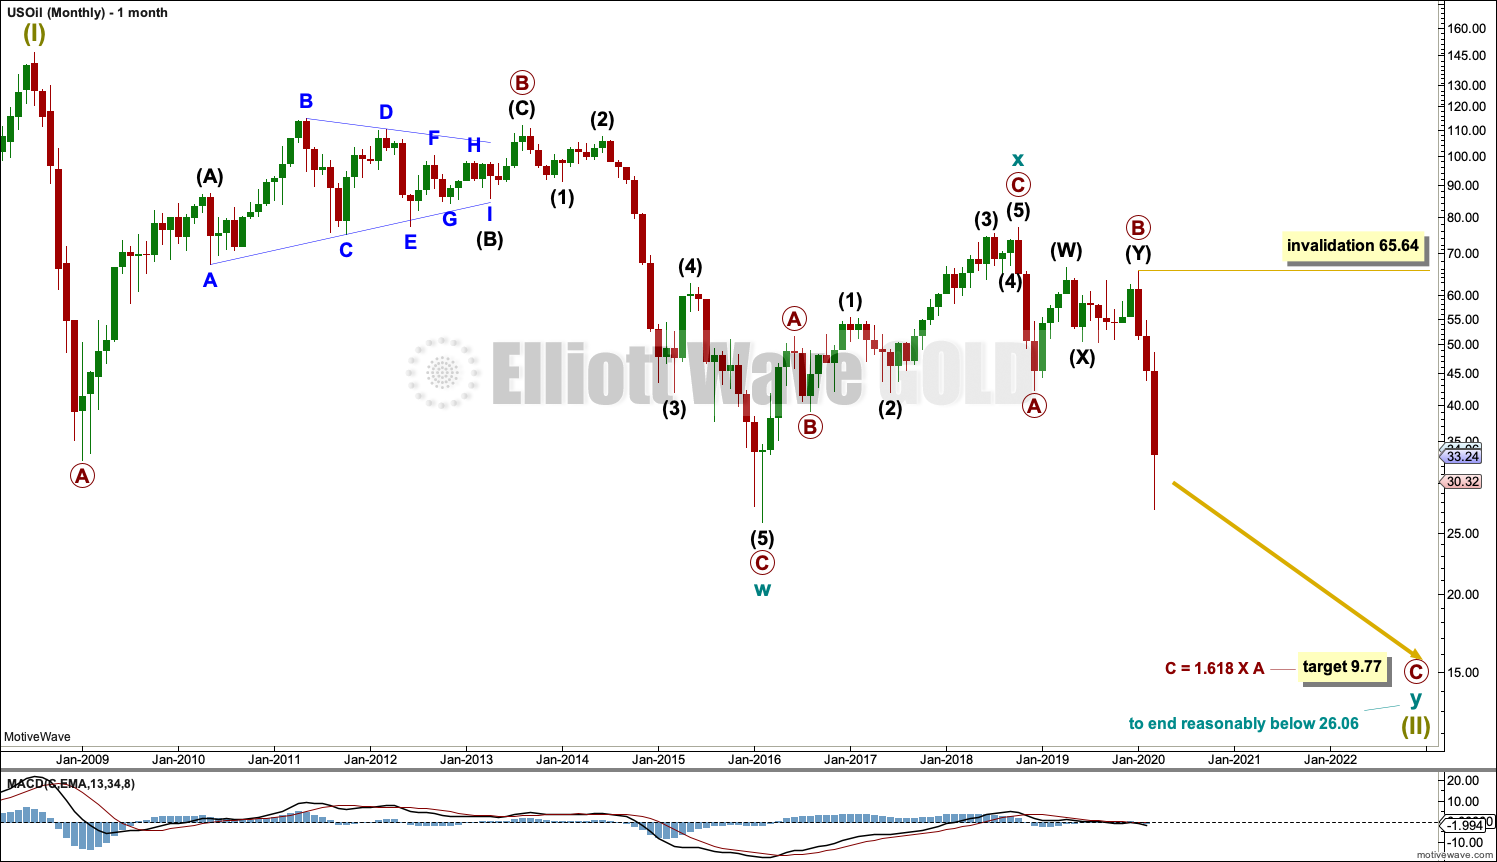
The basic Elliott wave structure is five steps forward and three steps back. This Elliott wave count expects that US Oil is still within a three steps back pattern, which began in July 2008. The Elliott wave count expects that the bear market for US Oil continues.
This Elliott wave corrective structure is a double zigzag, which is a fairly common structure. The correction is labelled Super Cycle wave (II).
The first zigzag in the double is complete and labelled cycle wave w. The double is joined by a three in the opposite direction labelled cycle wave x, which subdivides as a zigzag. The second zigzag in the double may now have begun, labelled cycle wave y.
The purpose of a second zigzag in a double zigzag is to deepen the correction when the first zigzag does not move price deep enough. To achieve this purpose cycle wave y may be expected to move reasonably below the end of cycle wave w at 26.06.
Primary wave C would reach equality in length with primary wave A at 31.11. This target is not low enough; it would not see cycle wave y move reasonably below the end of cycle wave w at 26.06. The next Fibonacci ratio of 1.618 is used to calculate a target for primary wave C and cycle wave y to end.
Cycle wave y is expected to subdivide as a zigzag, which subdivides 5-3-5.
Cycle wave w lasted 7.6 years and cycle wave x lasted 2.7 years. Cycle wave y now looks like it may be over within a few more months.
Within primary wave C, no second wave correction may move beyond the start of its first wave above 65.64.
WEEKLY CHART

Click chart to enlarge.
This weekly chart shows all of cycle wave y so far.
Cycle wave y is expected to subdivide as a zigzag. A zigzag subdivides 5-3-5. Primary wave A must subdivide as a five wave structure if this wave count is correct.
Primary wave A may be a complete five wave impulse at the last low.
Primary wave B may be a complete double combination: zigzag – X – flat. Intermediate wave (W) fits as a zigzag. Intermediate wave (Y) may be a complete regular flat correction.
Primary wave C must subdivide as a five wave motive structure, most likely an impulse. Within primary wave C, intermediate waves (1) through to (3) may be complete. Intermediate wave (4) may not move into intermediate wave (1) price territory above 49.32.
DAILY CHART
Click chart to enlarge.
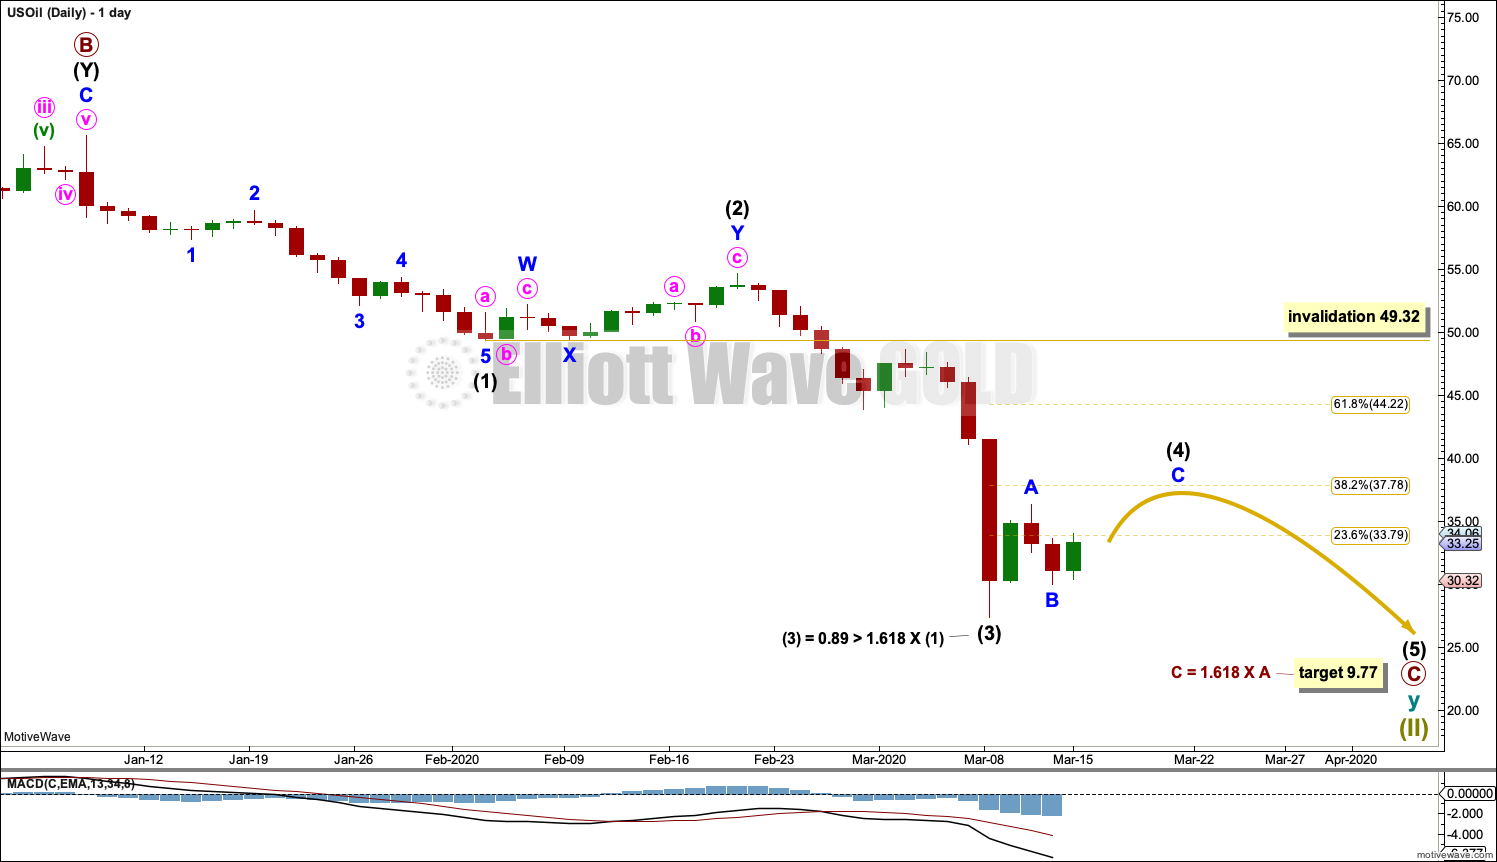
Primary wave C must subdivide as a five wave motive structure, most likely an impulse. Within primary wave C, intermediate waves (1) through to (3) may now be complete.
Although it looks like a three wave structure, intermediate wave (3) is labelled as complete. There may have been a quick fourth wave correction that does not show up on the daily chart for minor wave 4, but it can be seen on the hourly chart. This would be typical behaviour for a commodity.
Intermediate wave (4) may end about the 0.382 Fibonacci ratio of intermediate wave (3). Thereafter, intermediate wave (5) may continue downwards towards the final target.
When intermediate wave (4) may be complete, then the final target may be calculated at intermediate, primary and cycle degrees. At that stage, the target may change or may widen to a zone.
ALTERNATE ELLIOTT WAVE COUNT
MONTHLY CHART
Click chart to enlarge.
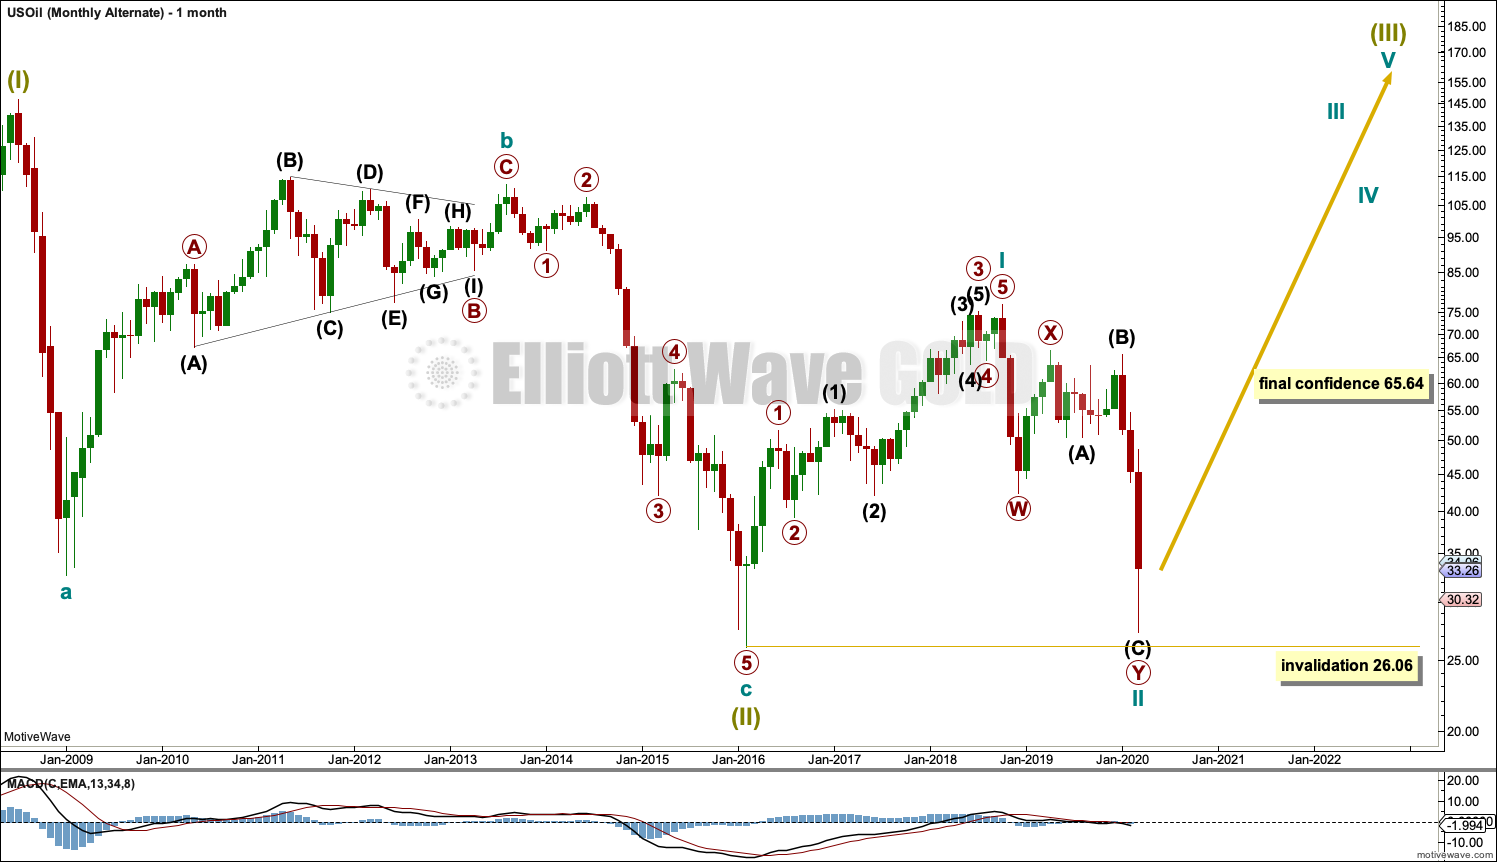
It is possible that the bear market is over for Oil and a new bull market has begun.
For a bullish wave count for Oil, the upwards wave from the major low at 26.06 in February 2016 must be seen as a complete five wave impulse. This is labelled cycle wave I.
Cycle wave II may be continuing lower as a double zigzag. Cycle wave II may no move beyond the start of cycle wave I below 26.06.
WEEKLY CHART
Click chart to enlarge.
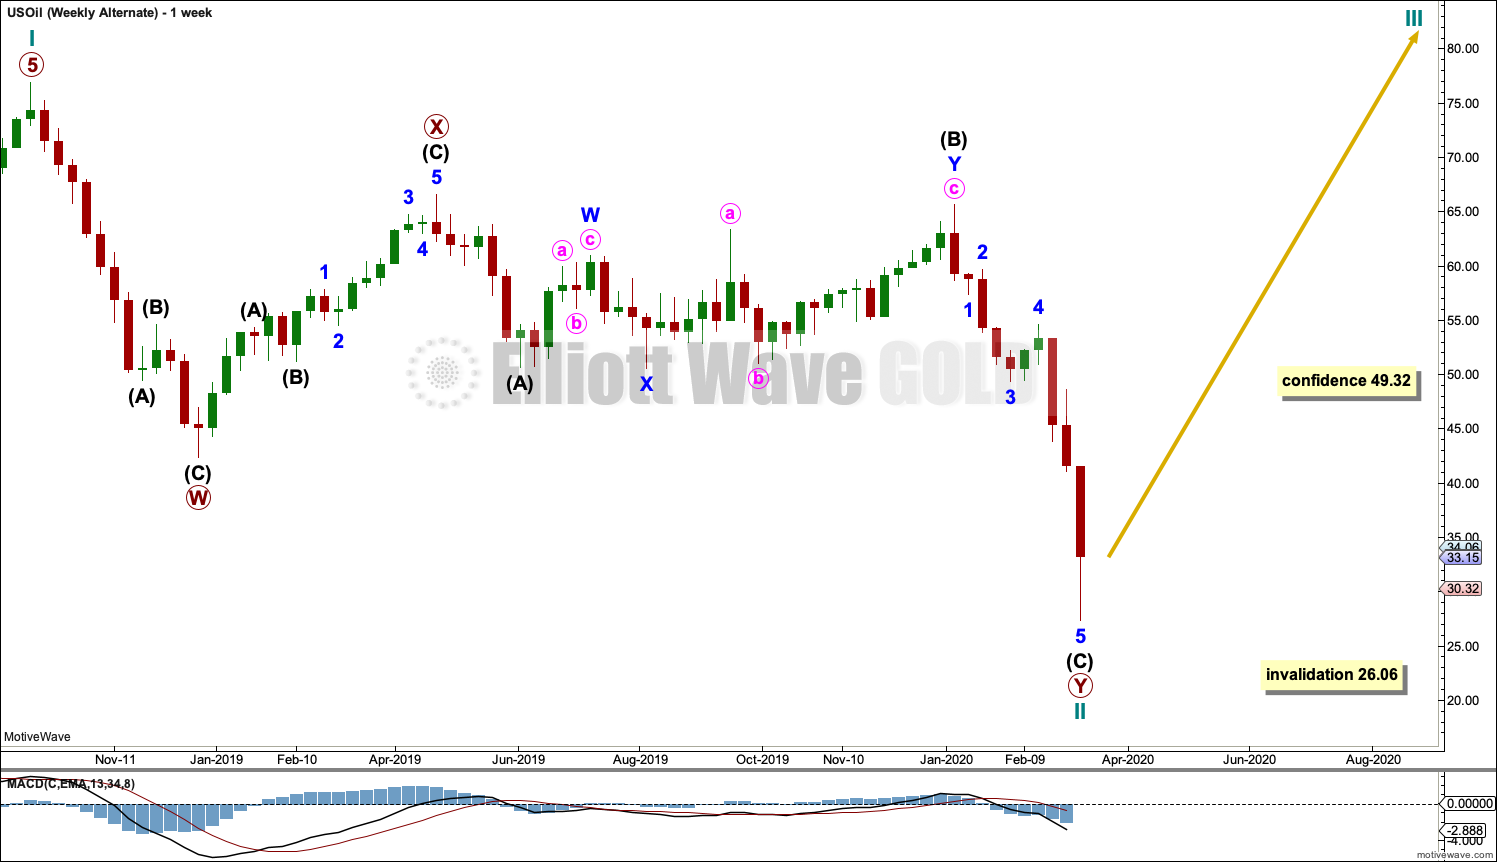
Cycle wave II may be continuing lower as a double zigzag. The structure may be complete here, or minor wave 5 of intermediate wave (C) may continue lower.
Cycle wave II may not move beyond the start of cycle wave I below 26.06.
DAILY CHART
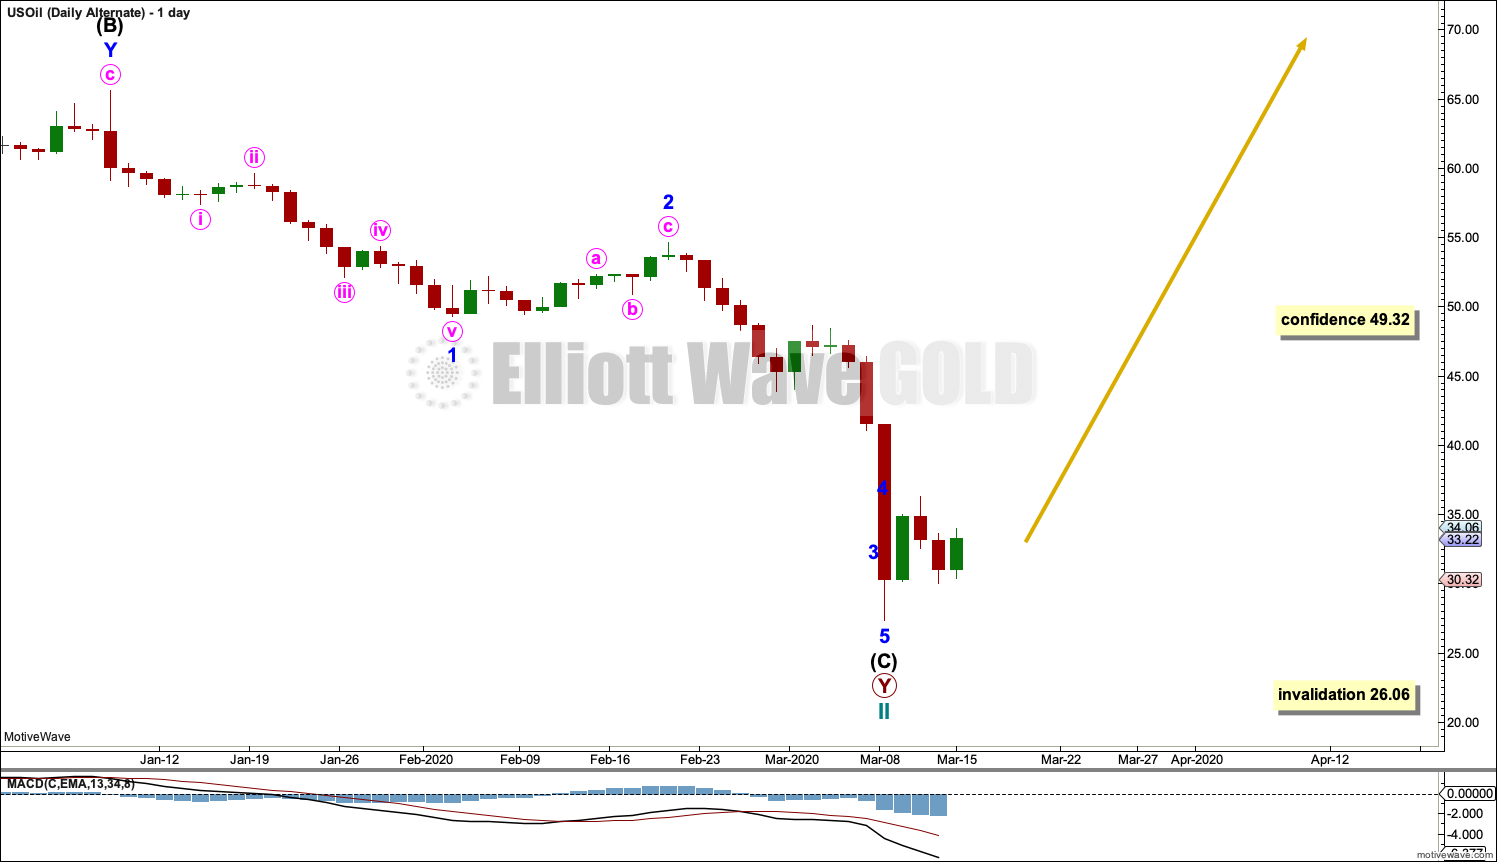
Click chart to enlarge.
The structure of intermediate wave (C) may be complete. This wave count now requires a new high above 54.65 for confidence.
TECHNICAL ANALYSIS
MONTHLY CHART
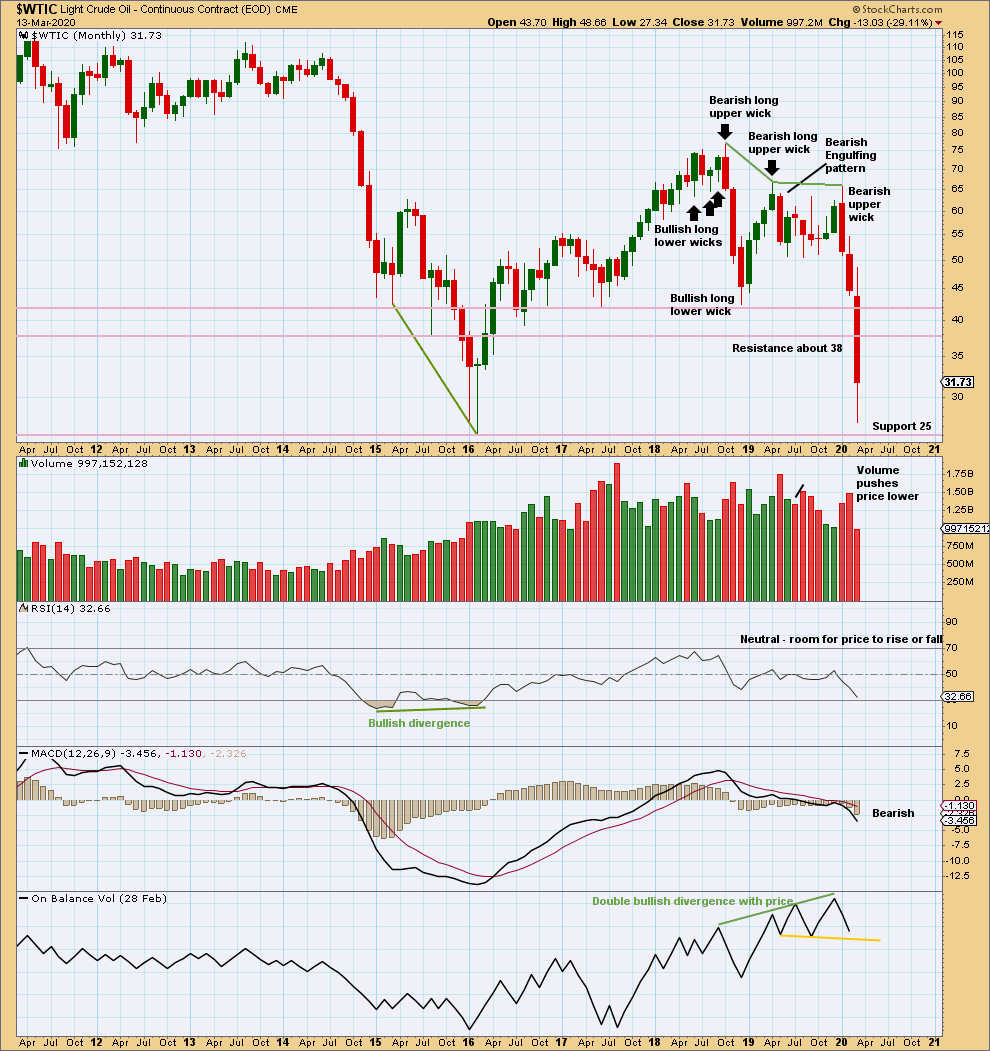
Click chart to enlarge. Chart courtesy of StockCharts.com.
Both January and February have increased range and volume for downwards movement. This supports the main Elliott wave count.
A close below support about 42 on a downwards day with support from volume is significant downwards breakout at this time frame.
WEEKLY CHART
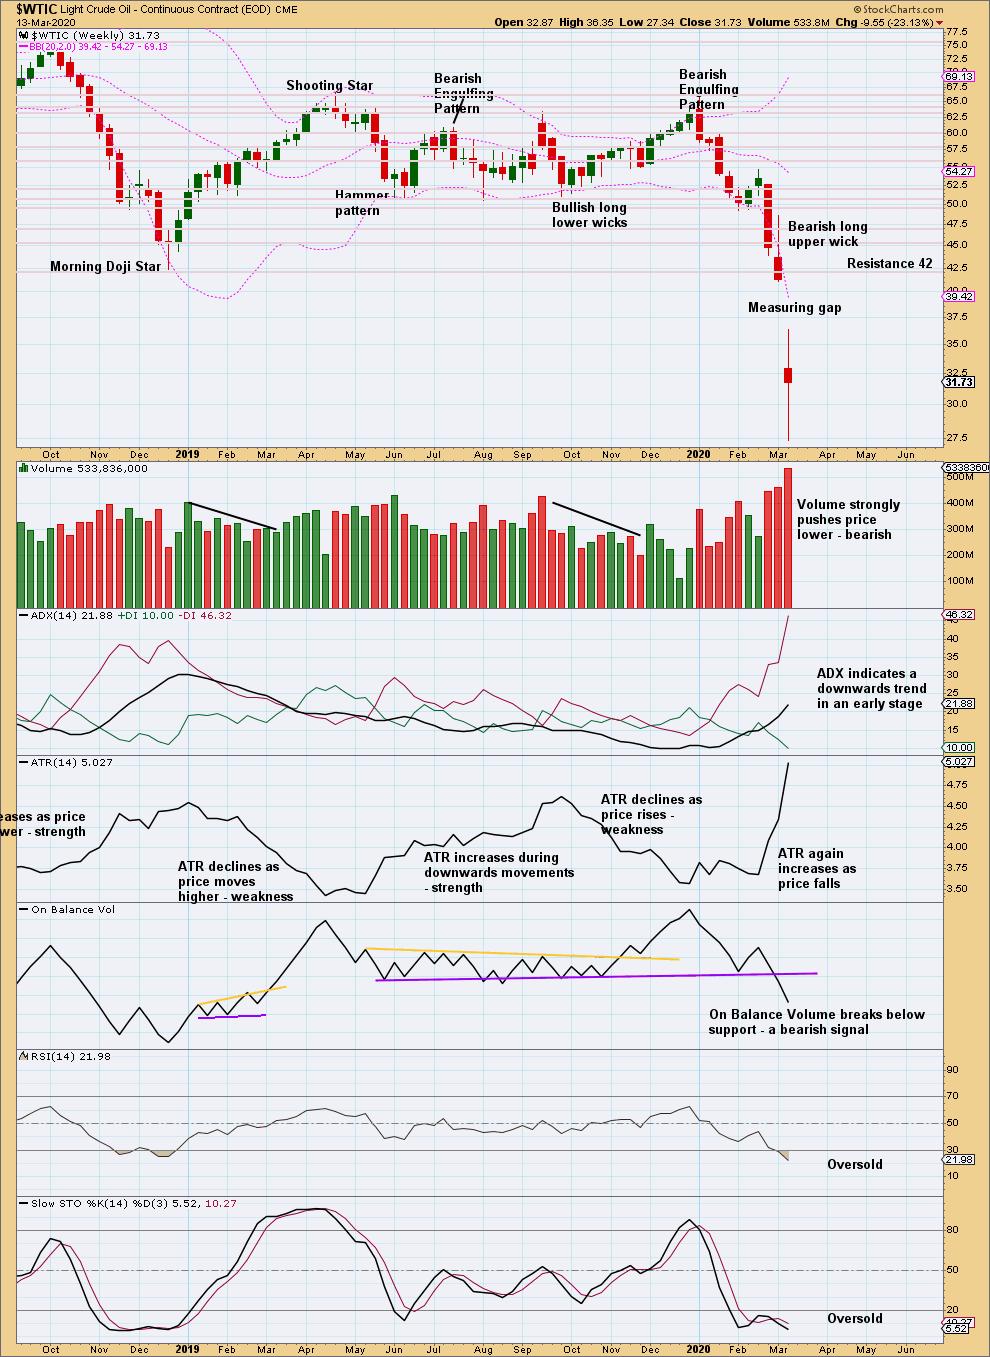
Click chart to enlarge. Chart courtesy of StockCharts.com.
A downwards breakout below prior support about 51 – 50 has been effected. This breakout has support from volume, so some confidence may be had in it.
This week’s measuring gap gives a new target at 22.74.
DAILY CHART
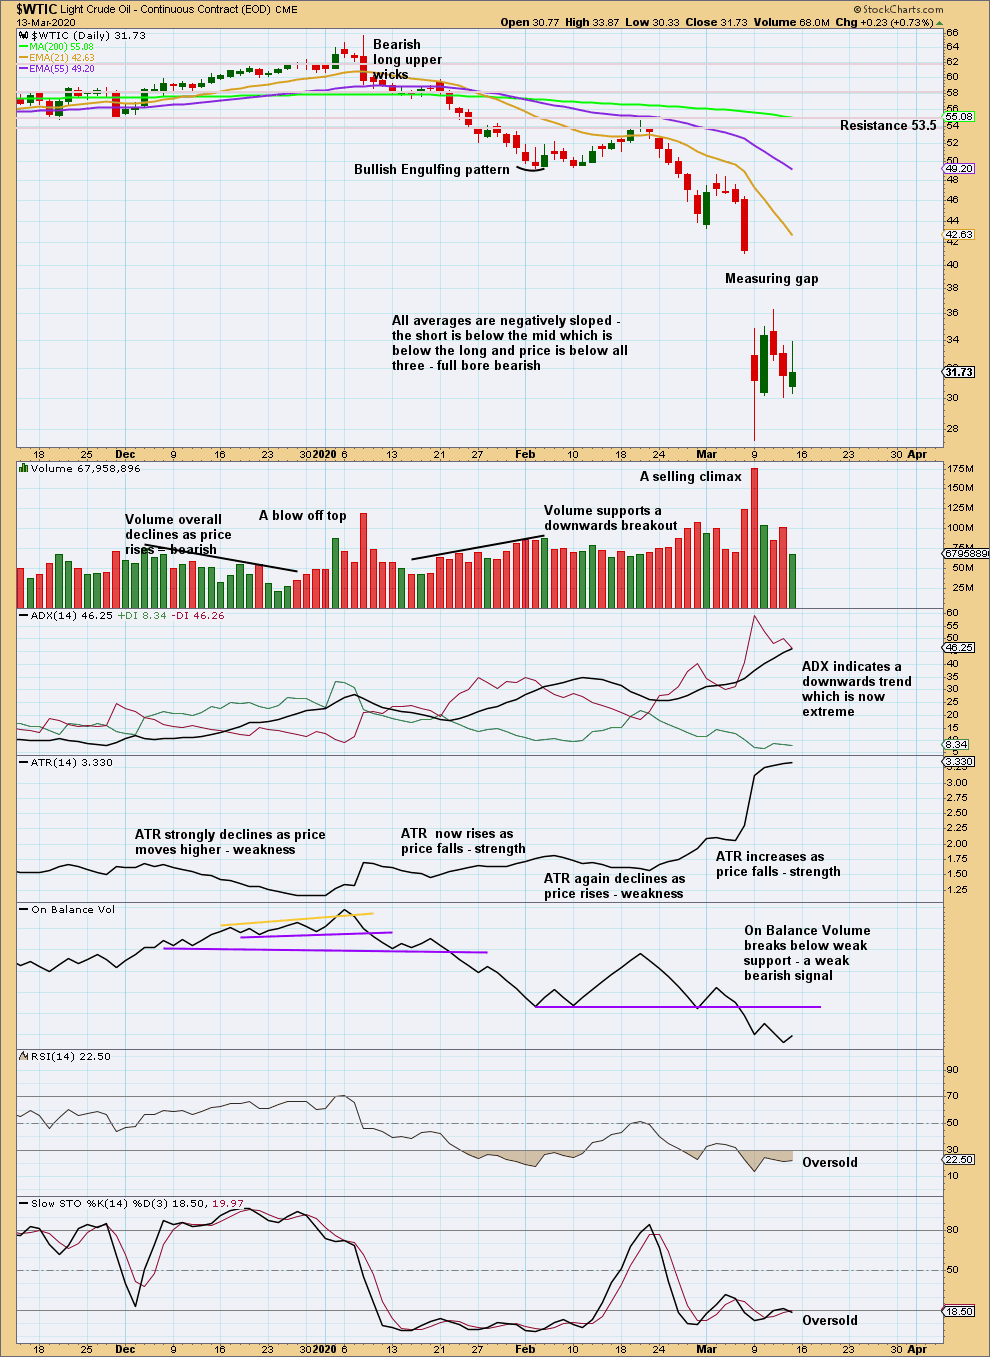
Click chart to enlarge. Chart courtesy of StockCharts.com.
A downwards trend is now in place at both daily and weekly time frames. Both volume and range support this trend.
RSI and Stochastics may remain very extreme for reasonable periods of time when this market trends. ADX may also remain very extreme for reasonable periods of time.
At the daily chart level, the calculation from the measuring gap gives a target at 27.27, which was almost met on the same day of the gap.
Published @ 08:23 a.m. EST on March 14, 2020.
—
Careful risk management protects your trading account(s).
Follow my two Golden Rules:
1. Always trade with stops.
2. Risk only 1-5% of equity on any one trade.
—
New updates to this analysis are in bold.
lets try uploading that chart again…
Lara, I agree with your count, but I have a different viewpoint on the target. I think the very large falling wedge will play out with support at the trend line around 22.5ish. Looks like a great place to go long.
https://www.tradingview.com/x/qSfDYZtV/
Possibly. That lower trend line is long but it has only two anchor points / tests so it’s not hugely technically significant. It would certainly be about where I’d expect a bounce though, at least.
That trend line is now breached by a close below it, quite forcefully too.