
GOLD: Elliott Wave and Technical Analysis | Charts – April 9, 2020
Upwards movement remains below the short-term invalidation point on the main Elliott wave count. Alternates are provided.
Summary: The bounce is expected to be over here or very soon.
If price makes a new high above 1,701.61, then a target for upwards movement to end would be at 1,780 or 1,795.
Grand SuperCycle analysis is here.
Monthly charts were last updated here.
MAIN BEARISH ELLIOTT WAVE COUNT
WEEKLY CHART
Click chart to enlarge.
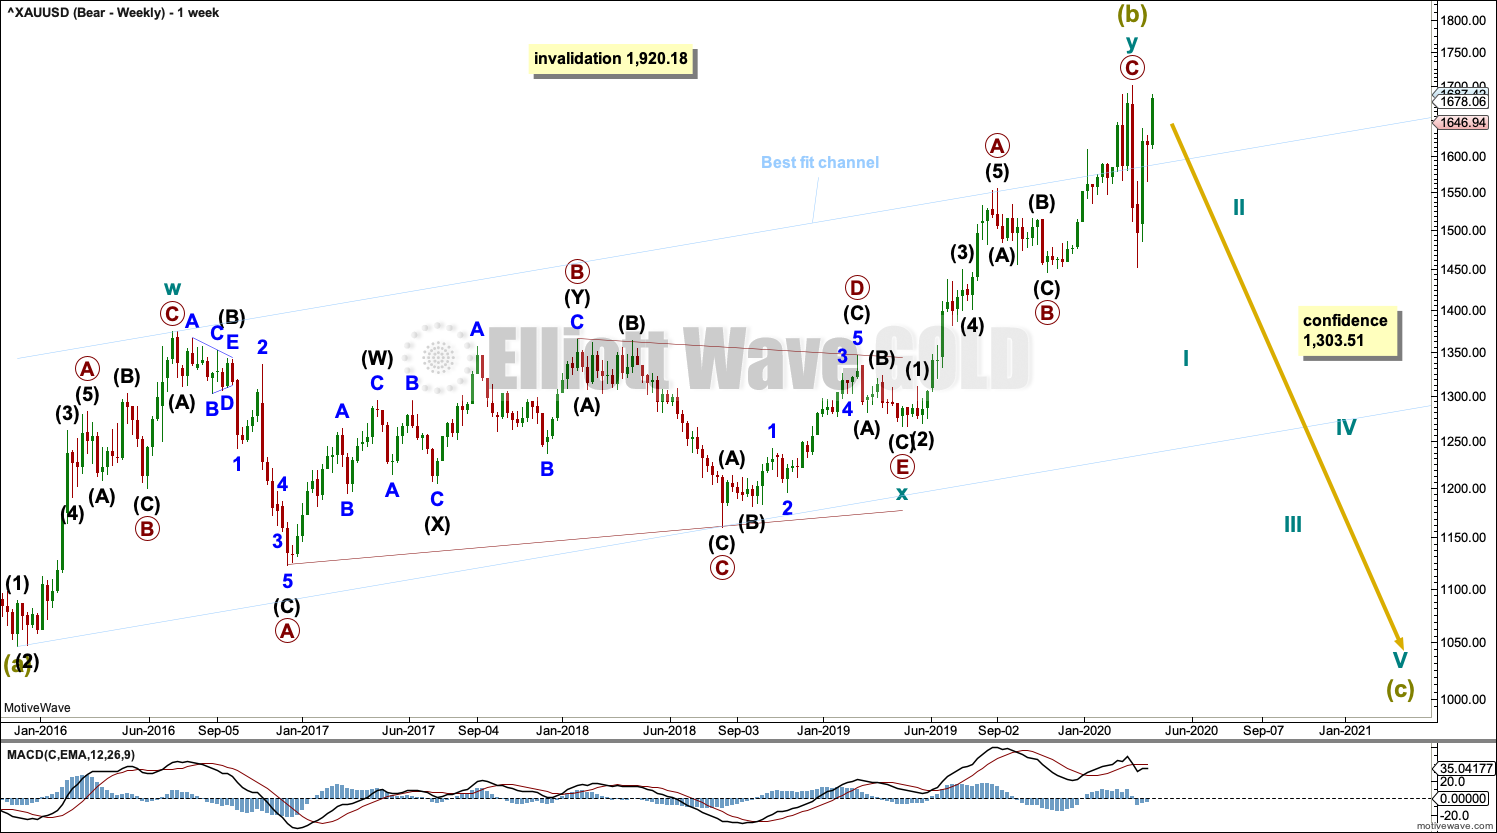
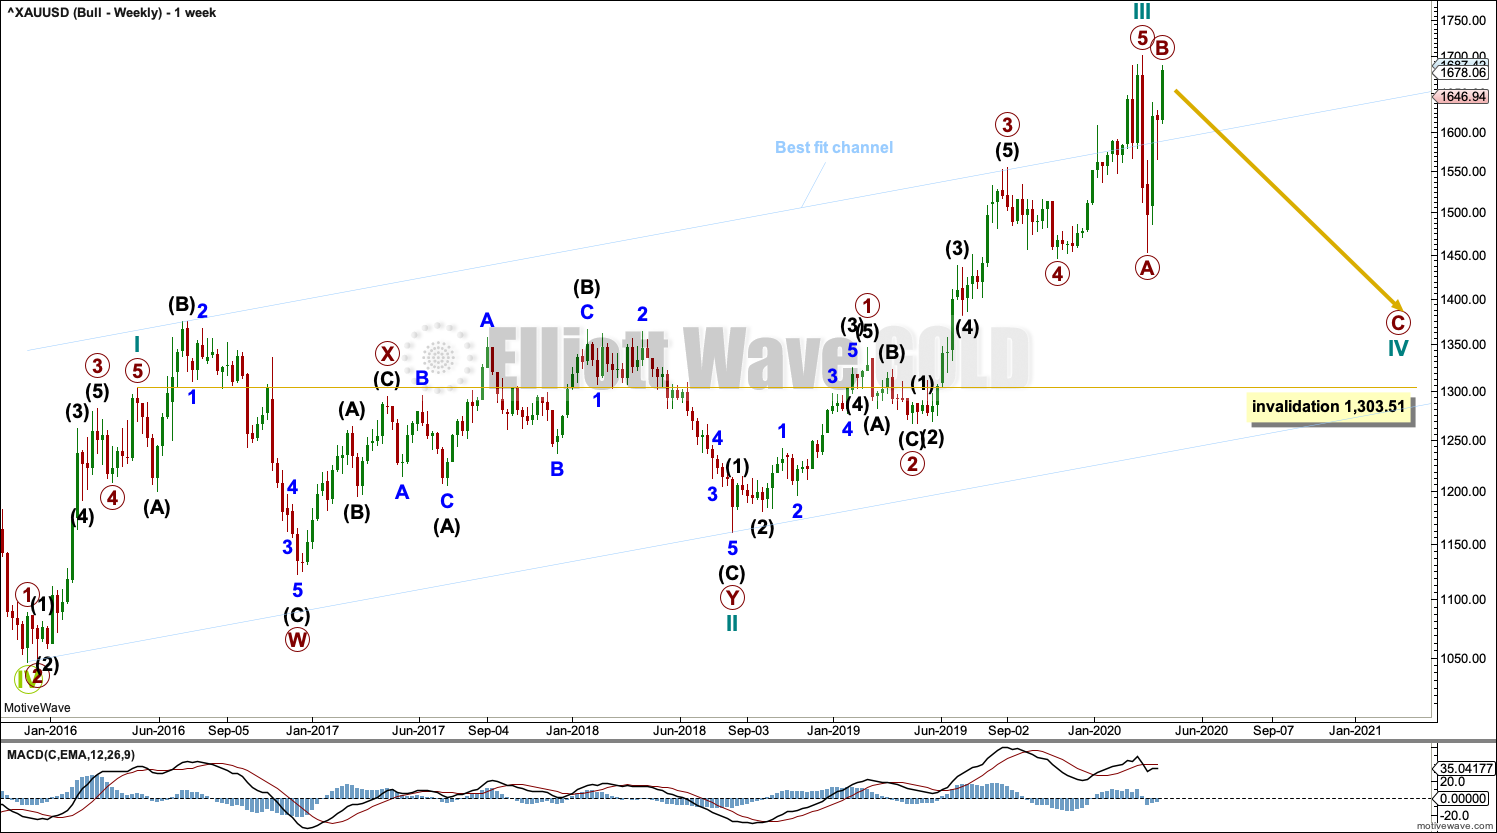
Super Cycle wave (b) may be a complete double zigzag.
The first zigzag in the double is labelled cycle wave w. The double is joined by a three in the opposite direction, a triangle labelled cycle wave x. The second zigzag in the double is labelled cycle wave y.
The purpose of the second zigzag in a double is to deepen the correction. Cycle wave y has achieved this purpose.
A wide best fit channel is added in light blue. Copy this channel over to daily charts.
DAILY CHART
Click chart to enlarge.
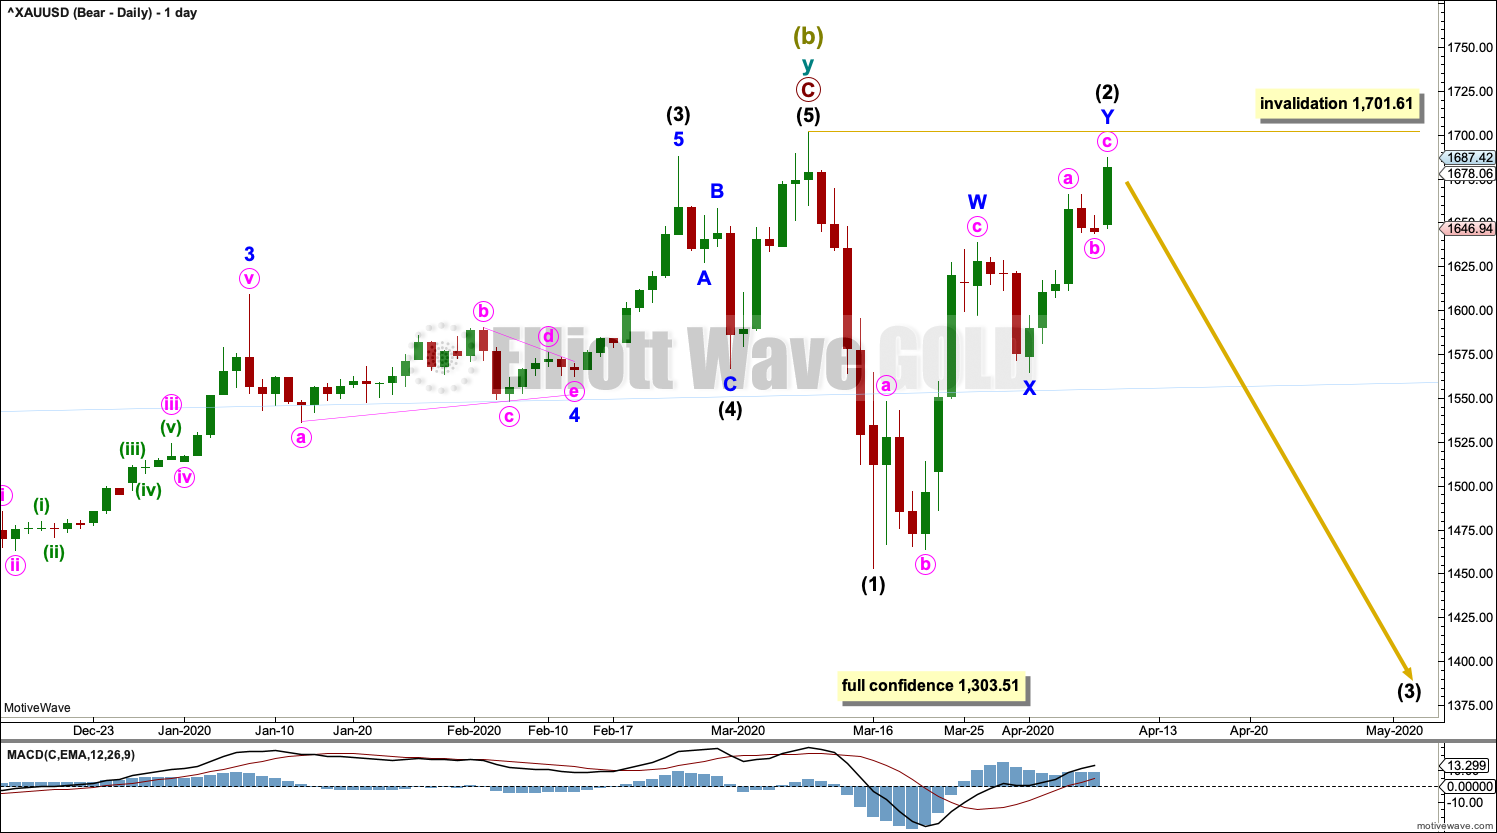
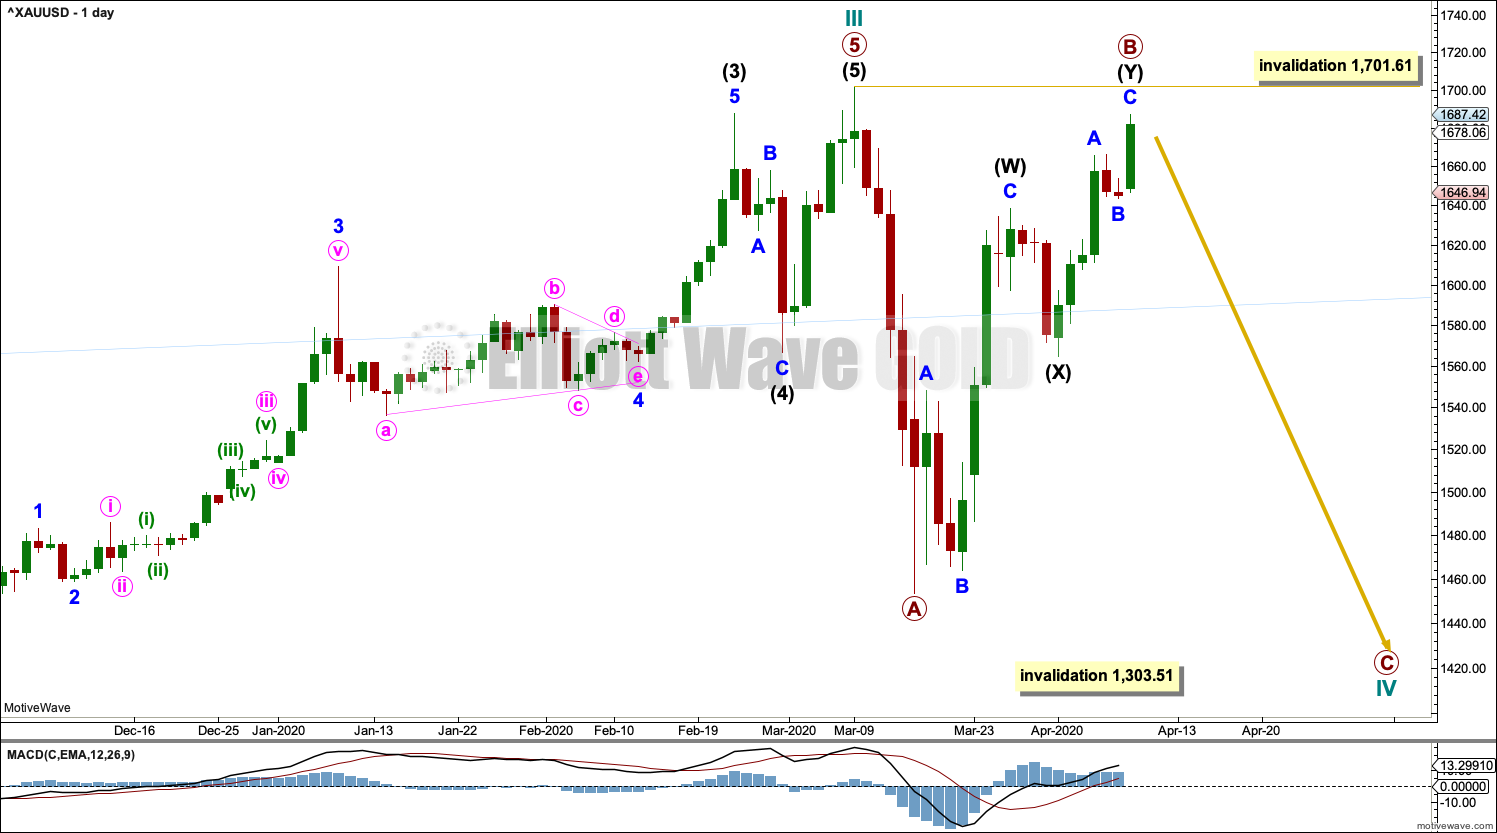
Super Cycle wave (b) may be complete.
The second zigzag in the double, labelled cycle wave y, may be complete. There is no Fibonacci ratio between primary waves A and C.
Within Super Cycle wave (c): intermediate waves (1) and now (2) may be complete. Intermediate wave (2) may have continued higher this week as a double zigzag. If intermediate wave (2) continues higher, then it may not move beyond the start of intermediate wave (1) above 1,701.61.
HOURLY CHART
Click chart to enlarge.
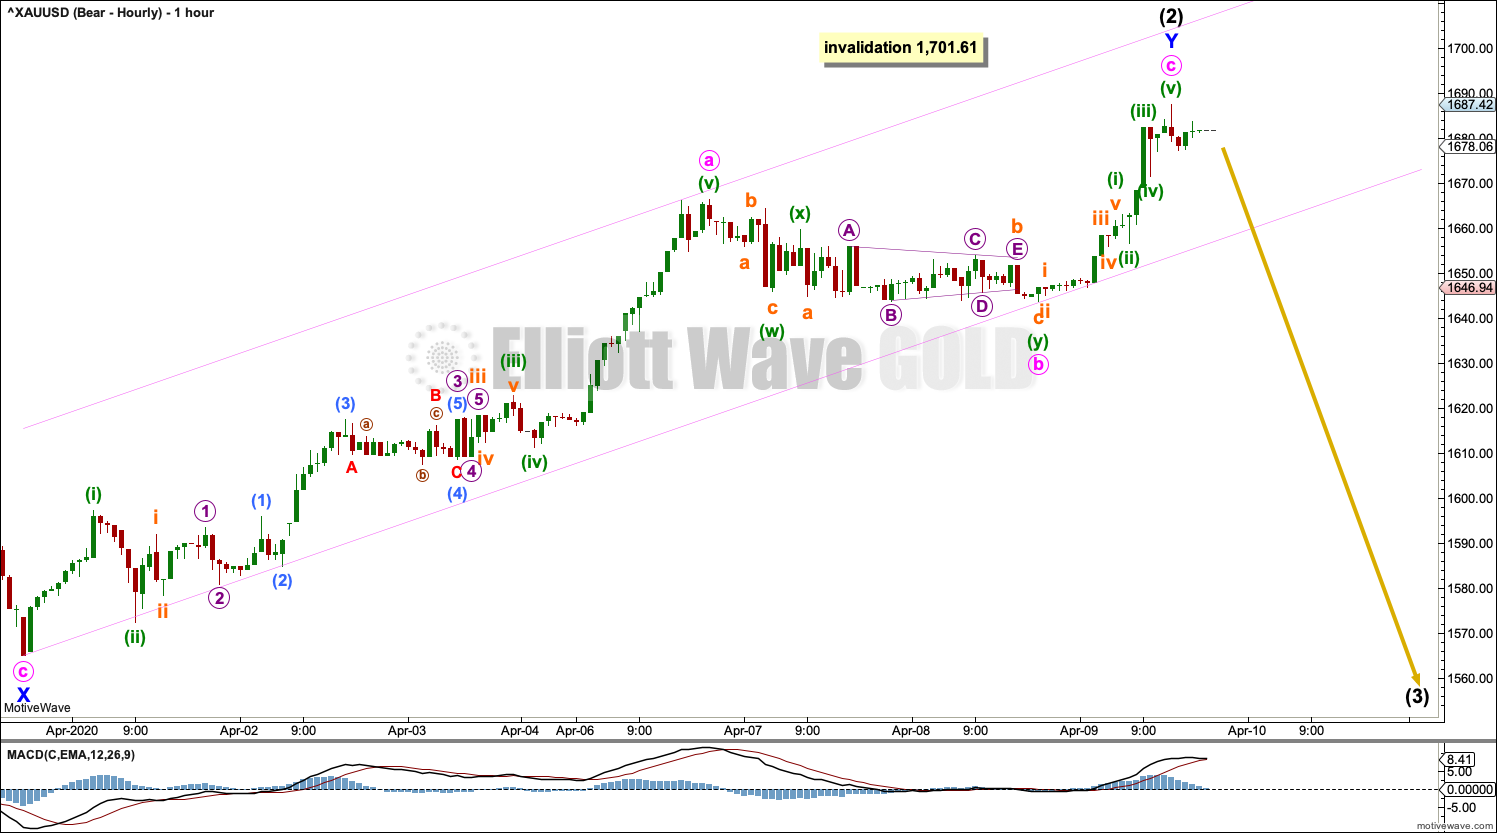
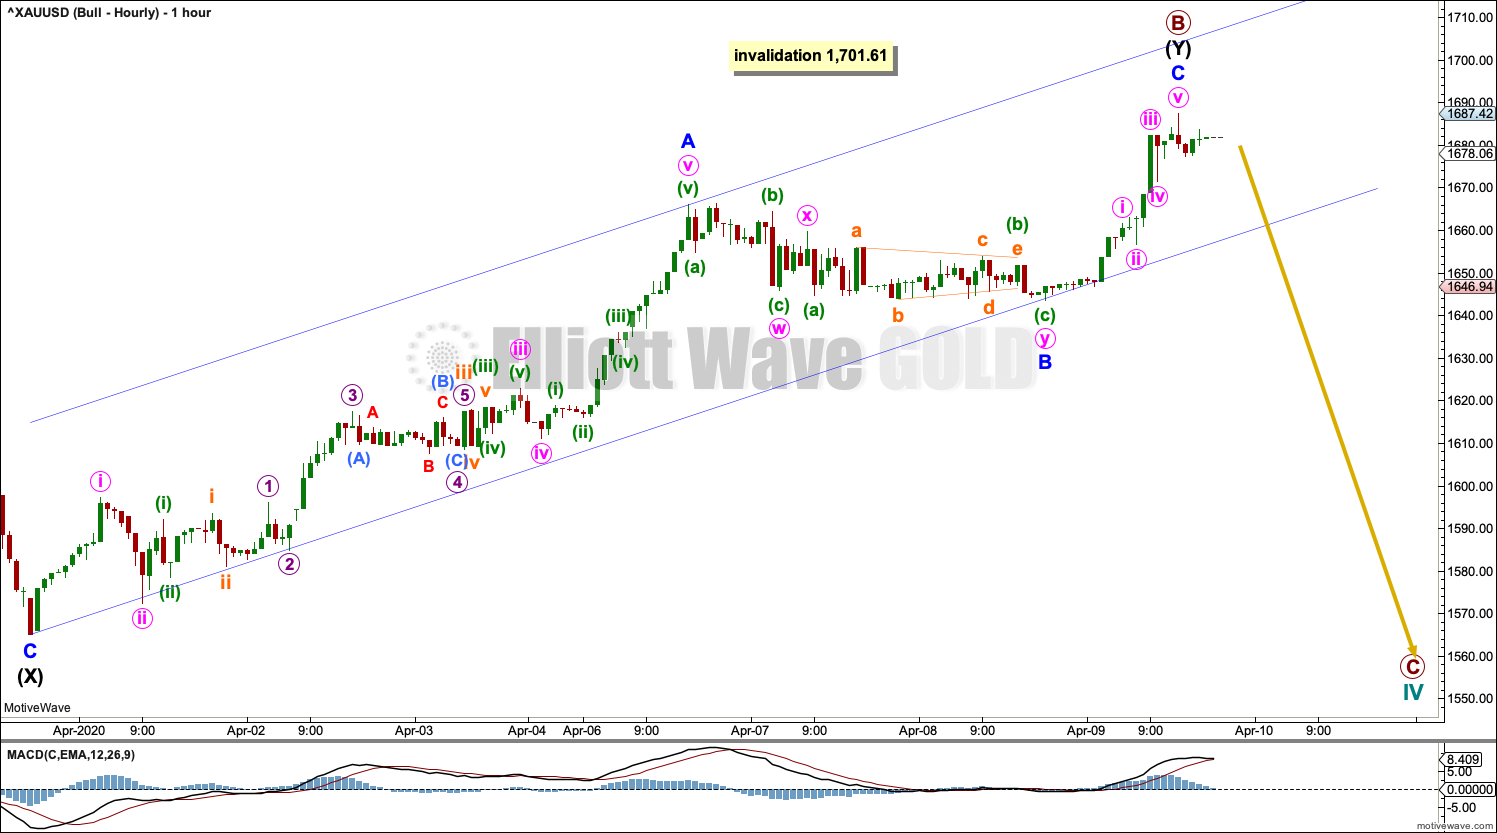
Intermediate wave (2) may again be a complete double zigzag. The second zigzag in the double labelled minor wave Y may be complete. This zigzag now has a more obvious three wave look at hourly and daily time frames.
A channel is drawn about minor wave Y. The lower edge of this channel needs to be breached for confidence that a high is in place. The channel is drawn using Elliott’s technique for a correction. The channel has not yet been breached. It must be accepted that intermediate wave (2) may continue higher while price remains within this channel. The invalidation point must remain the same.
ALTERNATE DAILY CHART
Click chart to enlarge.
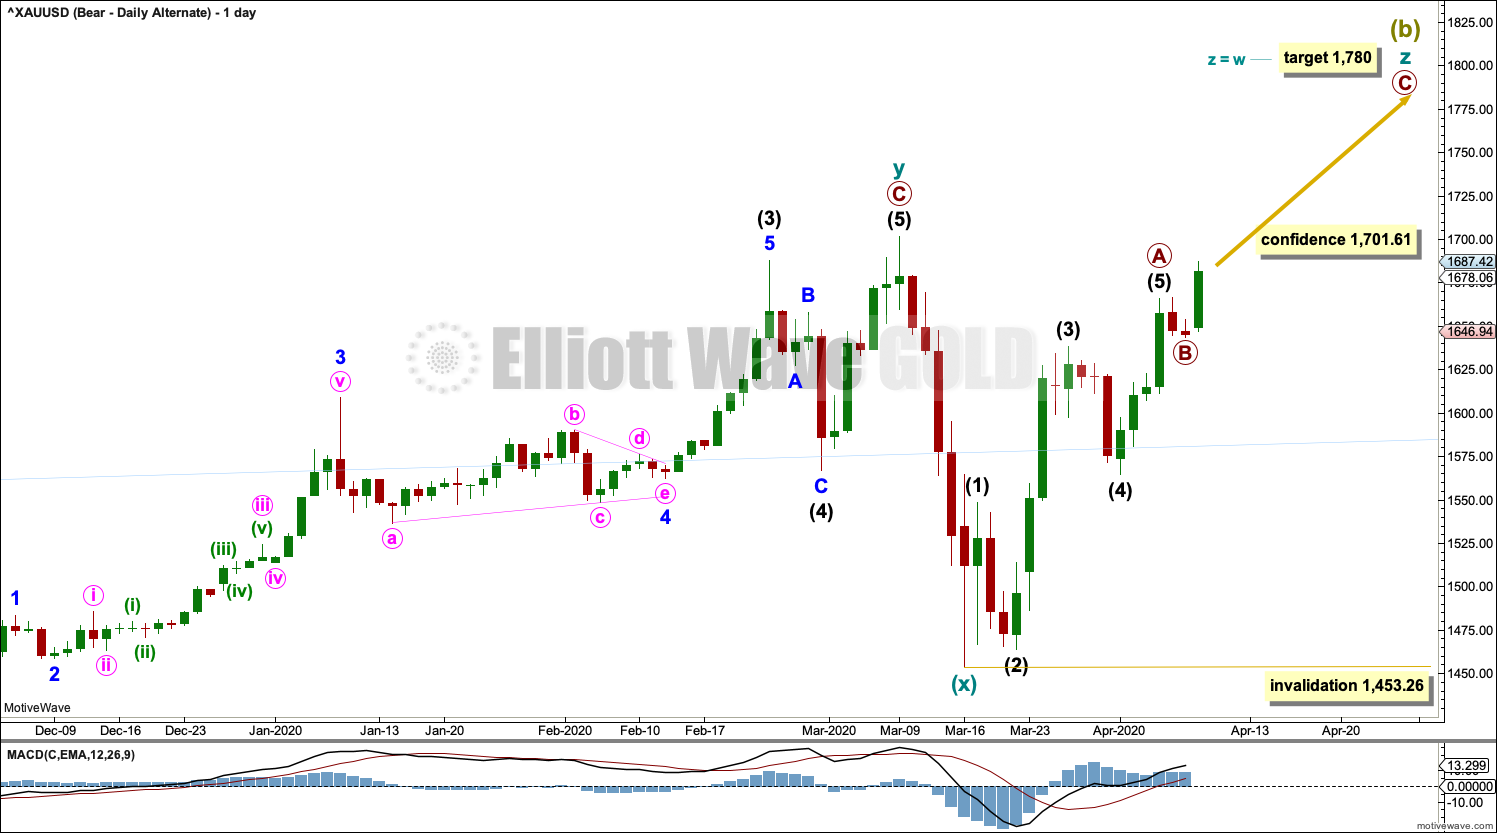
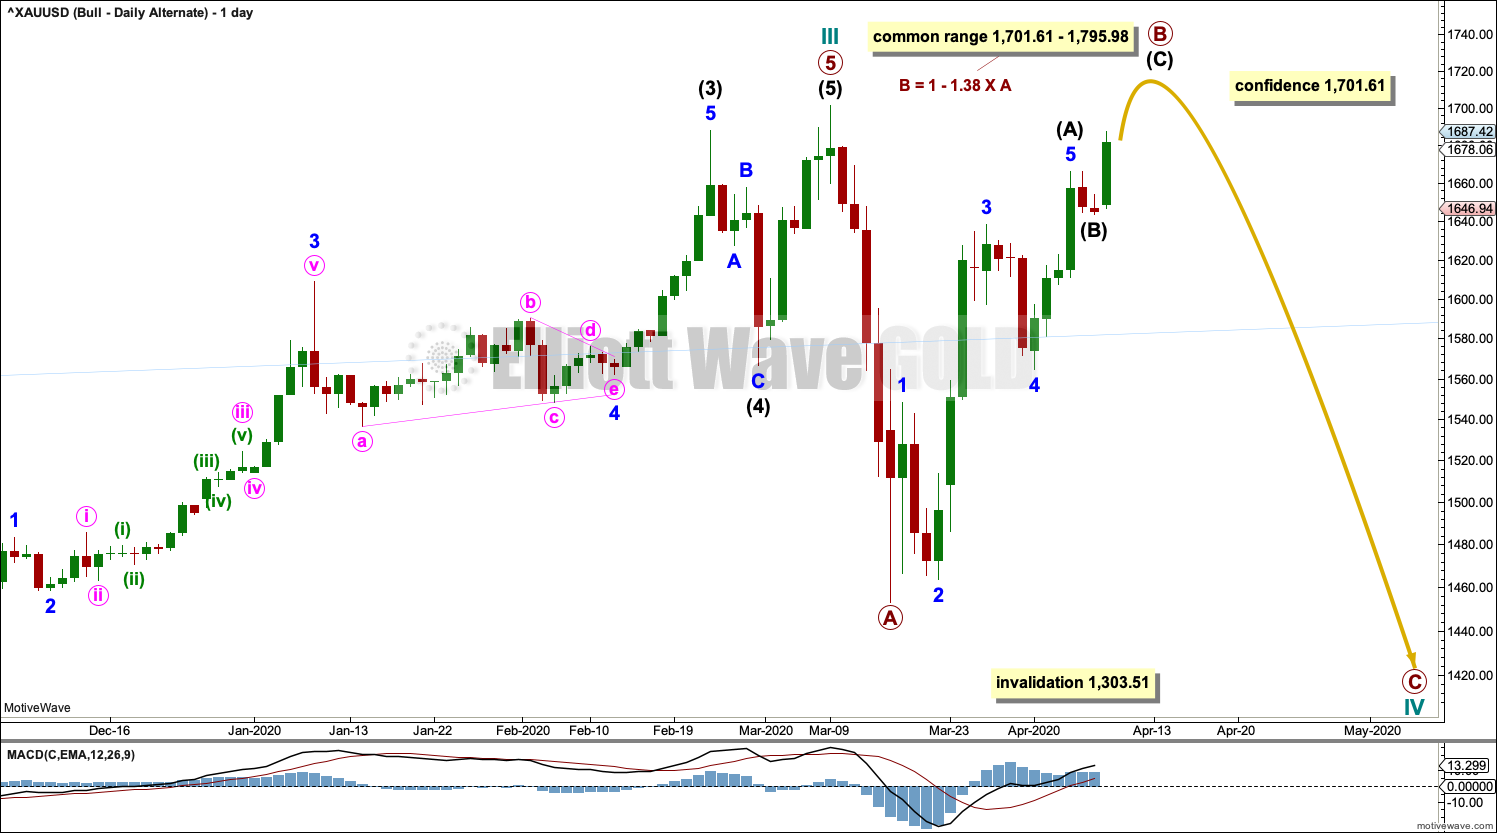
If the main wave count is invalidated by a new high above 1,701.61 on Barchart data, then this alternate may then be used.
It is possible that Super Cycle wave (b) may continue higher as a triple zigzag. However, triple zigzags are reasonably rare structures. The rarity of this structure means that this wave count has a low probability, but low probability does not mean no probability.
Cycle wave z for this wave count must subdivide as a zigzag. Within the zigzag: primary wave A may be a completed five wave impulse and primary wave B may not move beyond the start of primary wave A below 1,453.26.
ALTERNATE BULLISH ELLIOTT WAVE COUNT
WEEKLY CHART
Click chart to enlarge.
This wave count sees the the bear market complete at the last major low for Gold on 3 December 2015.
If Gold is in a new bull market, then it should begin with a five wave structure upwards on the weekly chart.
Cycle wave I fits as a five wave impulse with reasonably proportionate corrections for primary waves 2 and 4. This resolves a previous major problem with the bullish wave count.
Cycle wave II now fits as a double flat. However, a problem arises with the relabelling of this structure. Within the first flat correction labelled primary wave W, this wave count now needs to ignore what looks like an obvious triangle from July to September 2016 (this can be seen labelled as a triangle on the bear wave count above). This movement must now be labelled as a series of overlapping first and second waves.
Within the first flat correction labelled primary wave W of the double flat of cycle wave II, intermediate wave (B) is 1.69 the length of intermediate wave (A). This is longer than the common range of up to 1.38, but within an allowable guideline of up to 2. The length of intermediate wave (B) reduces the probability of this wave count.
Cycle wave III may be complete. Cycle wave IV may not move into cycle wave I price territory below 1,303.51.
DAILY CHART
Click chart to enlarge.
Cycle wave III may be complete. Cycle wave IV may not move into cycle wave I price territory below 1,303.51.
Cycle wave II was relatively deep at 0.55 of cycle wave I. If cycle wave IV exhibits alternation in depth, it may more likely be shallow; the first target at 0.382 of cycle wave III would be preferred.
Cycle wave II was a very long lasting double combination. It lasted 119 weeks. Cycle wave IV may most likely be a zigzag, which tend to be quicker structures, but it would still be expected to last several months.
Within the zigzag of cycle wave IV: primary wave B may not move beyond the start of primary wave A above 1,701.61. A new high above this point would indicate cycle wave IV may not be a zigzag; it may then be relabelled as a flat, combination or triangle.
HOURLY CHART
Click chart to enlarge.
Both hourly charts are essentially the same at this time.
ALTERNATE DAILY CHART
Click chart to enlarge.
It is also possible that cycle wave IV may subdivide as a flat correction, triangle or combination. Both a flat and triangle would still provide structural alternation with the combination of cycle wave II.
If cycle wave IV subdivides as a flat correction, then within it primary wave B may make a new high above the start of primary wave A at 1,701.61. The common range for primary wave B within a flat would be from 1 to 1.38 times the length of primary wave A.
If cycle wave IV subdivides as a triangle, then within it primary wave B may make a new high above the start of primary wave A as in a running triangle.
There is no upper invalidation point for this wave count.
TECHNICAL ANALYSIS
WEEKLY CHART
Click chart to enlarge. Chart courtesy of StockCharts.com.
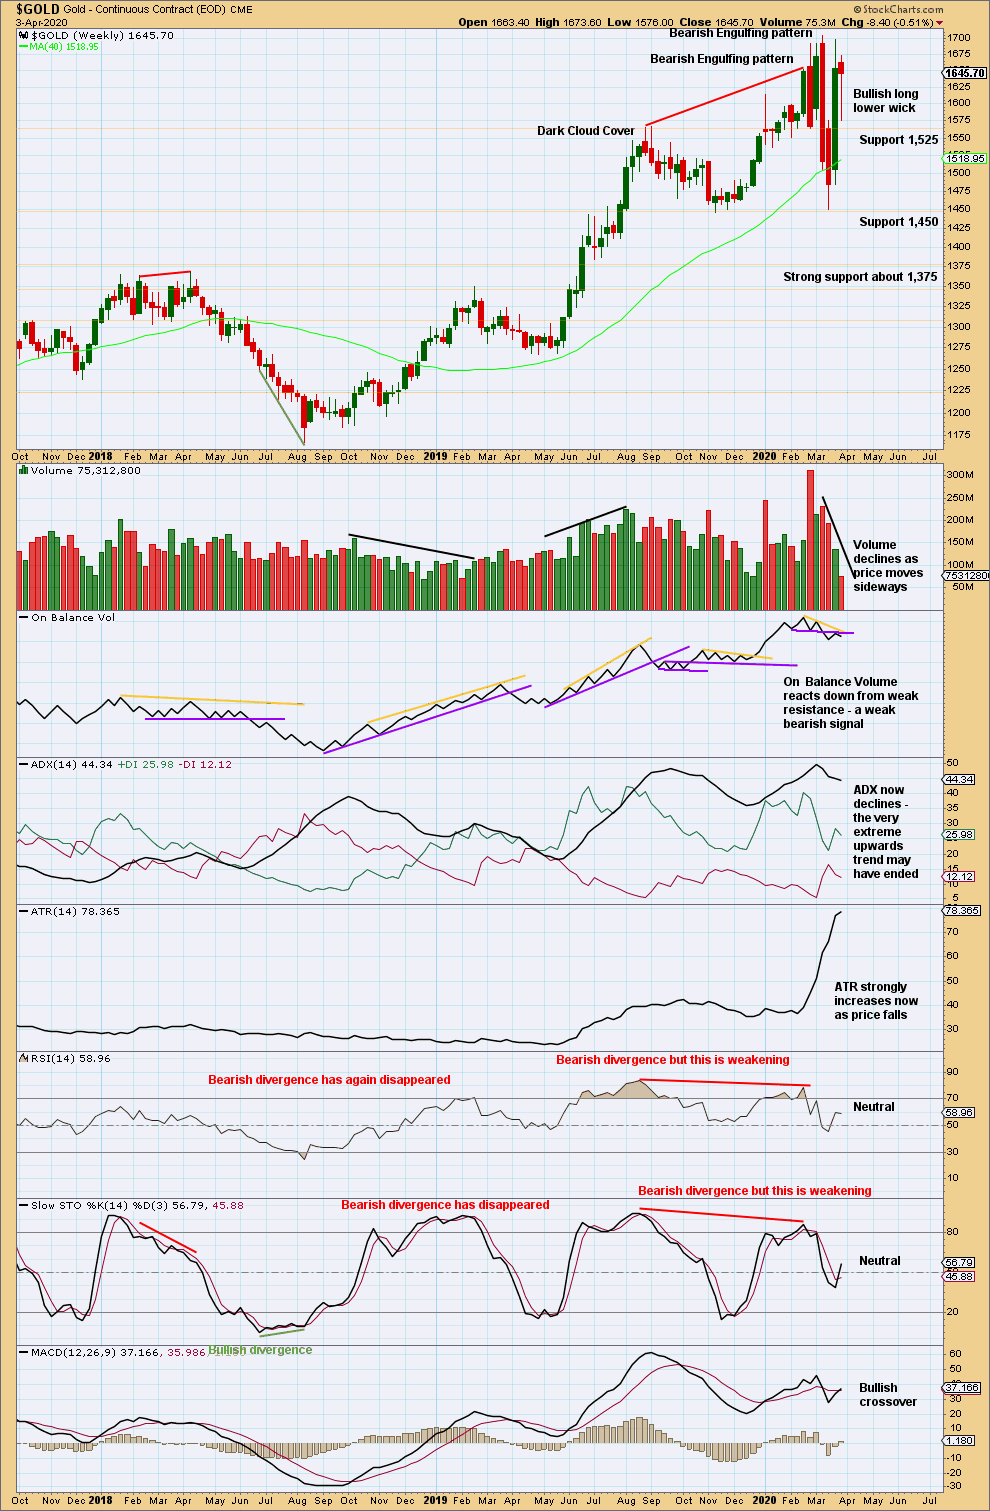
The last Bearish Engulfing pattern is extreme. The pattern fully engulfs the prior nine weekly candlesticks, and it has some support from volume. This strongly indicates a trend change after the upwards trend reached very extreme and conditions reached overbought and exhibited bearish divergence.
Price does not move in straight lines. Look out for bounces and consolidations on the way down. The first major bounce within a new trend for Gold is often very deep.
Last week completes an inside week with a red candlestick. Downwards movement within the week lacks support from volume.
DAILY CHART
Click chart to enlarge. Chart courtesy of StockCharts.com.
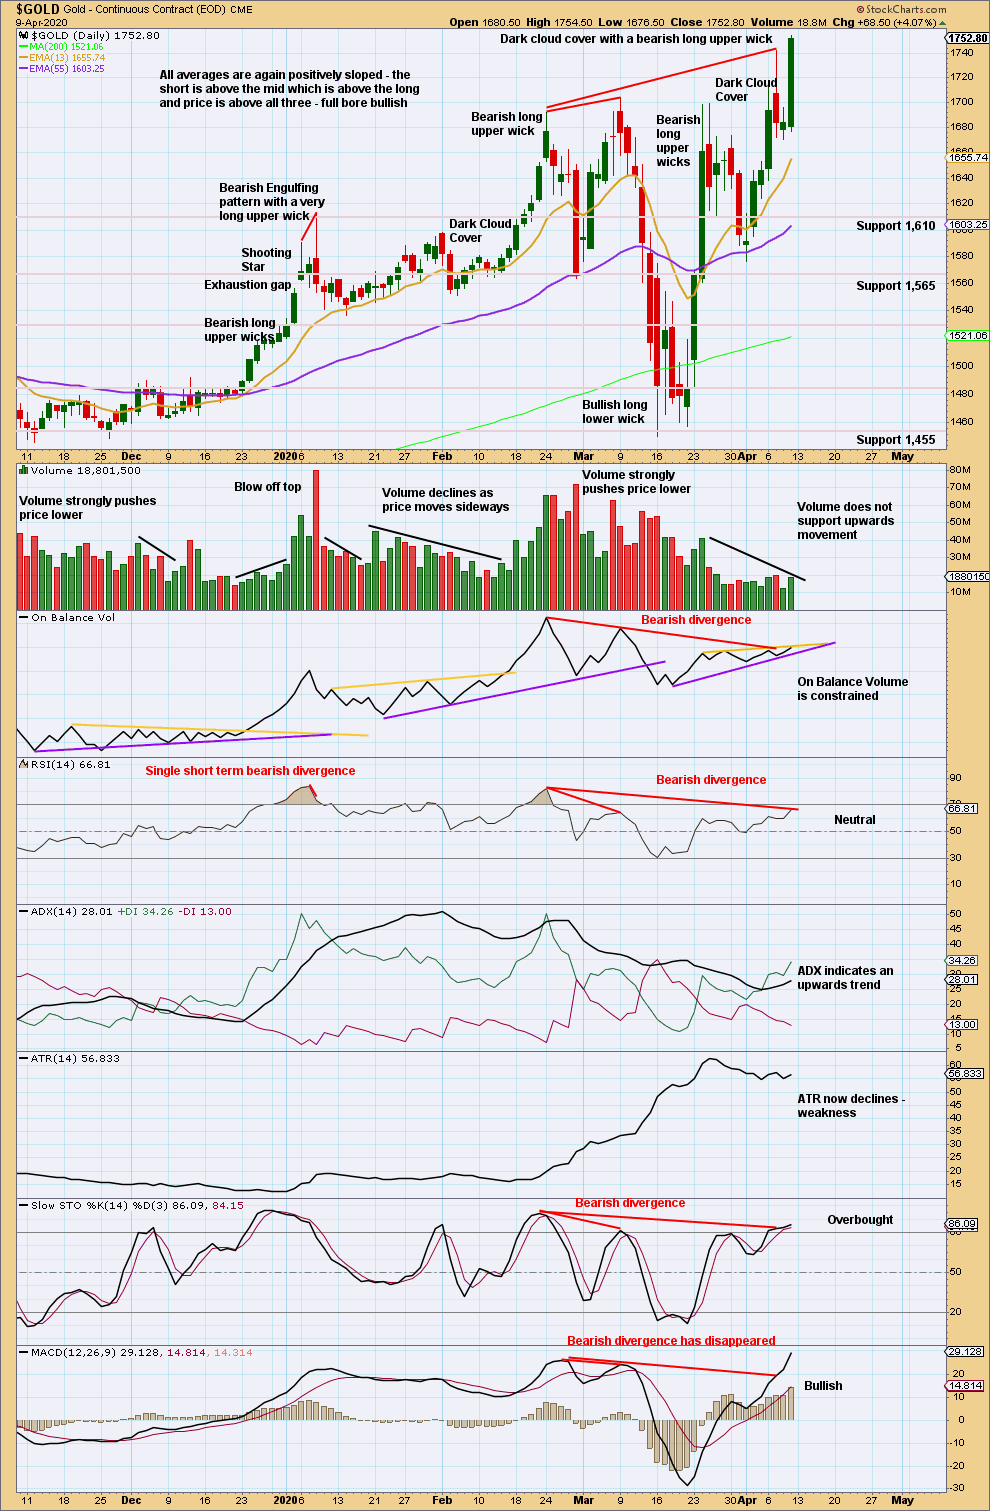
Overall, volume remains very light and does not support this upwards movement.
Bearish divergence between price and all of On Balance Volume, RSI, and Stochastics remains. Bearish divergence between price and MACD has now disappeared.
The resistance line on On Balance Volume is adjusted for better technical significance.
From time to time there are differences between StockCharts and Barchart data. Gold is a truly global market; there is no one data feed that incorporates all global data points. Different feeds will have differences because they incorporate different geographic data points. The technical analysis relies upon Stockcharts data, while the Elliott wave analysis relies upon Barchart data. As long as the Elliott wave analysis is consistent in using the same data feed each day and each week, then it will be valid for that data feed.
GDX WEEKLY CHART
Click chart to enlarge. Chart courtesy of StockCharts.com.
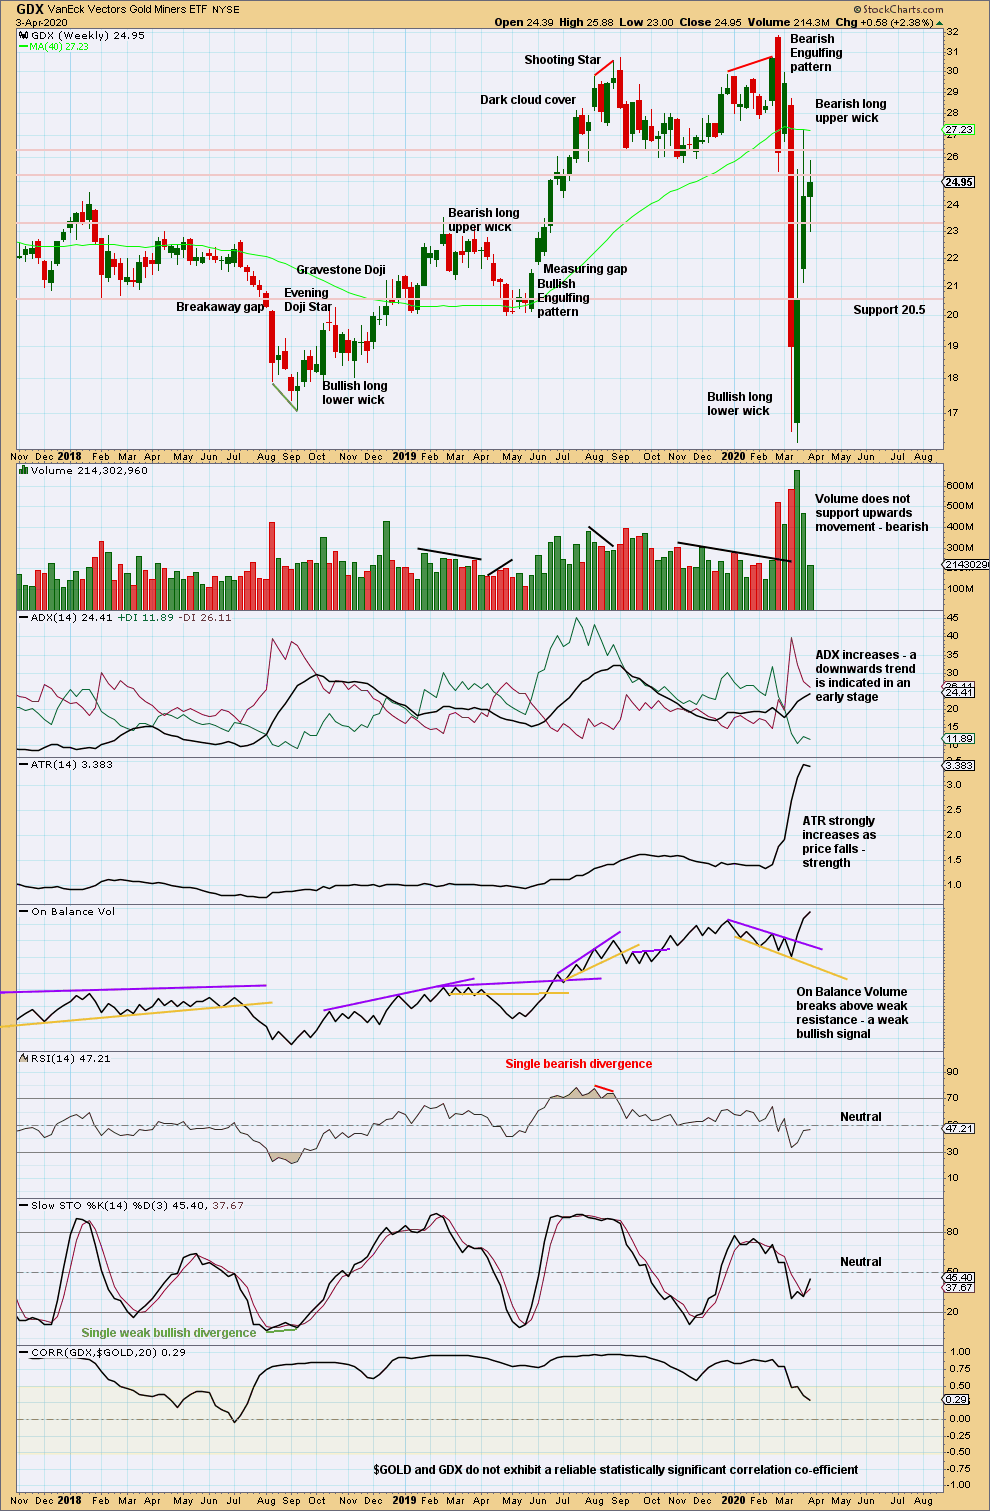
There is support below in a zone about 16.75 to 15.85. Price has bounced up strongly again within this zone.
Further weakness in volume for another green weekly candlestick suggests upwards movement may be over here or very soon.
GDX DAILY CHART
Click chart to enlarge. Chart courtesy of StockCharts.com.
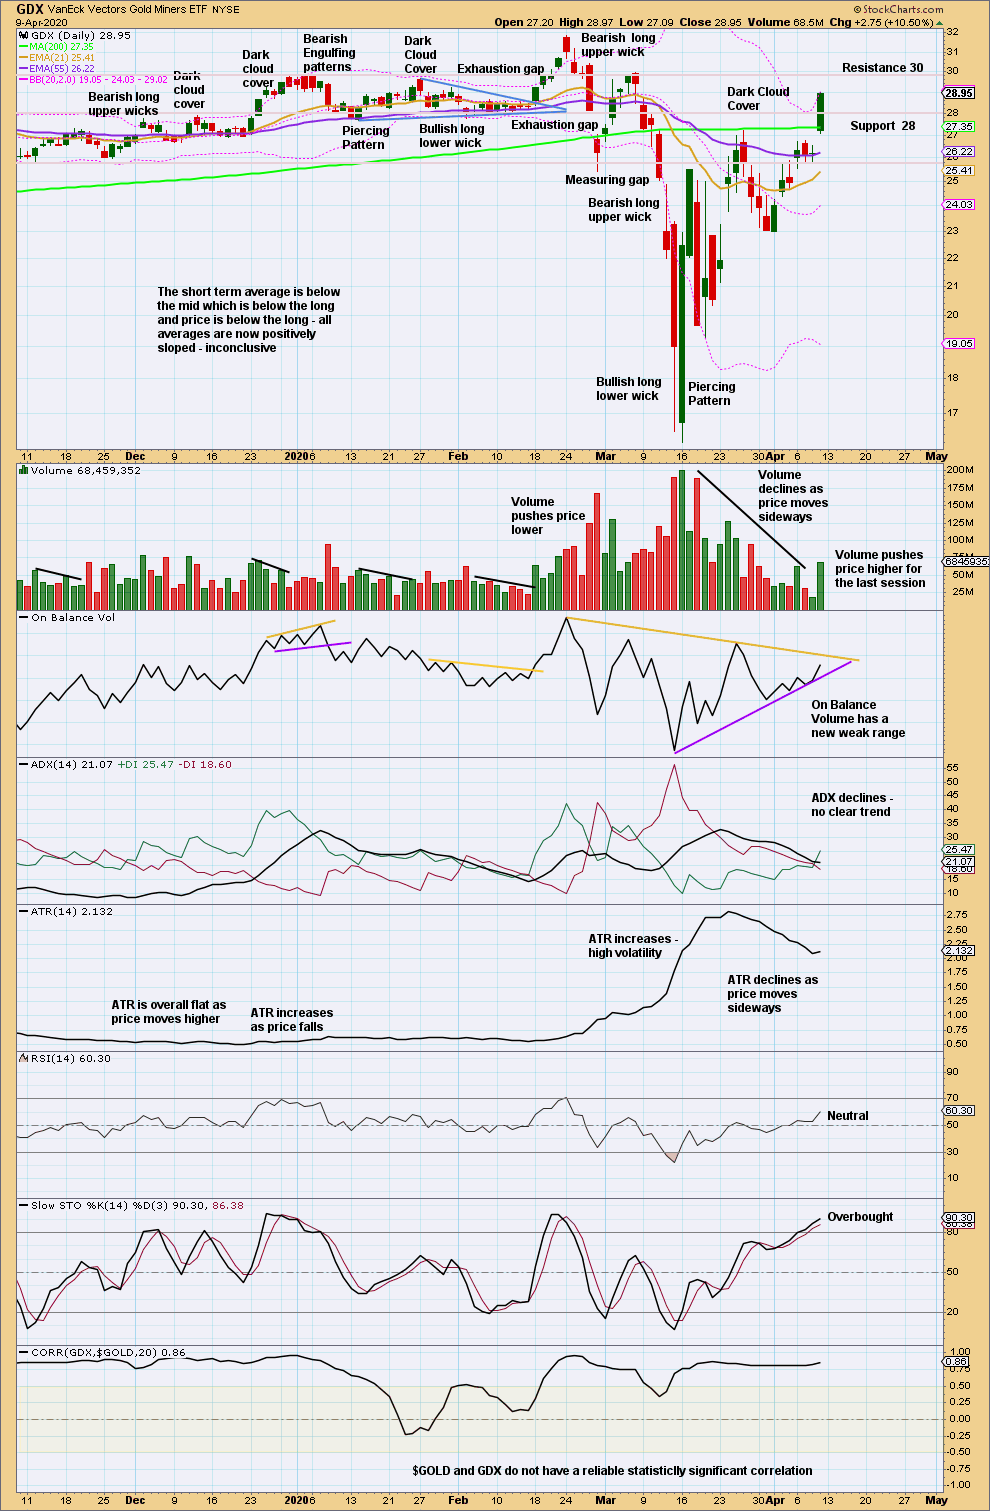
An upwards breakout from a small consolidation was effected today with support from volume. A target calculated from the width of the consolidation zone is at 31.21.
Published @ 09:45 p.m. EST.
—
Careful risk management protects your trading account(s).
Follow my two Golden Rules:
1. Always trade with stops.
2. Risk only 1-5% of equity on any one trade.
—
New updates to this analysis are in bold.