
GOLD: Elliott Wave and Technical Analysis | Charts – April 13, 2020
A new high indicated more upwards movement. The main Elliott wave count was invalidated and alternates confirmed. Price continued higher towards targets.
Summary: A target for upwards movement to end is now at 1,780 or 1,795.
Grand SuperCycle analysis is here.
Monthly charts were last updated here.
MAIN BEARISH ELLIOTT WAVE COUNT
WEEKLY CHART
Click chart to enlarge.
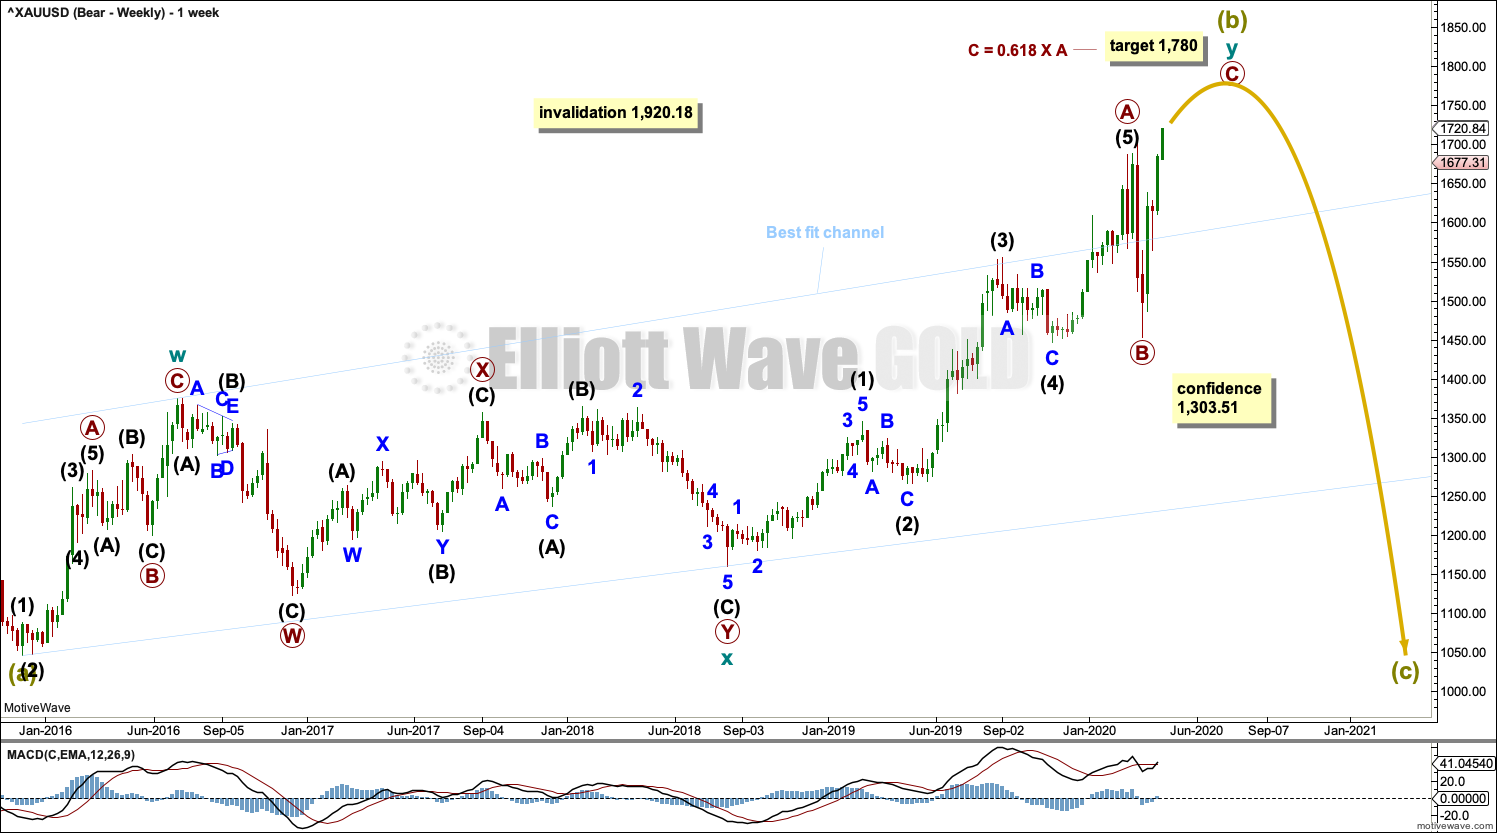
Super Cycle wave (b) may be an incomplete double zigzag.
The first zigzag in the double is labelled cycle wave w. The double is joined by a three in the opposite direction, a combination labelled cycle wave x. The second zigzag in the double is labelled cycle wave y.
With cycle wave x ending earlier and cycle wave y beginning earlier, primary wave A within cycle wave y now looks like a five wave impulse. Primary wave B may be a complete expanded flat correction. Primary wave C may be an incomplete impulse.
The purpose of the second zigzag in a double is to deepen the correction. Cycle wave y has achieved this purpose.
A wide best fit channel is added in light blue. Copy this channel over to daily charts.
DAILY CHART
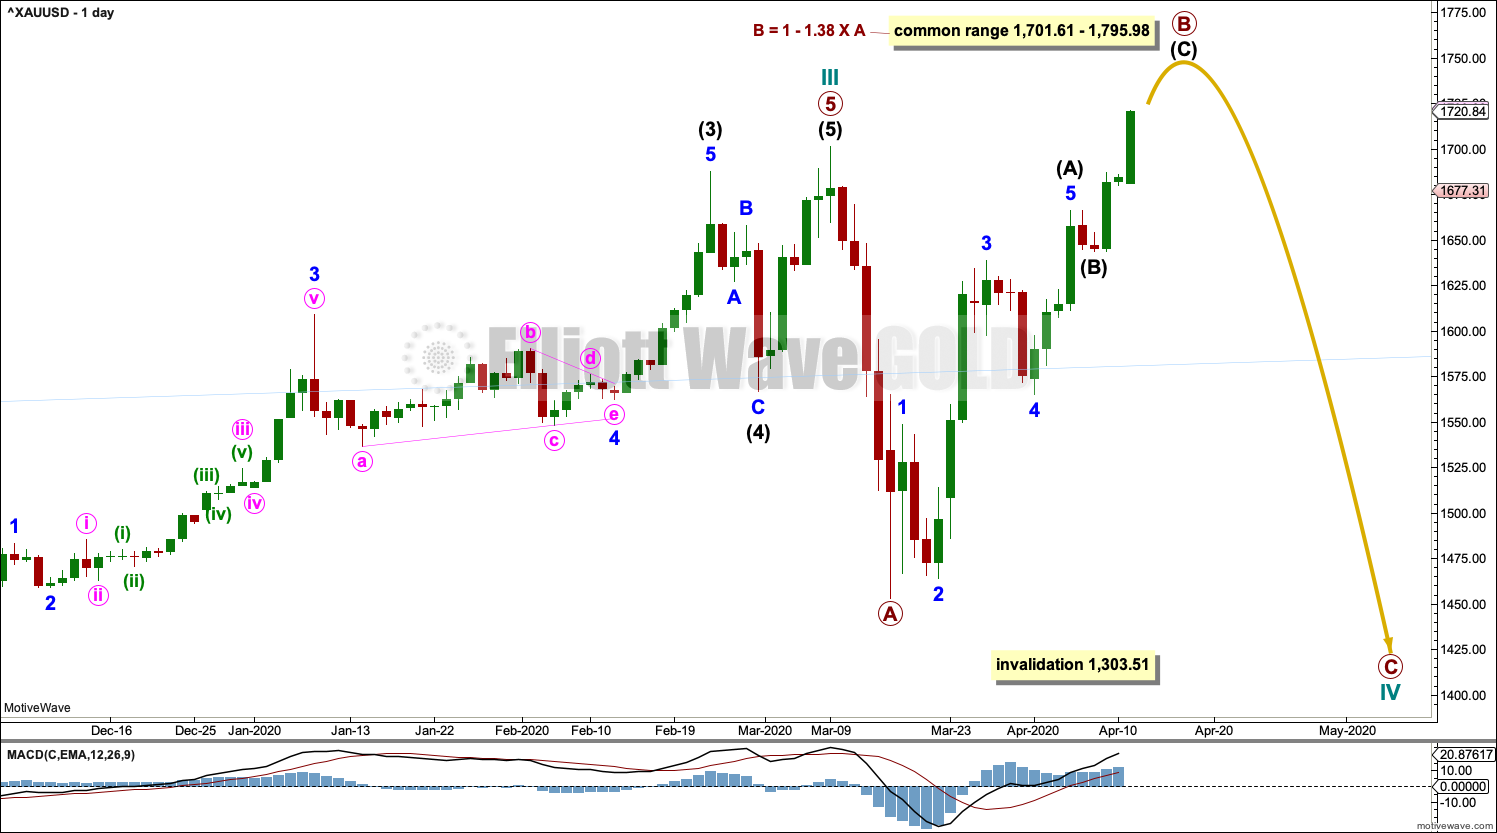
Click chart to enlarge.
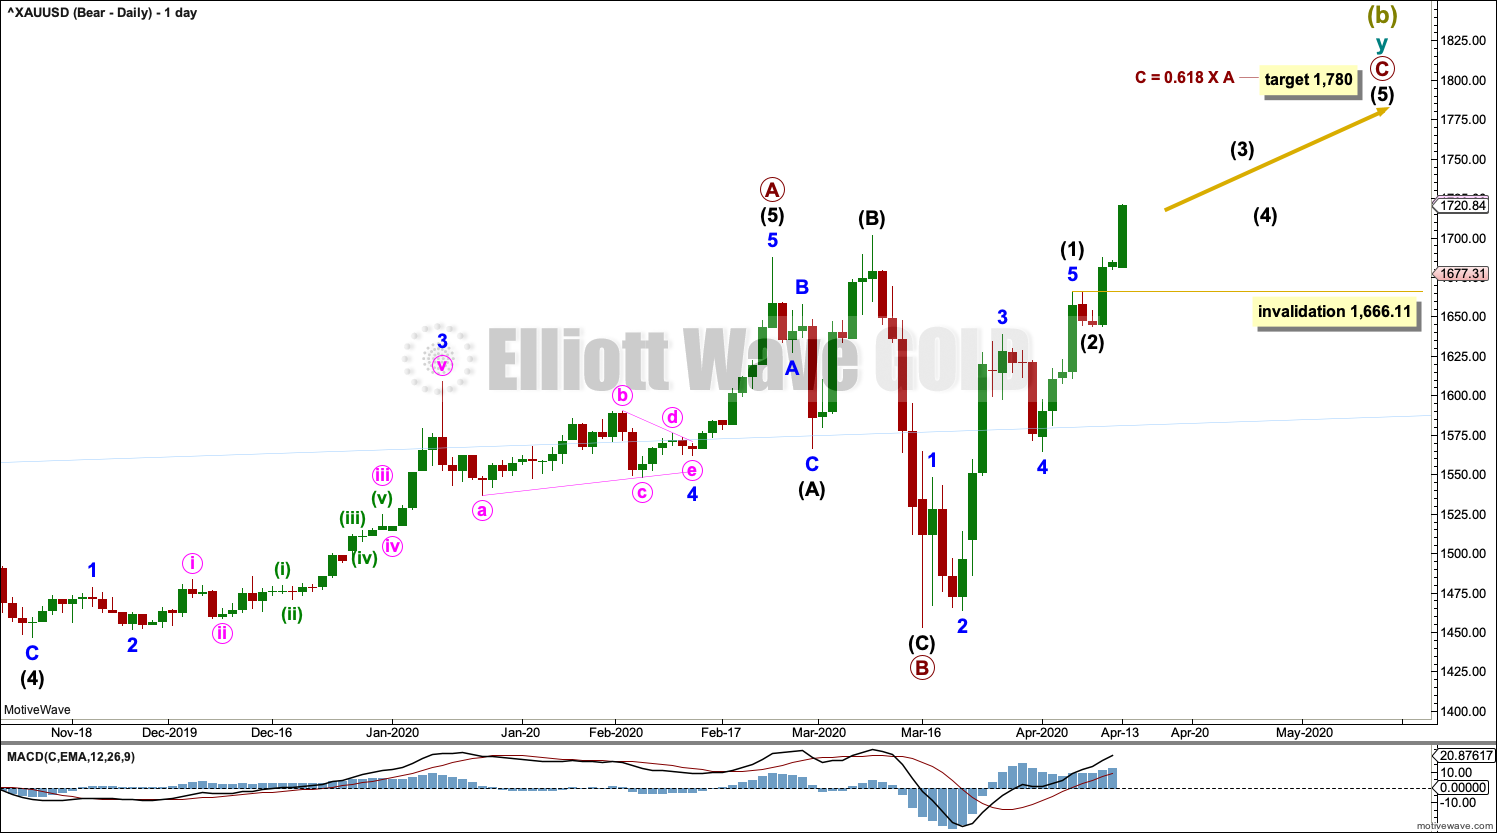
The daily chart focusses on the structure of cycle wave y.
Primary wave C may be an incomplete impulse. Within the impulse: intermediate waves (1) and (2) may be complete and intermediate wave (3) may be nearing an end.
Within primary wave C: intermediate wave (4) may not move into intermediate wave (1) price territory below 1,666.11.
HOURLY CHART
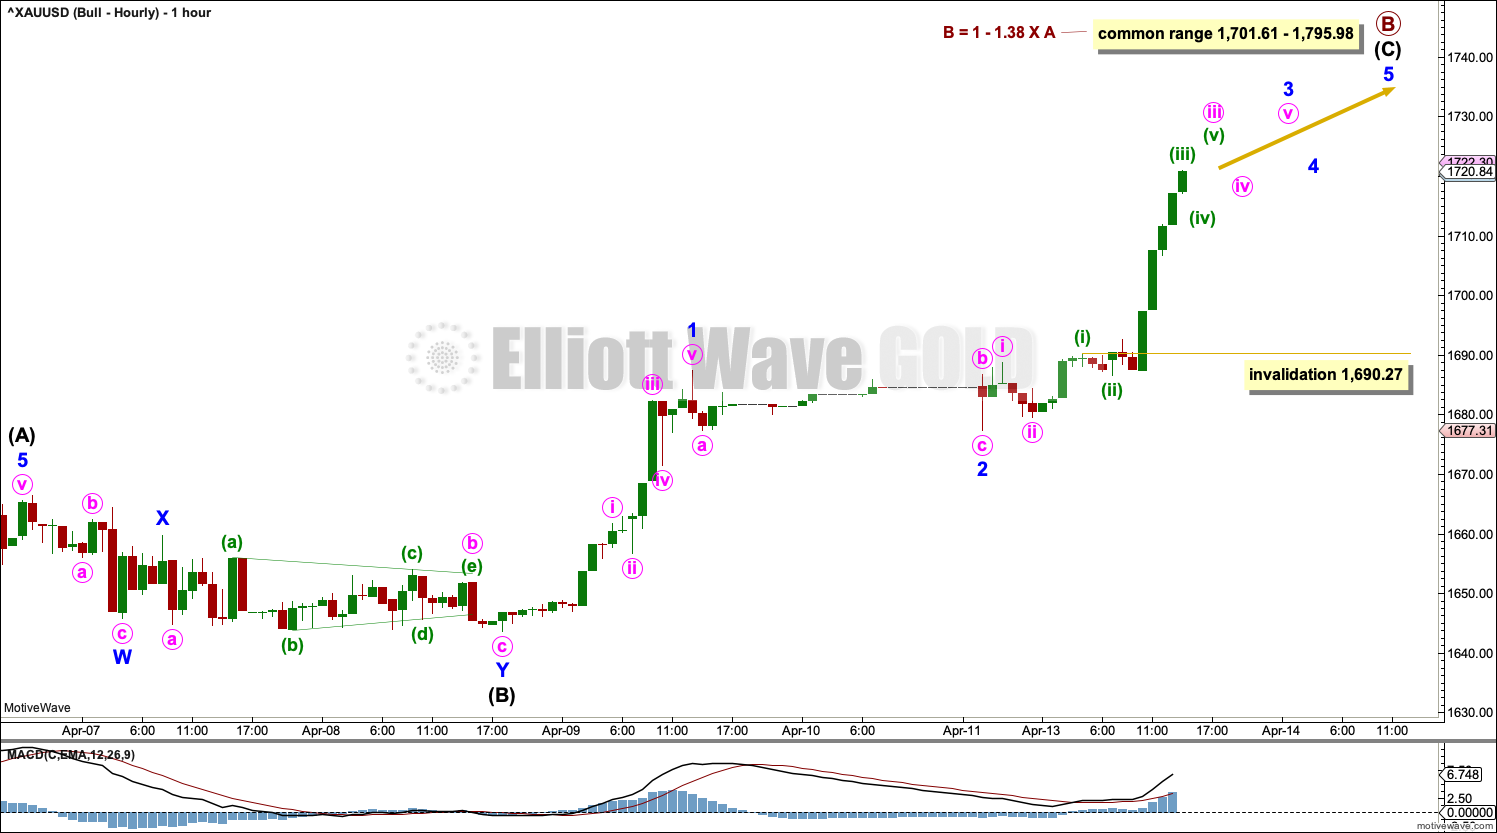
Click chart to enlarge.
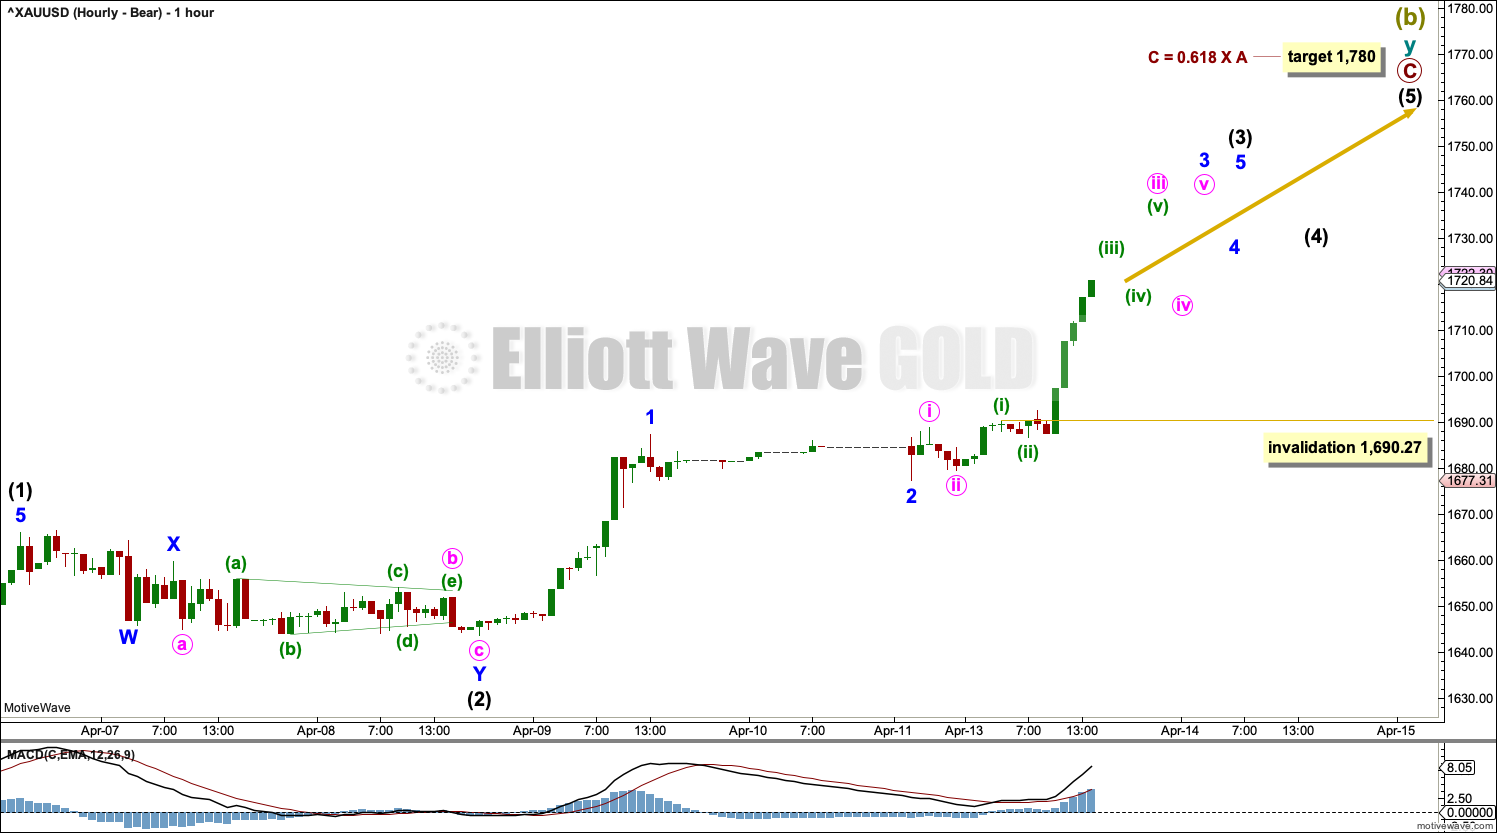
The hourly chart focusses on the end of primary wave C.
Intermediate wave (3) may be an incomplete impulse.
Within intermediate wave (3): minor waves 1 and 2 may be complete and minor wave 3 has now moved beyond the end of minor wave 1. Minor wave 3 may only subdivide as an impulse. Within the impulse: minuette wave (iv) may not move into minuette wave (i) price territory below 1,690.27.
ALTERNATE BULLISH ELLIOTT WAVE COUNT
WEEKLY CHART
Click chart to enlarge.
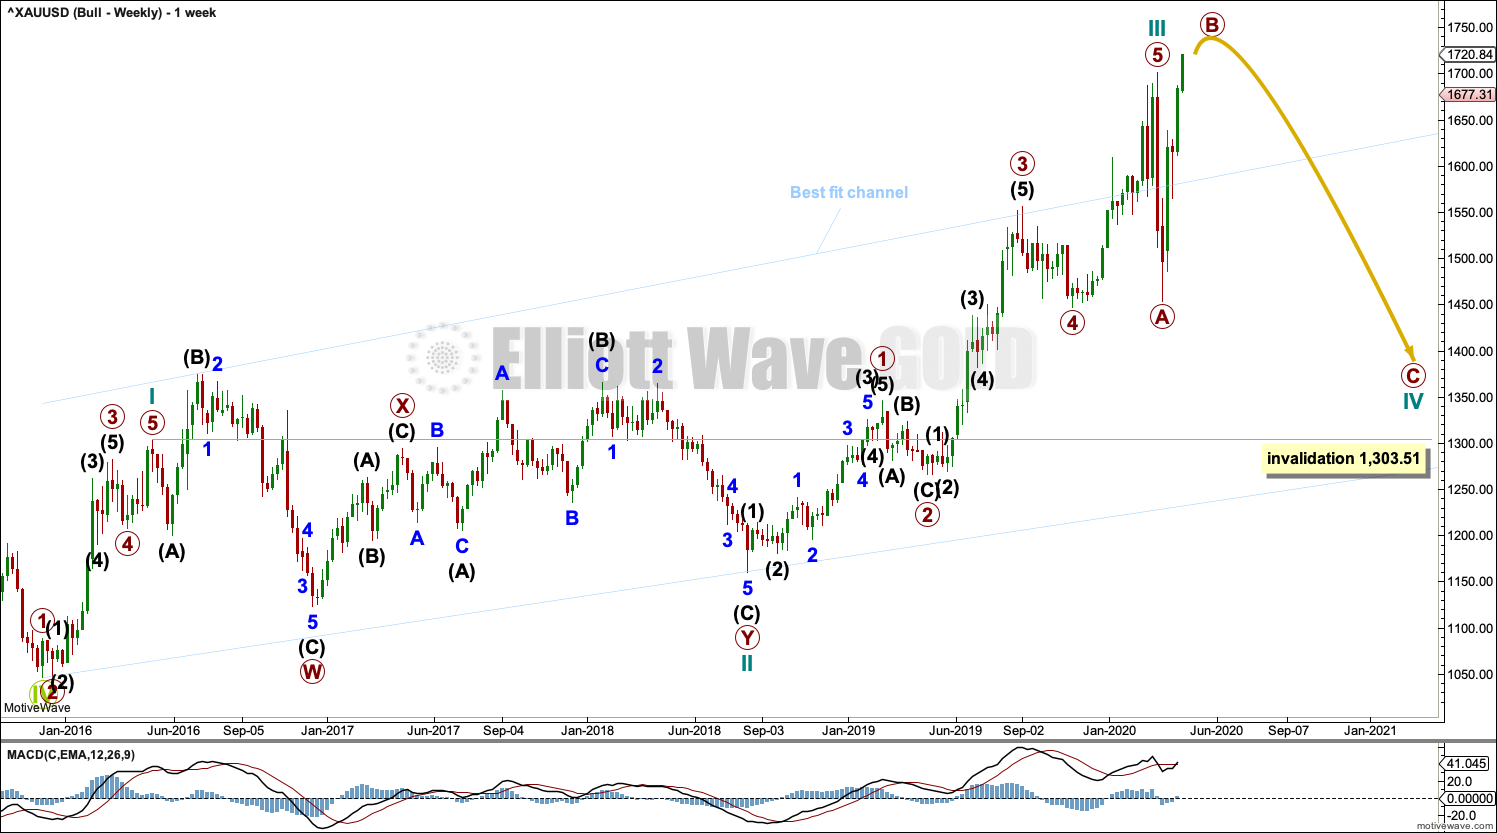
This wave count sees the the bear market complete at the last major low for Gold on 3 December 2015.
If Gold is in a new bull market, then it should begin with a five wave structure upwards on the weekly chart.
Cycle wave I fits as a five wave impulse with reasonably proportionate corrections for primary waves 2 and 4. This resolves a previous major problem with the bullish wave count.
Cycle wave II now fits as a double flat. However, a problem arises with the relabelling of this structure. Within the first flat correction labelled primary wave W, this wave count now needs to ignore what looks like an obvious triangle from July to September 2016 (this can be seen labelled as a triangle on the bear wave count above). This movement must now be labelled as a series of overlapping first and second waves.
Within the first flat correction labelled primary wave W of the double flat of cycle wave II, intermediate wave (B) is 1.69 the length of intermediate wave (A). This is longer than the common range of up to 1.38, but within an allowable guideline of up to 2. The length of intermediate wave (B) reduces the probability of this wave count.
Cycle wave III may be complete. Cycle wave IV may not move into cycle wave I price territory below 1,303.51.
DAILY CHART
Click chart to enlarge.
Cycle wave III may be complete. Cycle wave IV may not move into cycle wave I price territory below 1,303.51.
Cycle wave II was relatively deep at 0.55 of cycle wave I. If cycle wave IV exhibits alternation in depth, it may more likely be shallow; the first target at 0.382 of cycle wave III would be preferred.
Cycle wave IV may subdivide as a flat correction, triangle or combination. Both a flat and triangle would still provide structural alternation with the combination of cycle wave II.
If cycle wave IV subdivides as a flat correction, then within it the common range for primary wave B within a flat would be from 1 to 1.38 times the length of primary wave A.
If cycle wave IV subdivides as a triangle, then within it primary wave B may make a new high above the start of primary wave A as in a running triangle.
There is no upper invalidation point for this wave count.
HOURLY CHART
Click chart to enlarge.
Both hourly wave counts expect an impulse to continue higher. This alternate labels it intermediate wave (C) whereas the main wave count labels it intermediate wave (3).
TECHNICAL ANALYSIS
WEEKLY CHART
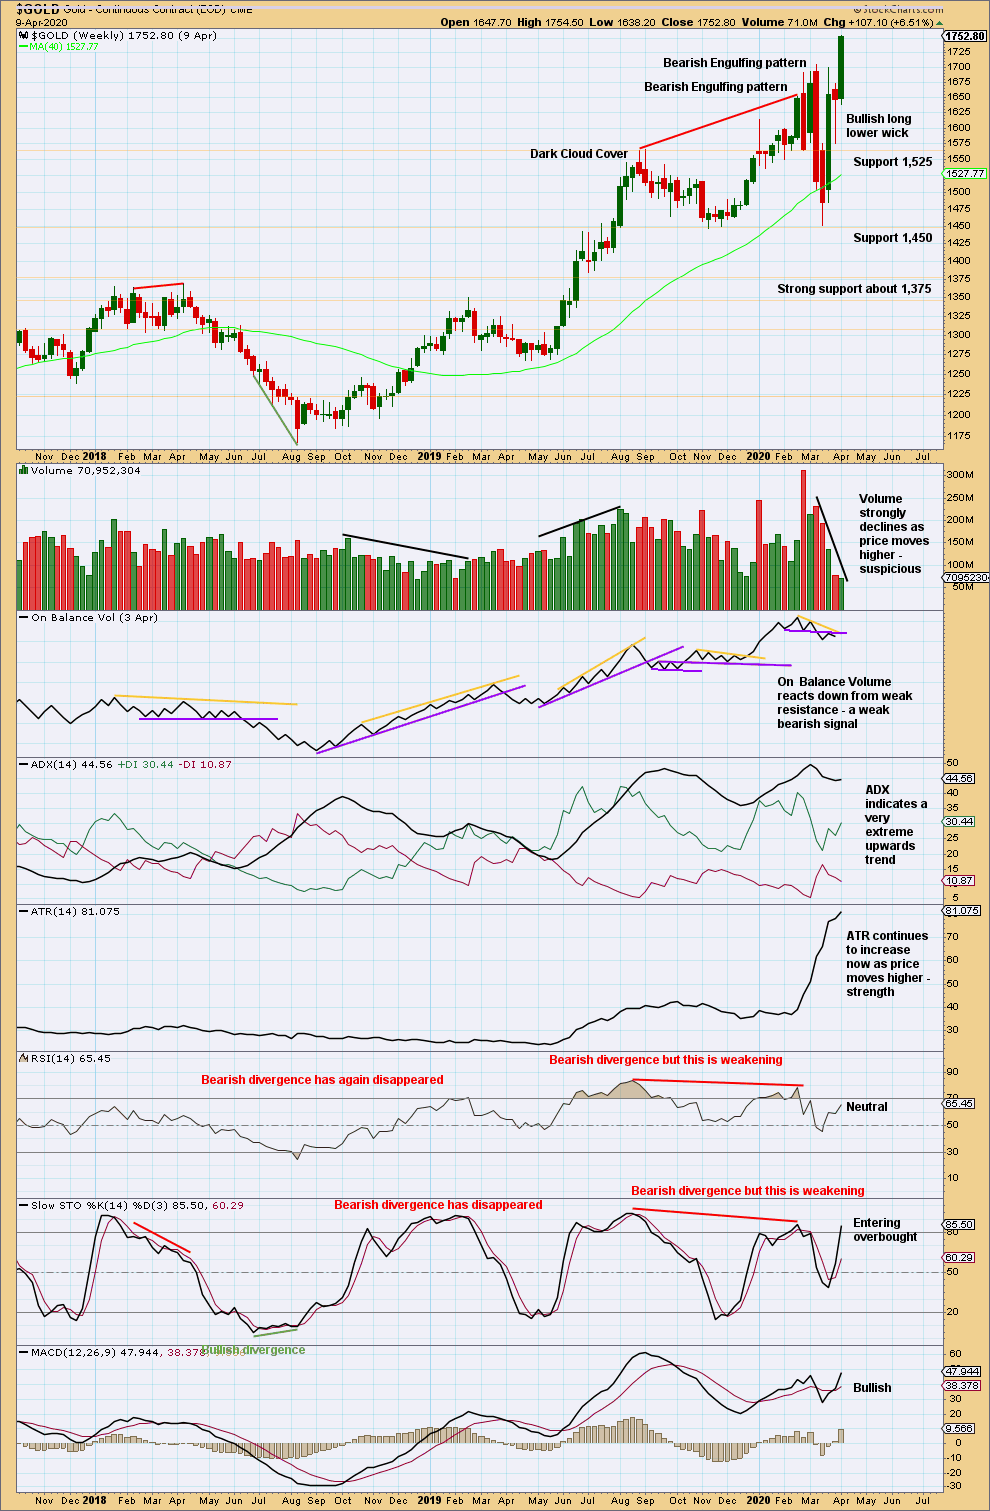
Click chart to enlarge. Chart courtesy of StockCharts.com.
New highs last week come while the upwards trend is again very extreme. Volume this week is very weak. This upwards breakout should be treated with reasonable suspicion.
DAILY CHART

Click chart to enlarge. Chart courtesy of StockCharts.com.
Volume continues to be light. RSI and On Balance Volume continue to exhibit bearish divergence. This upwards breakout is still suspicious. It may yet continue further, but at this stage with the data in hand it does not look like a sustainable bullish trend.
GDX WEEKLY CHART
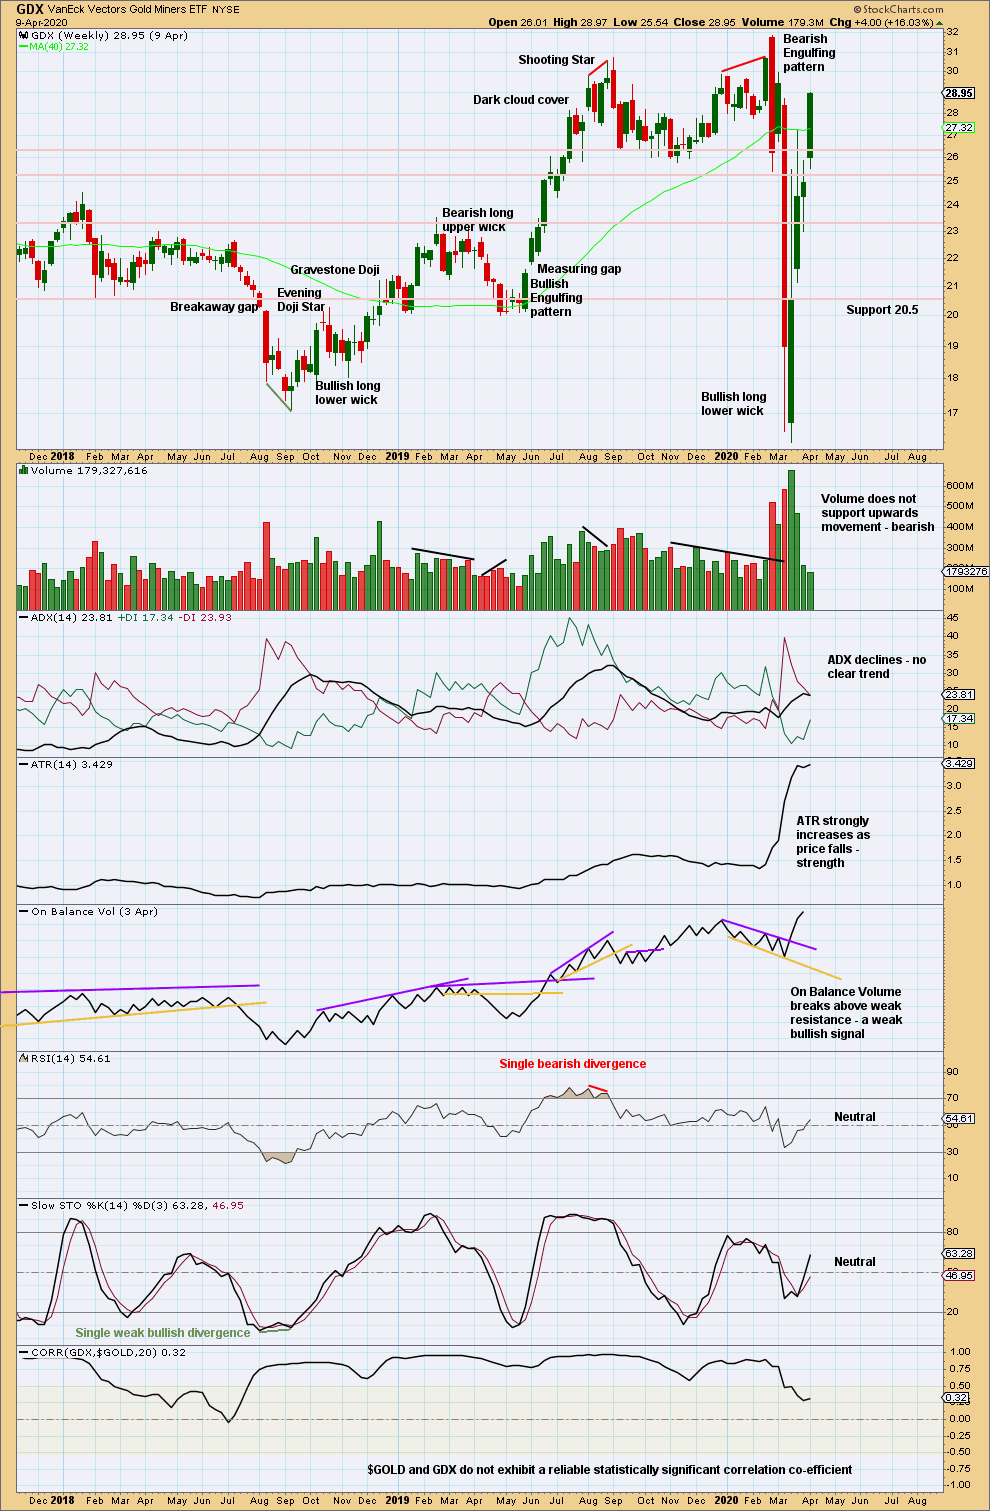
Click chart to enlarge. Chart courtesy of StockCharts.com.
Another wide ranging upwards week does not have support from volume. This upwards movement is suspicious.
GDX DAILY CHART
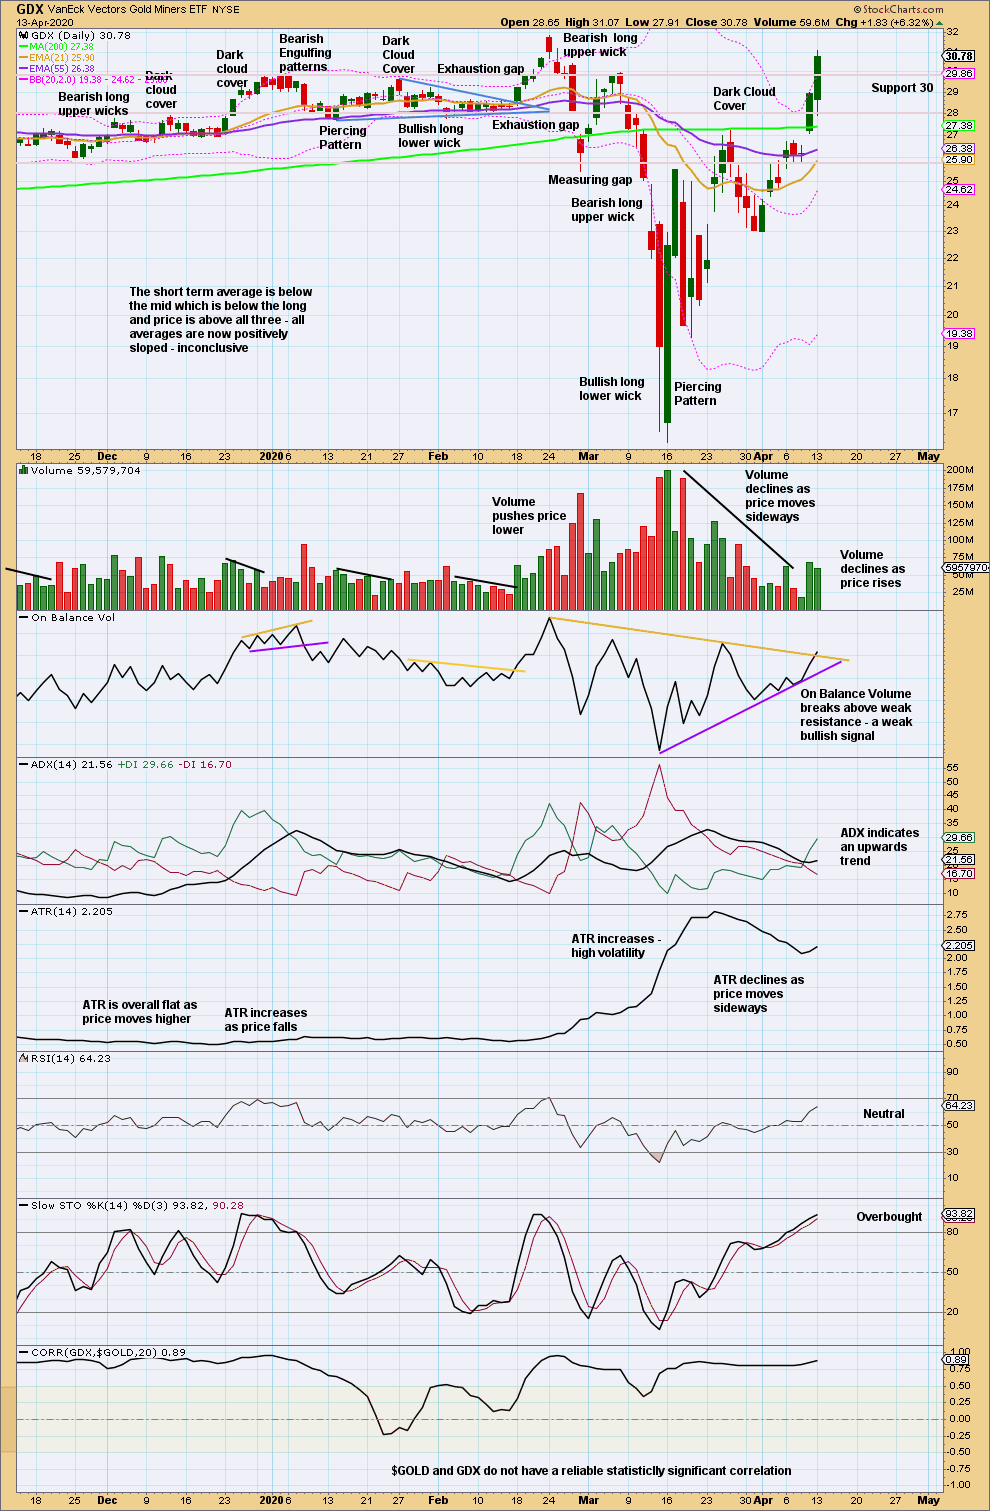
Click chart to enlarge. Chart courtesy of StockCharts.com.
A target calculated from the width of the last consolidation zone, after an upwards breakout, is at 31.21.
Published @ 08:05 p.m. EST.
—
Careful risk management protects your trading account(s).
Follow my two Golden Rules:
1. Always trade with stops.
2. Risk only 1-5% of equity on any one trade.
—
New updates to this analysis are in bold.