
GOLD: Elliott Wave and Technical Analysis | Charts – April 30, 2020
Downwards movement continues with increased range and strength as the Elliott wave count has expected.
Summary: The bounce may now be over. A target for the bullish wave count for a downwards wave is at 1,324. The main bearish wave count expects a new downwards trend for several months to new lows below 1,046.27 with a new short-term target for a third wave down at 1,607.
If price makes a new high above 1,744.37, then an alternate wave count would be more likely. The target would then be at 1,980.
Grand SuperCycle analysis is here.
Monthly charts were last updated here.
MAIN BEARISH ELLIOTT WAVE COUNT
WEEKLY CHART
Click chart to enlarge.
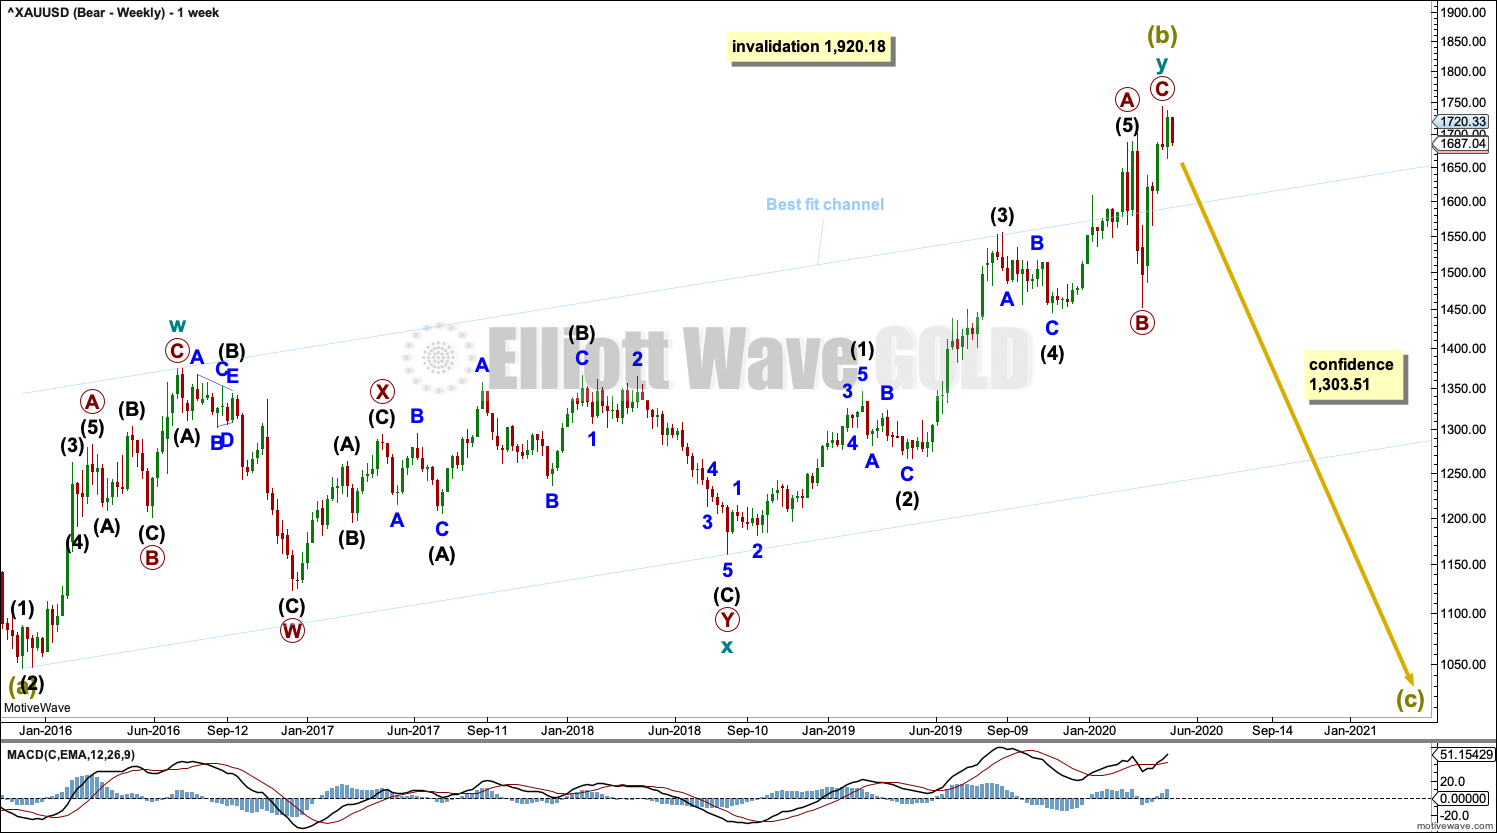
Super Cycle wave (b) may be a complete double zigzag.
The first zigzag in the double is labelled cycle wave w. The double is joined by a three in the opposite direction, a combination labelled cycle wave x. The second zigzag in the double is labelled cycle wave y.
The purpose of the second zigzag in a double is to deepen the correction. Cycle wave y has achieved this purpose.
A wide best fit channel is added in light blue. Copy this channel over to daily charts.
DAILY CHART
Click chart to enlarge.
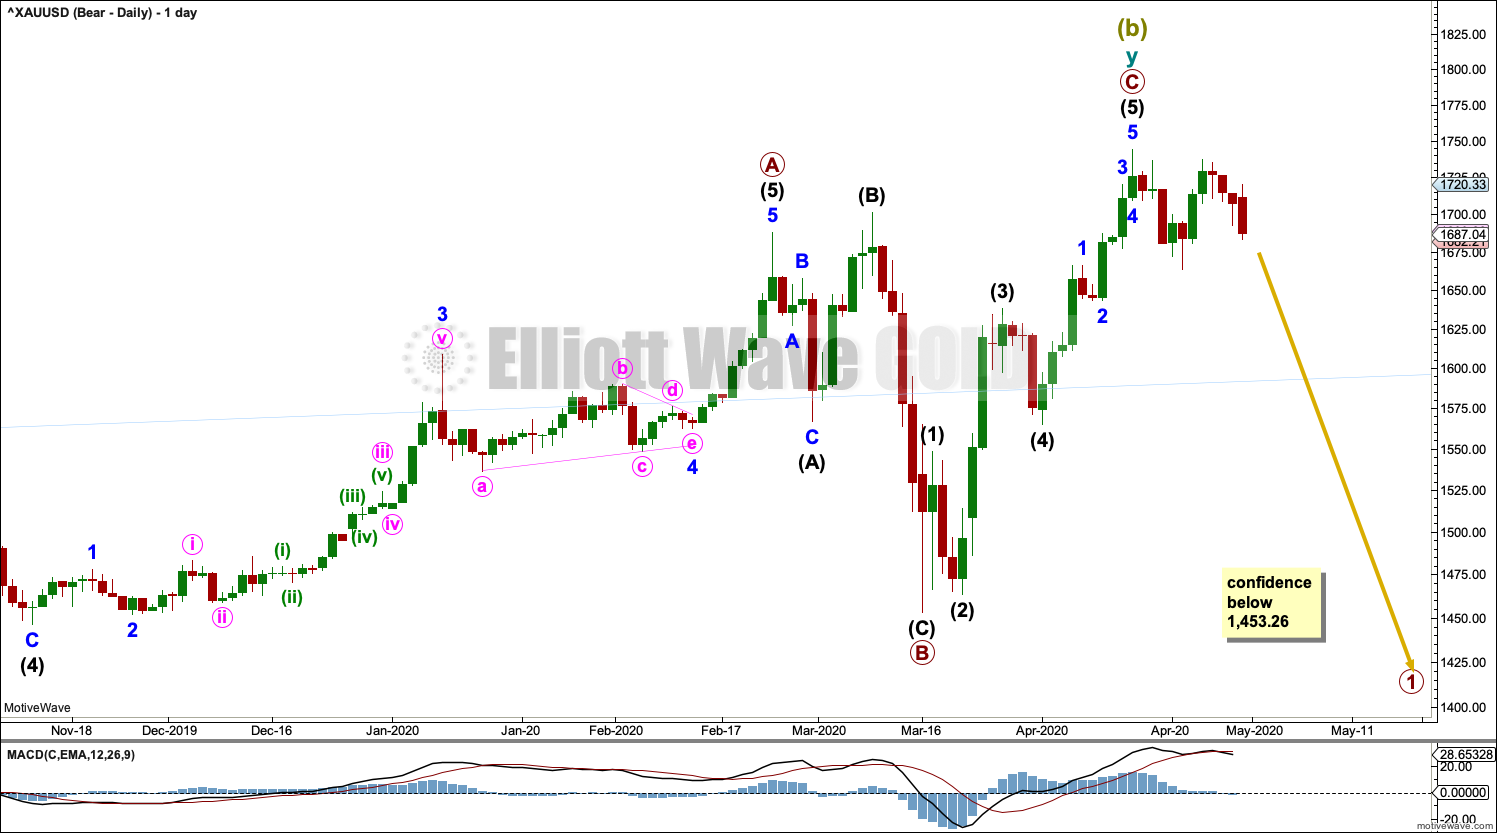
The daily chart focusses on the structure of cycle wave y. It is possible again that primary wave C may be over.
A new low now below 1,453.26 would add substantial confidence to this wave count. At that stage, the alternate below would be invalidated.
HOURLY CHART
Click chart to enlarge.
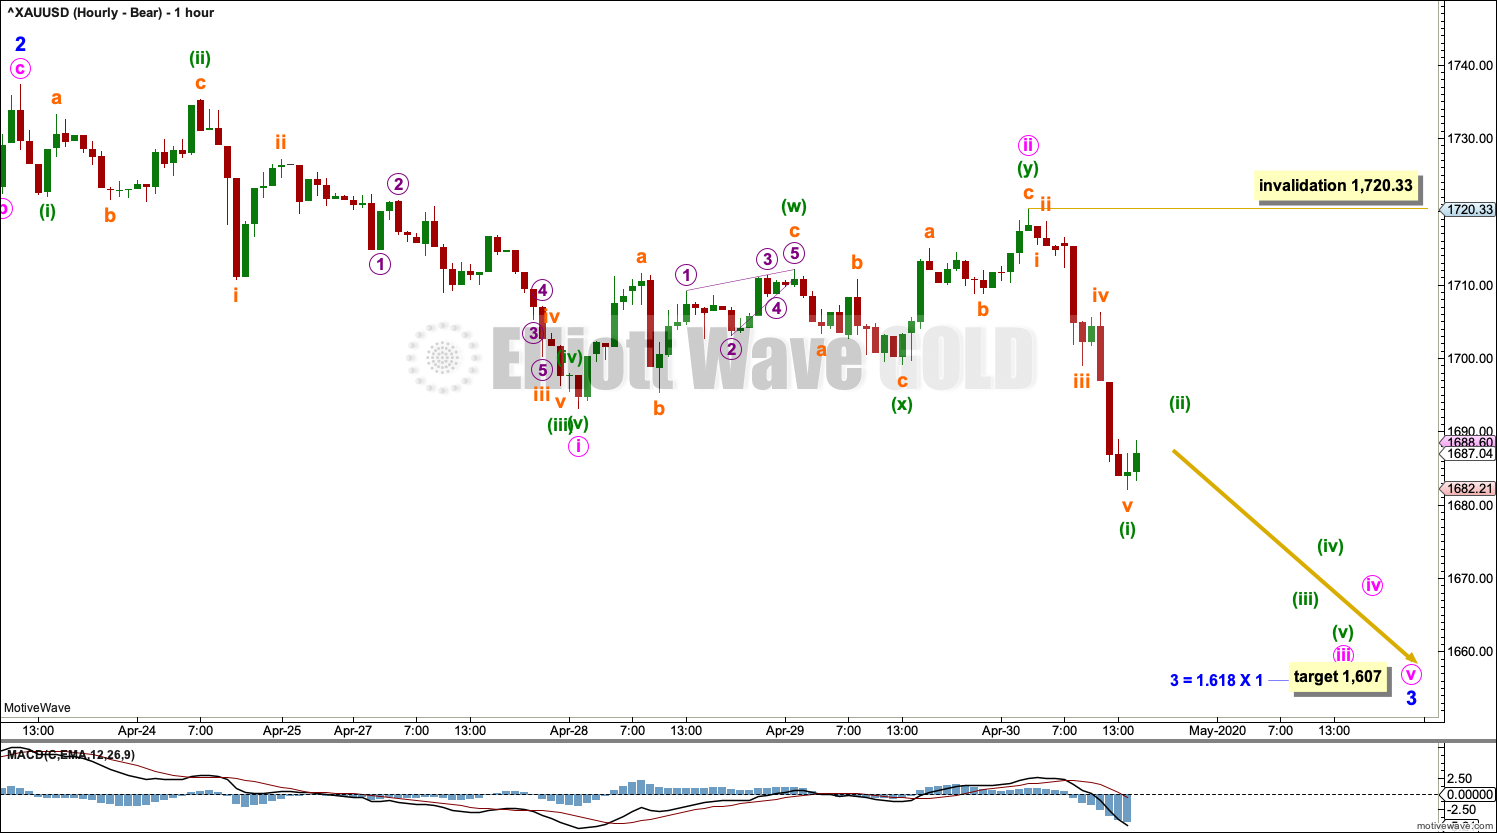
Minor wave 2 may be a complete zigzag.
A target is now calculated for minor wave 3.
Minor wave 3 may only subdivide as an impulse. Minute waves i and ii within minor wave 3 may now be complete. Minute wave iii may only subdivide as an impulse. Minuette wave (ii) within minute wave iii may not move beyond the start of minuette wave (i) above 1,720.33.
ALTERNATE BEARISH WAVE COUNT
DAILY CHART
Click chart to enlarge.
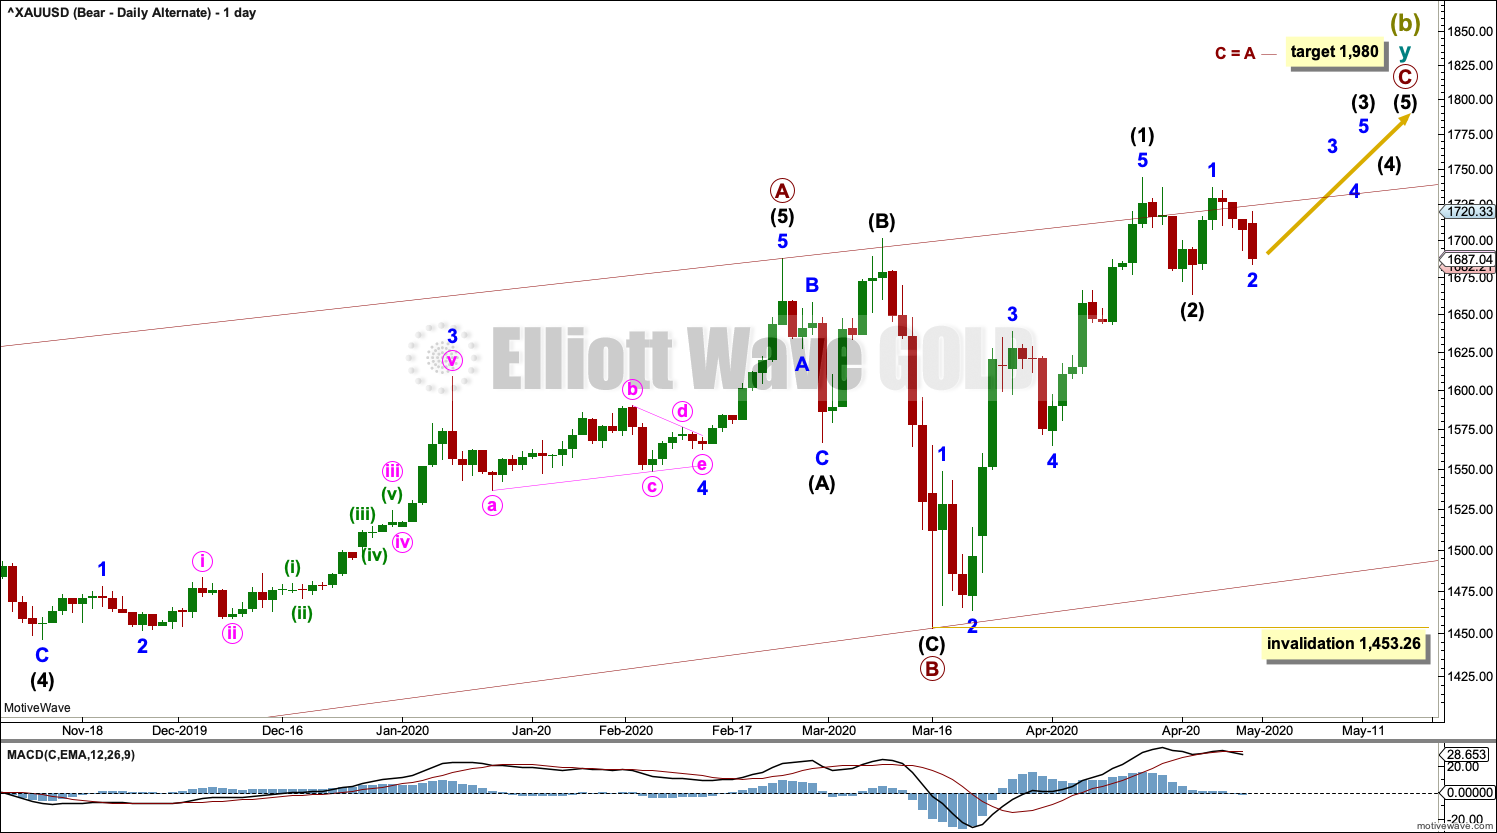
This wave count follows the alternate monthly bearish wave count published in last monthly analysis, which is linked to at the beginning of this analysis.
This wave count looks at the possibility that Grand Super Cycle wave (II) may be a flat correction, which would require Super Cycle wave (b) within it to retrace a minimum 0.9 length of Super Cycle wave (a) at 1,832.79. Super Cycle wave (b) may make a new high above the start of Super Cycle wave (a) at 1,920.18 as in an expanded flat.
By moving the degree of labelling within primary wave C down one degree, it is possible to see that it may be incomplete. Only intermediate wave (1) within primary wave C may be complete. Intermediate wave (2) may not move beyond the start of intermediate wave (1) below 1,453.26.
This wave count should only be used if price makes a new short-term high above 1,744.37. At that stage, it would increase in probability.
HOURLY CHART
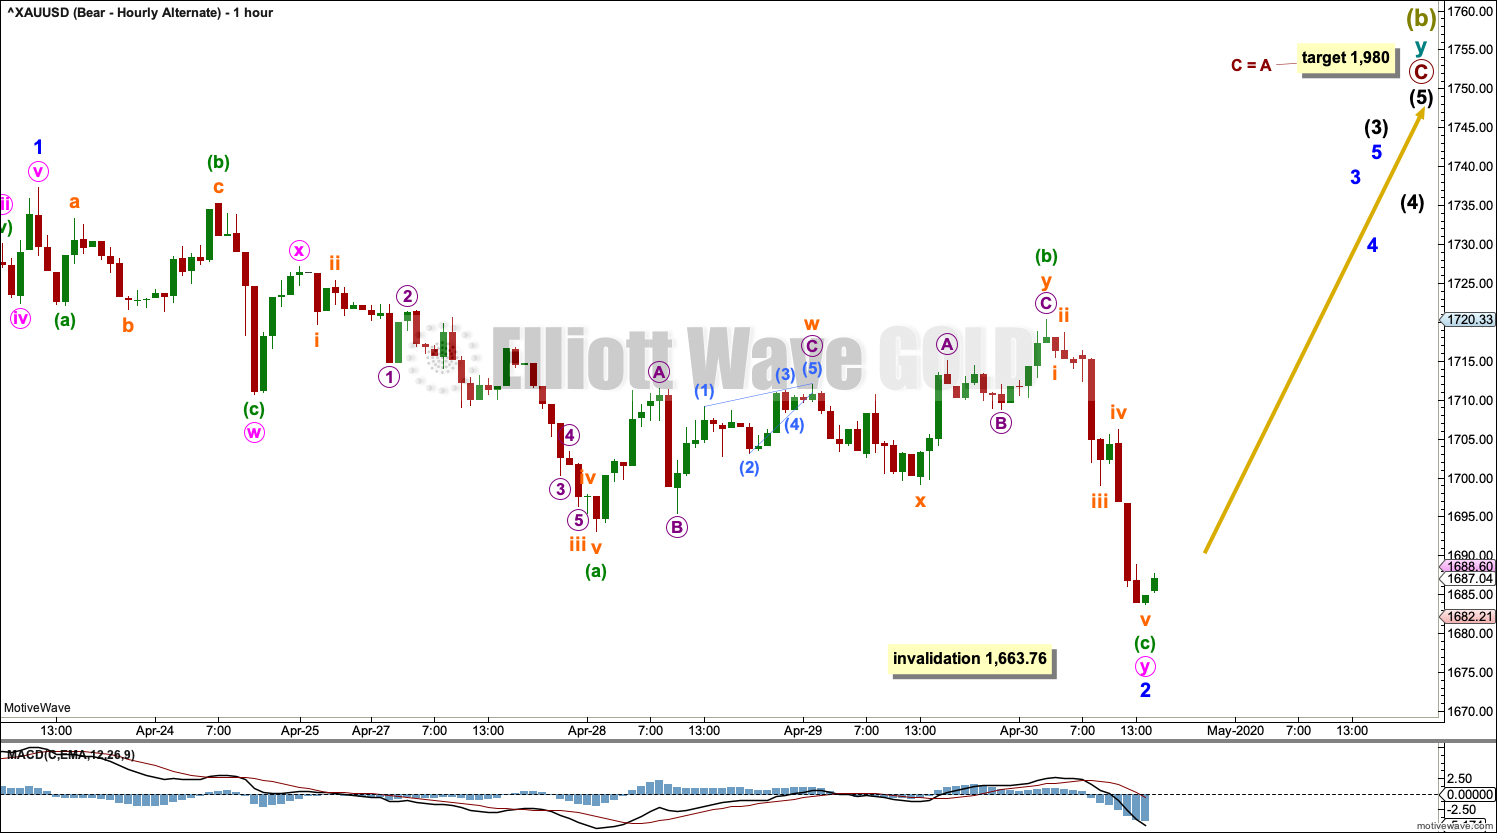
Click chart to enlarge.
If Gold remains in a bullish trend, then the last downwards movement should subdivide as a corrective structure. This is labelled minor wave 2, which may have extended lower as a double zigzag.
If minor wave 2 continues any lower, then it may not move beyond the start of minor wave 1 below 1,663.76.
ALTERNATE BULLISH ELLIOTT WAVE COUNT
WEEKLY CHART
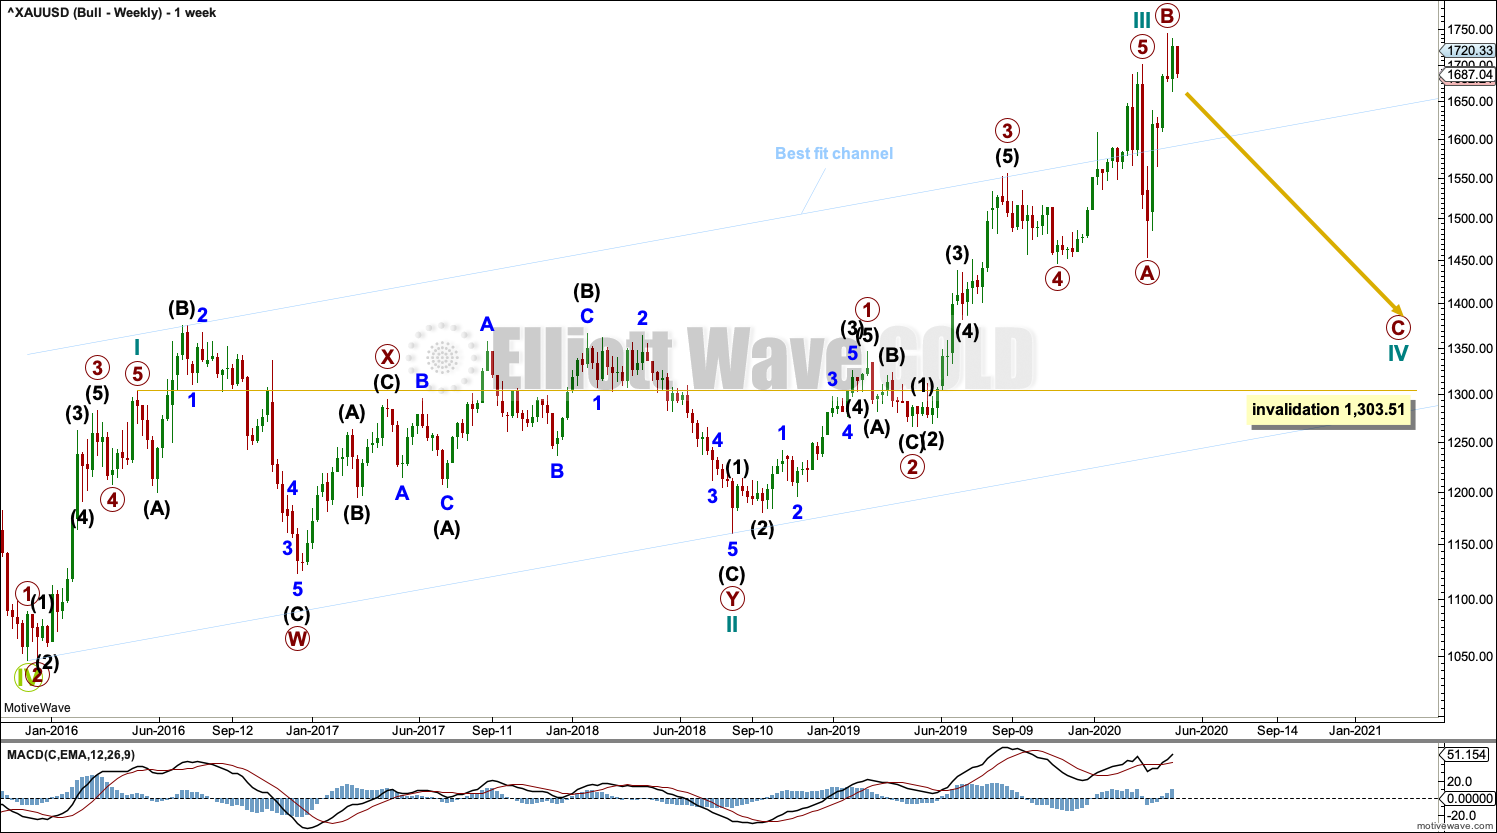
Click chart to enlarge.
This wave count sees the the bear market complete at the last major low for Gold on 3 December 2015.
If Gold is in a new bull market, then it should begin with a five wave structure upwards on the weekly chart.
Cycle wave I fits as a five wave impulse with reasonably proportionate corrections for primary waves 2 and 4.
Cycle wave II fits as a double flat. However, within the first flat correction labelled primary wave W, this wave count needs to ignore what looks like an obvious triangle from July to September 2016 (this can be seen labelled as a triangle on the bear wave count above). This movement must be labelled as a series of overlapping first and second waves.
Within the first flat correction labelled primary wave W of the double flat of cycle wave II, intermediate wave (B) is 1.69 the length of intermediate wave (A). This is longer than the common range of up to 1.38, but within an allowable guideline of up to 2. The length of intermediate wave (B) reduces the probability of this wave count.
Cycle wave III may be complete. Cycle wave IV may not move into cycle wave I price territory below 1,303.51.
DAILY CHART
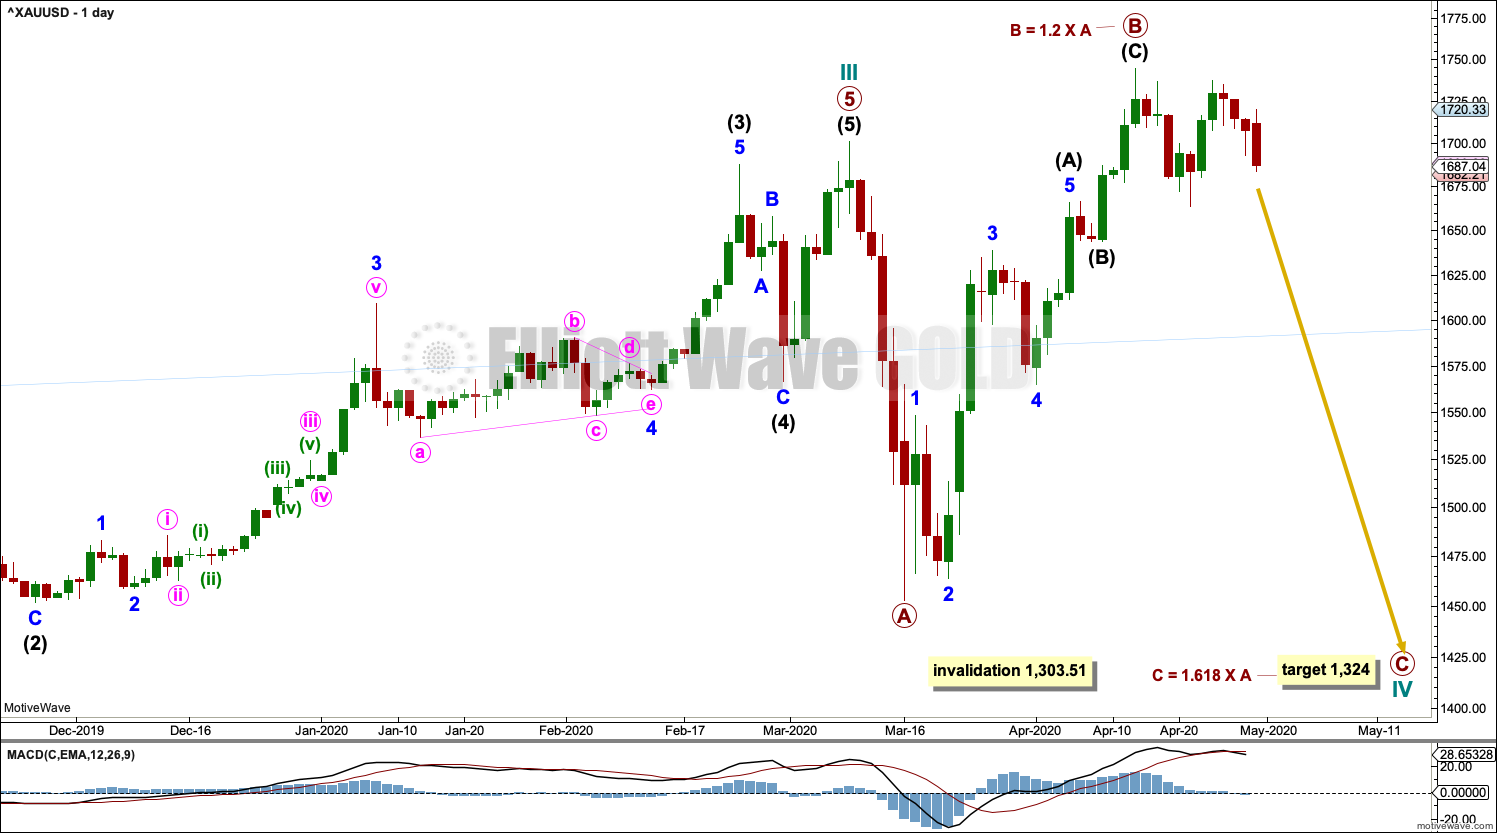
Click chart to enlarge.
Cycle wave III may be complete. Cycle wave IV may not move into cycle wave I price territory below 1,303.51.
Cycle wave II was relatively deep at 0.55 of cycle wave I. If cycle wave IV exhibits alternation in depth, it may more likely be shallow.
Cycle wave IV may subdivide as a flat correction, triangle or combination. Both a flat and triangle would still provide structural alternation with the combination of cycle wave II.
If cycle wave IV subdivides as a flat correction, then within it the common range for primary wave B within a flat would be from 1 to 1.38 times the length of primary wave A. If primary wave B is now over, then it is within this most common range.
If cycle wave IV subdivides as a triangle, then within it primary wave B may make a new high above the start of primary wave A as in a running triangle.
Primary wave B may be a complete zigzag.
There is no upper invalidation point for this wave count. It is possible that primary wave B may continue higher.
HOURLY CHART
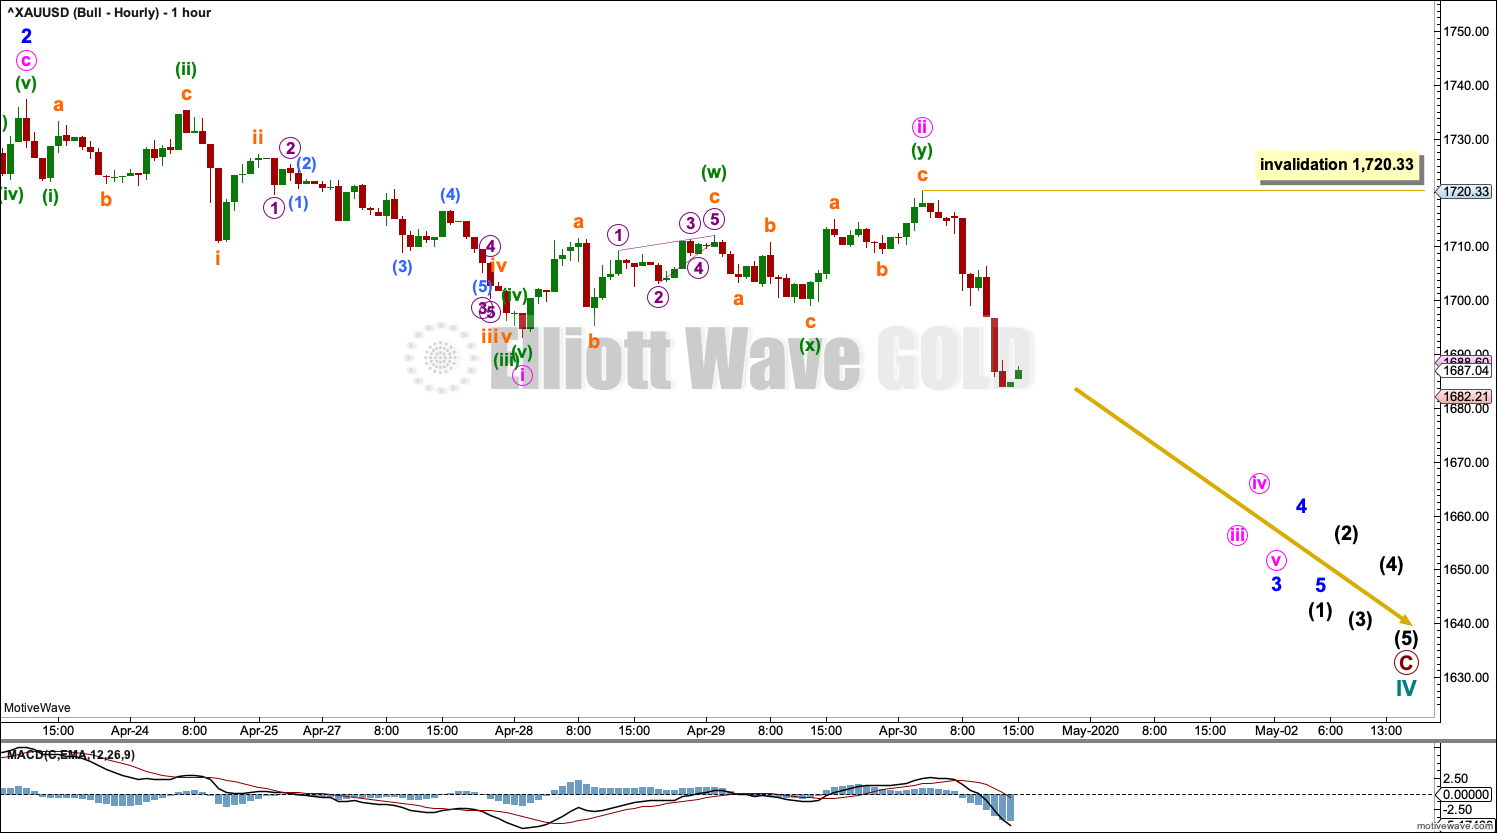
Click chart to enlarge.
Primary wave C downwards must subdivide as a five wave structure. Intermediate wave (1) within primary wave C may be incomplete.
Minor waves 1 and 2 within intermediate wave (1) may be complete. Minute waves i and ii within minor wave 3 may be complete. Within minute wave iii: no second wave correction may move beyond the start of its first wave above 1,720.33.
TECHNICAL ANALYSIS
WEEKLY CHART
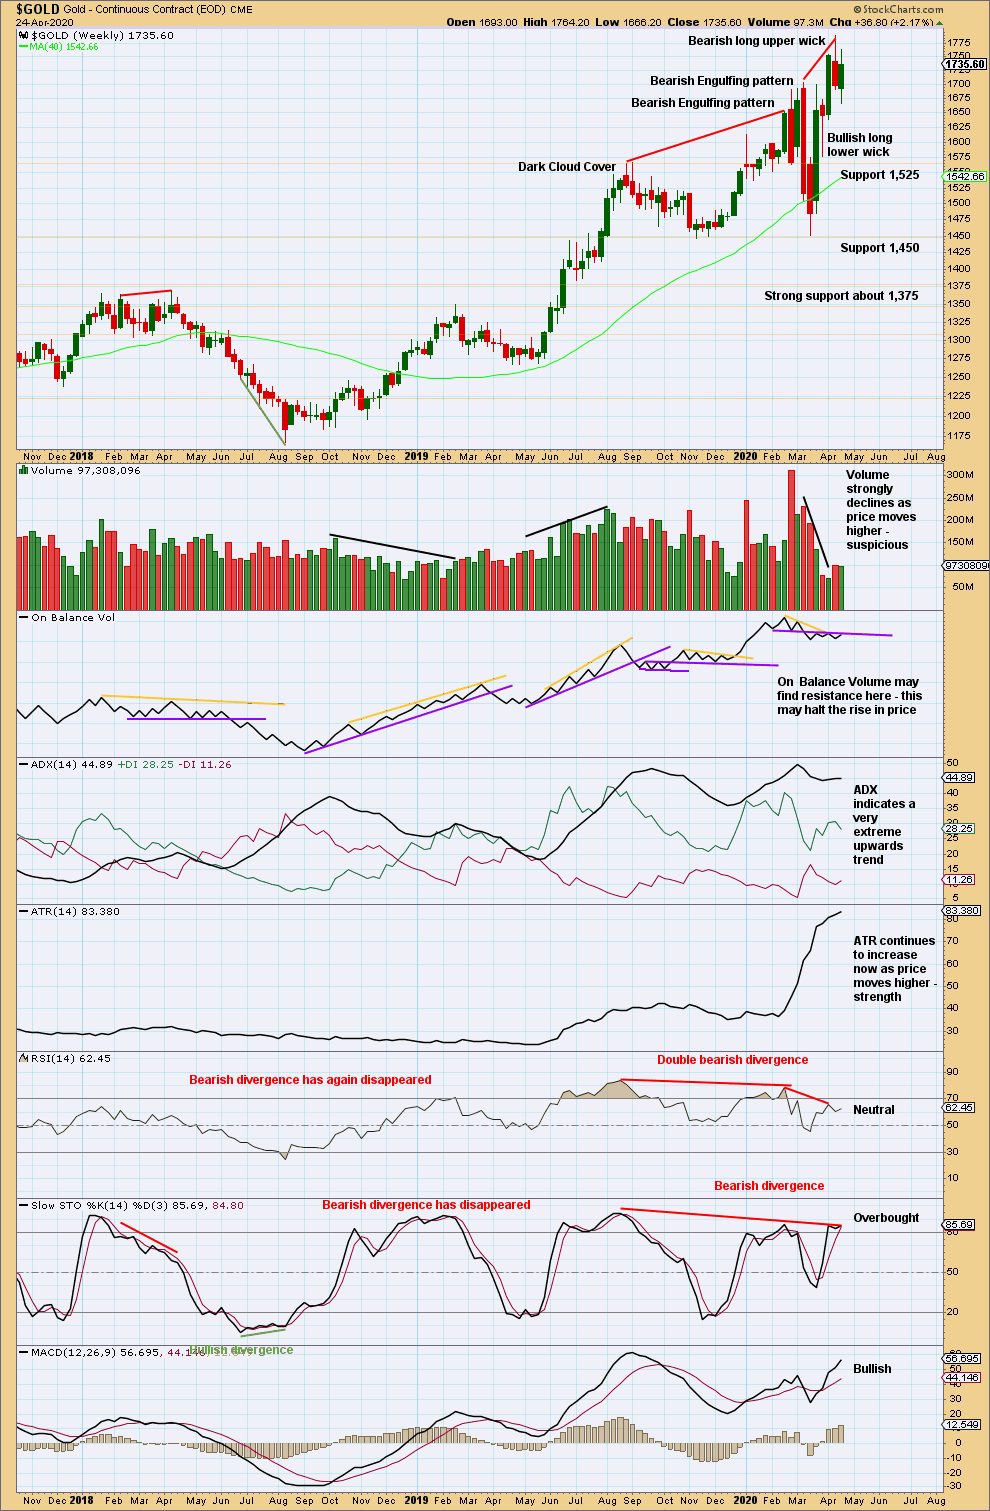
Click chart to enlarge. Chart courtesy of StockCharts.com.
Extreme bullish conditions at the last high with bearish divergence between price and RSI indicate the risk of a trend change here is high.
DAILY CHART
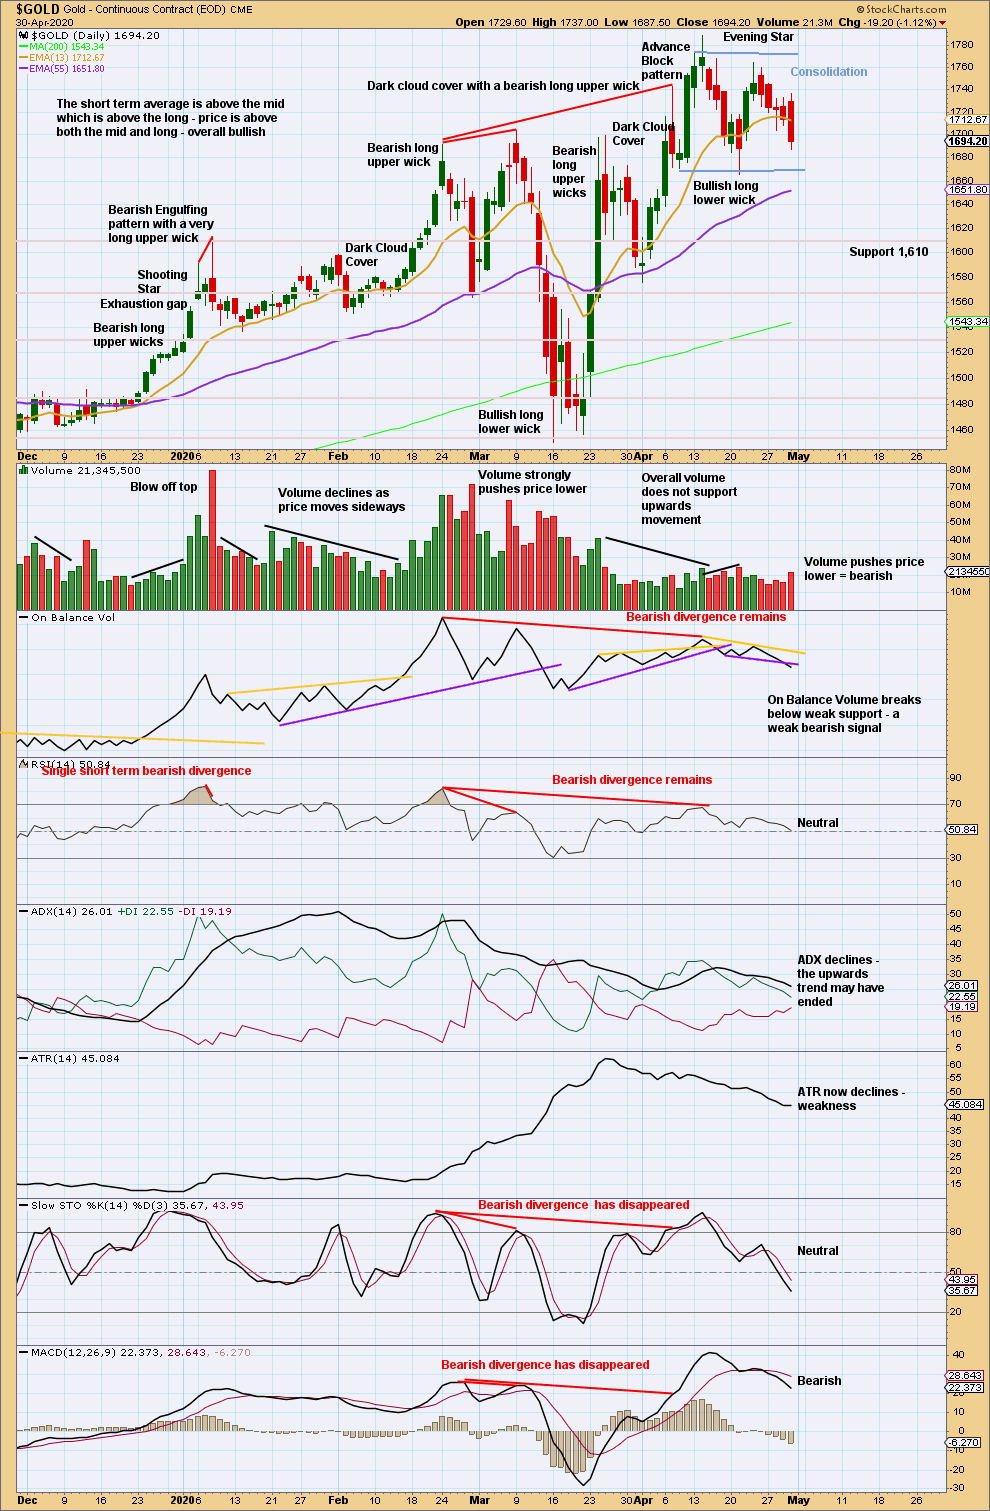
Click chart to enlarge. Chart courtesy of StockCharts.com.
An Advance Block pattern, a long upper wick, and now an Evening Star pattern are all bearish reversal signs. Mid-term bearish divergence between price and RSI increases the bearishness of these signals.
Currently, price is consolidating with resistance about 1,770 and support about 1,670. A breakout of this range is required before confidence in the next direction may be had. For the short term, a push from volume today and a weak bearish signal from On Balance Volume suggest a downwards breakout may be more likely than upwards.
GDX WEEKLY CHART
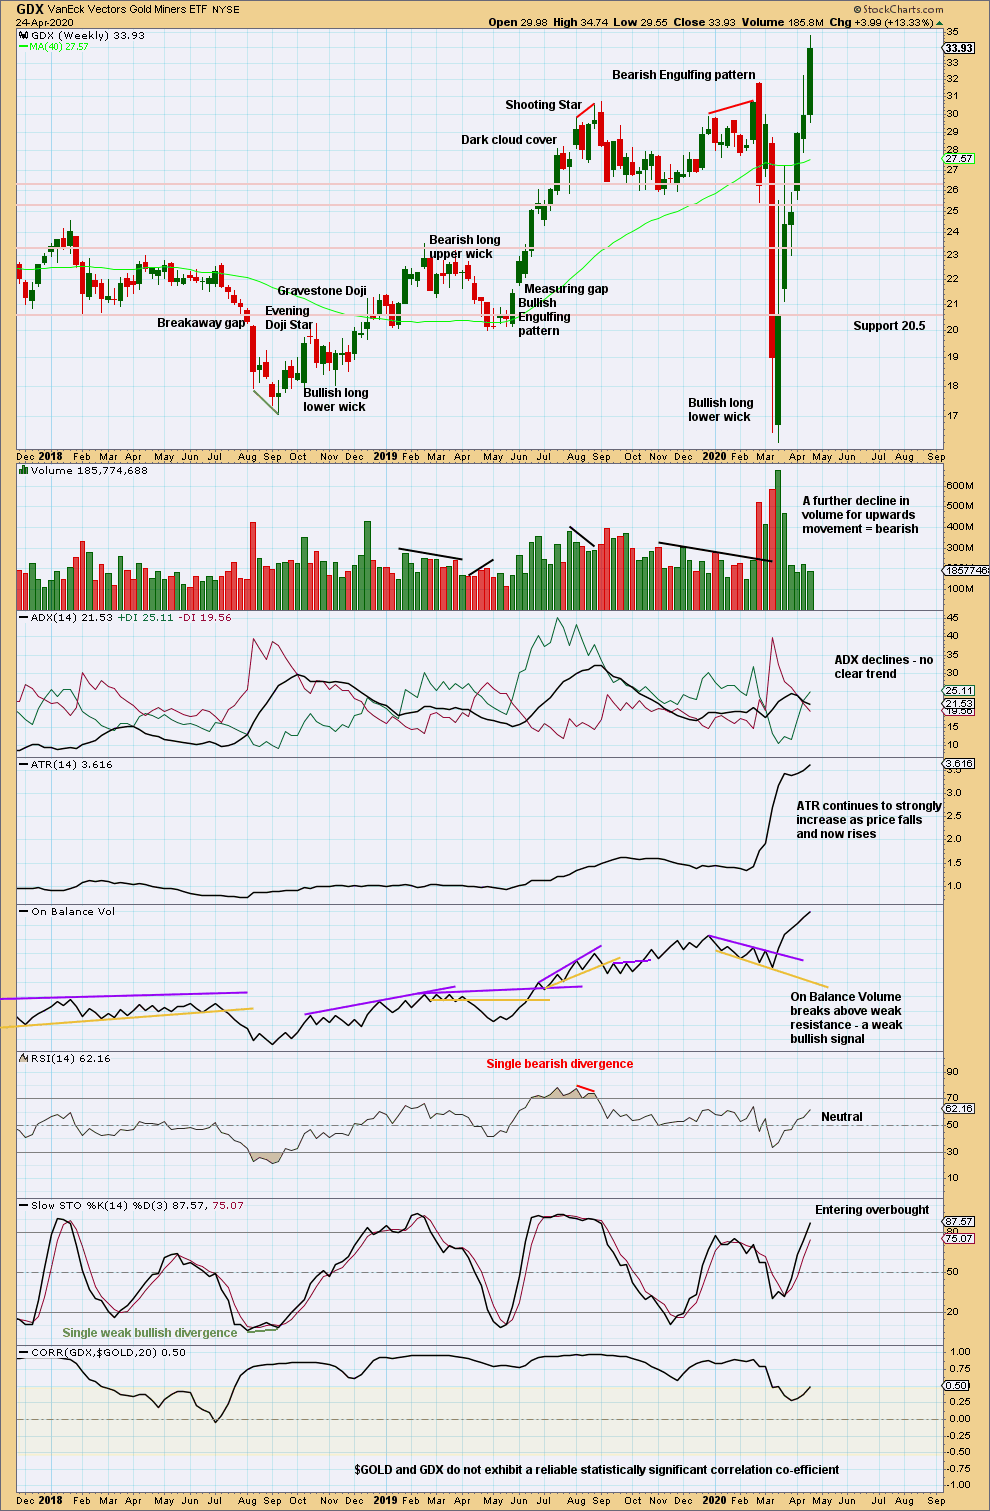
Click chart to enlarge. Chart courtesy of StockCharts.com.
Another upwards week has strong range but weak volume. With a further decline in volume, upwards movement is suspicious.
GDX DAILY CHART
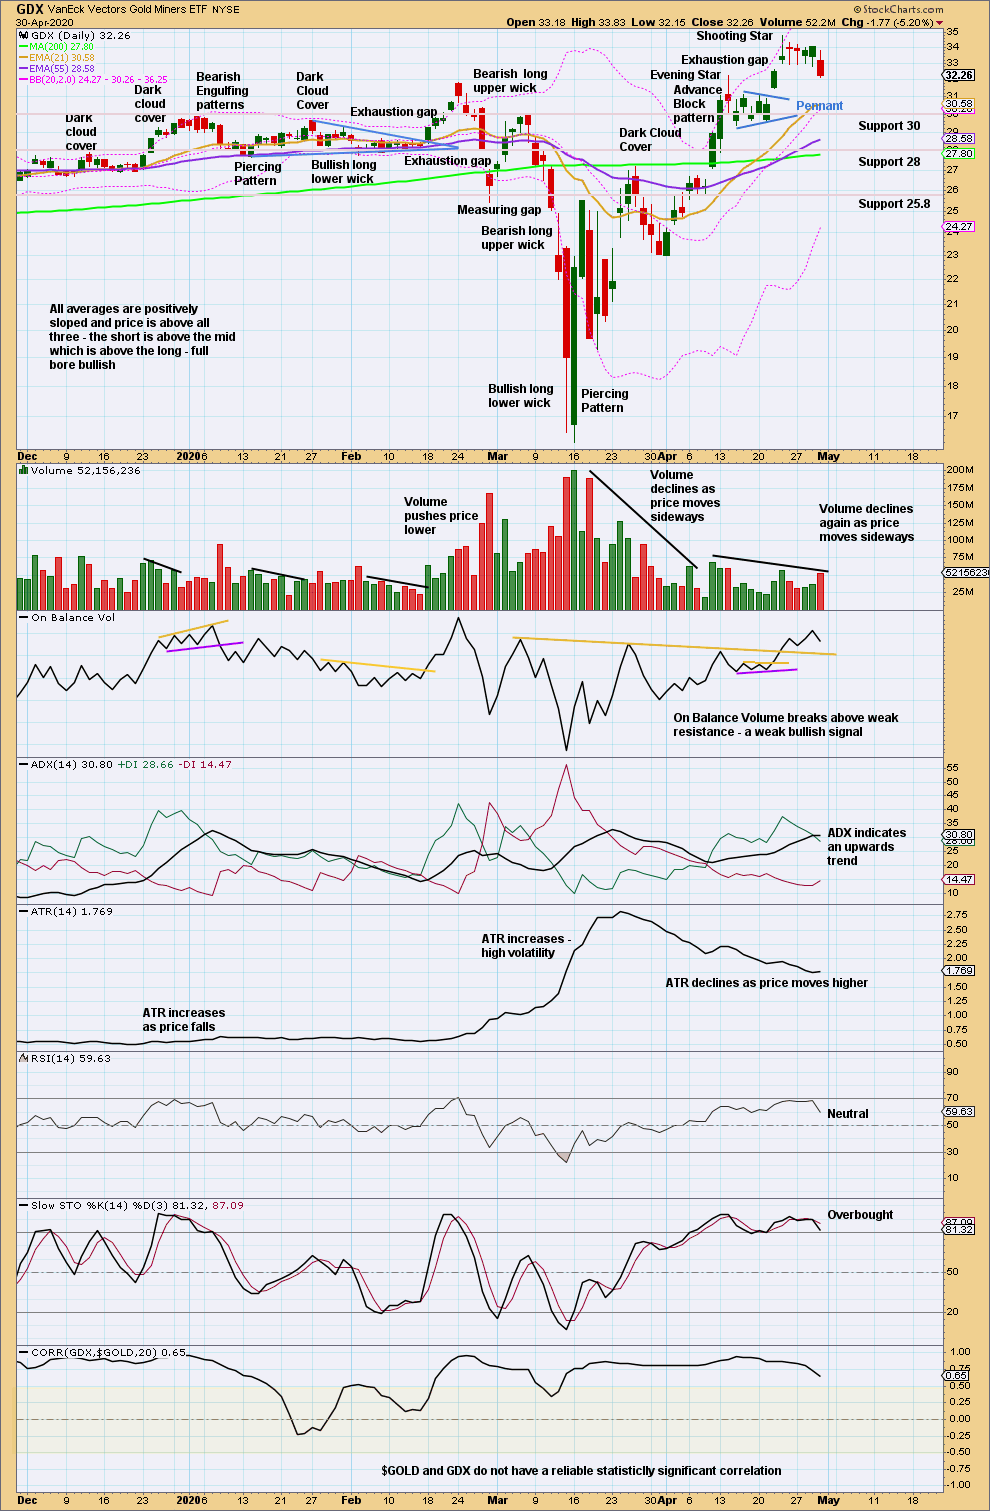
Click chart to enlarge. Chart courtesy of StockCharts.com.
A downwards day voids the possible flag pattern. A push from volume and closure of the last gap suggest a high may be in place.
Published @ 06:07 p.m. EST.
—
Careful risk management protects your trading account(s).
Follow my two Golden Rules:
1. Always trade with stops.
2. Risk only 1-5% of equity on any one trade.
—
New updates to this analysis are in bold.