
GOLD: Elliott Wave and Technical Analysis | Charts – May 11, 2020
Four Elliott wave counts remains valid.
Summary: A target for the bullish wave count for a downwards wave is at 1,324. The main bearish wave count expects a new downwards trend for several months to new lows below 1,046.27 with a short-term target for a third wave down at 1,607.
If price makes a new high above 1,744.37, then either of the second bull or bear wave counts would be more likely. The target would then be at 1,795 (bull) or 1,980 (bear).
Grand SuperCycle analysis is here.
Monthly charts were last updated here.
MAIN BEARISH ELLIOTT WAVE COUNT
WEEKLY CHART
Click chart to enlarge.
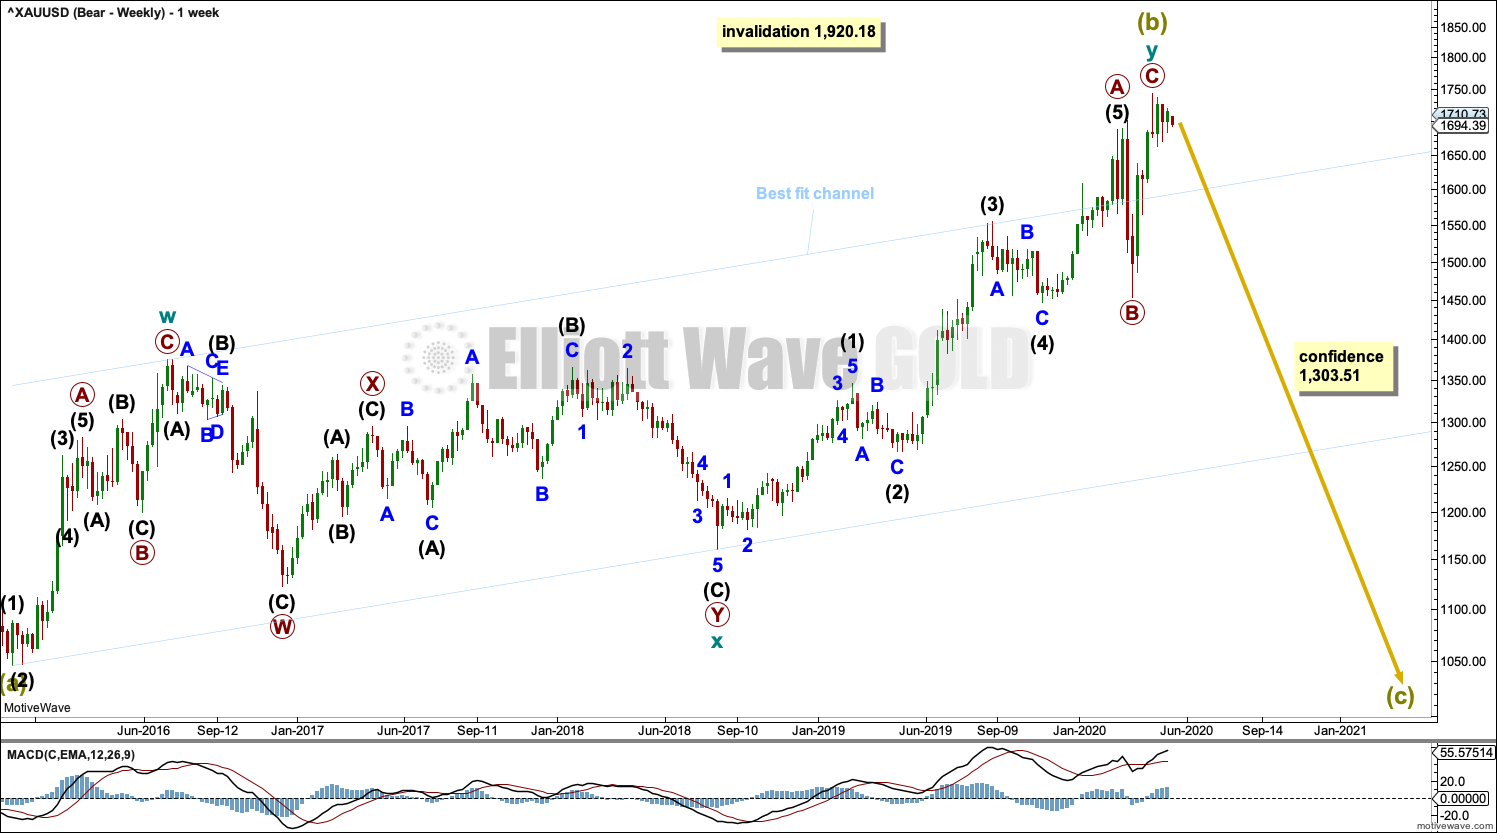
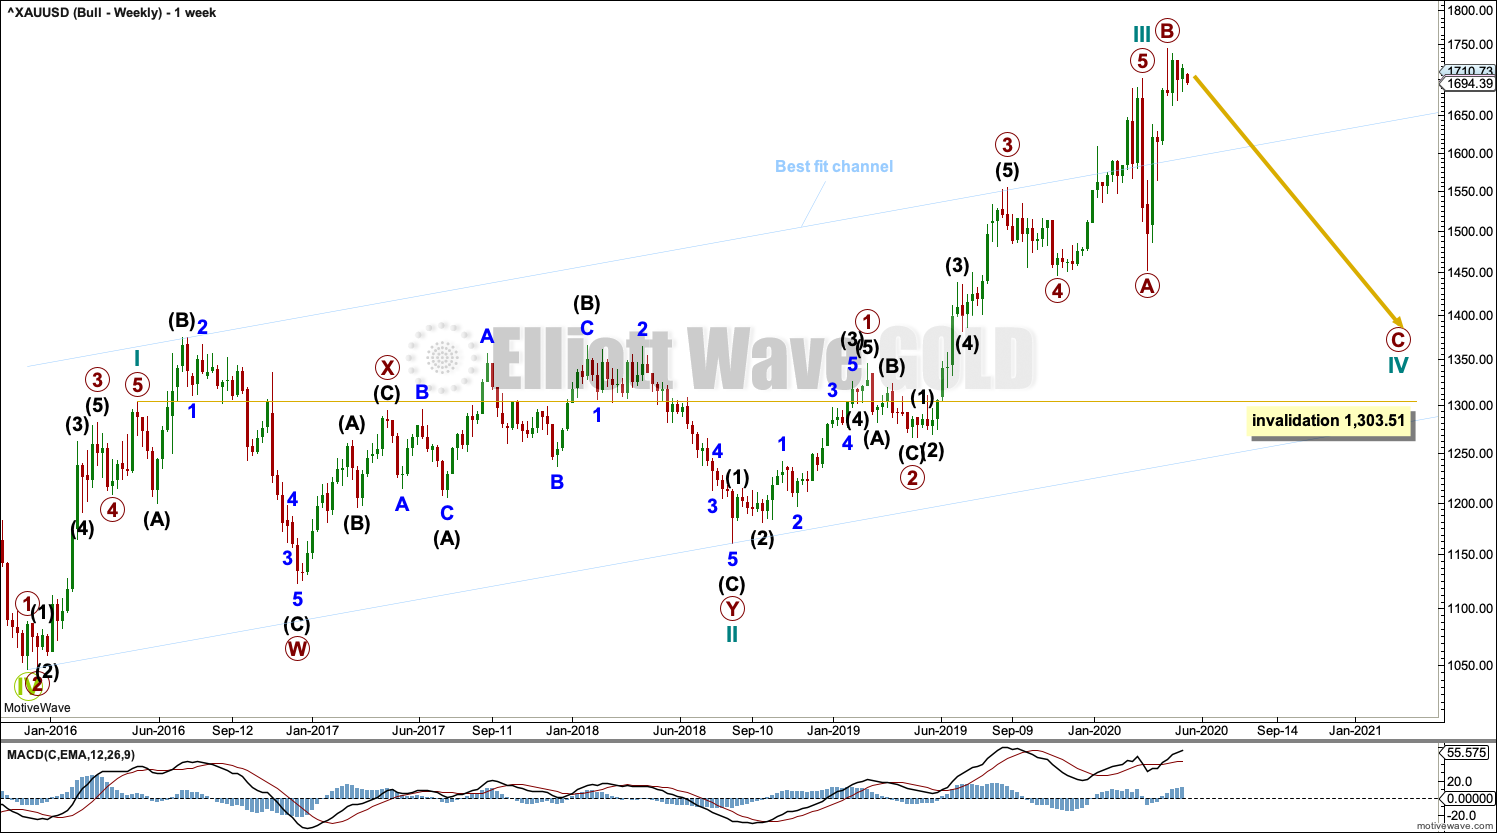
Super Cycle wave (b) may be a complete double zigzag.
The first zigzag in the double is labelled cycle wave w. The double is joined by a three in the opposite direction, a combination labelled cycle wave x. The second zigzag in the double is labelled cycle wave y.
The purpose of the second zigzag in a double is to deepen the correction. Cycle wave y has achieved this purpose.
A wide best fit channel is added in light blue.
FIRST DAILY CHART
Click chart to enlarge.
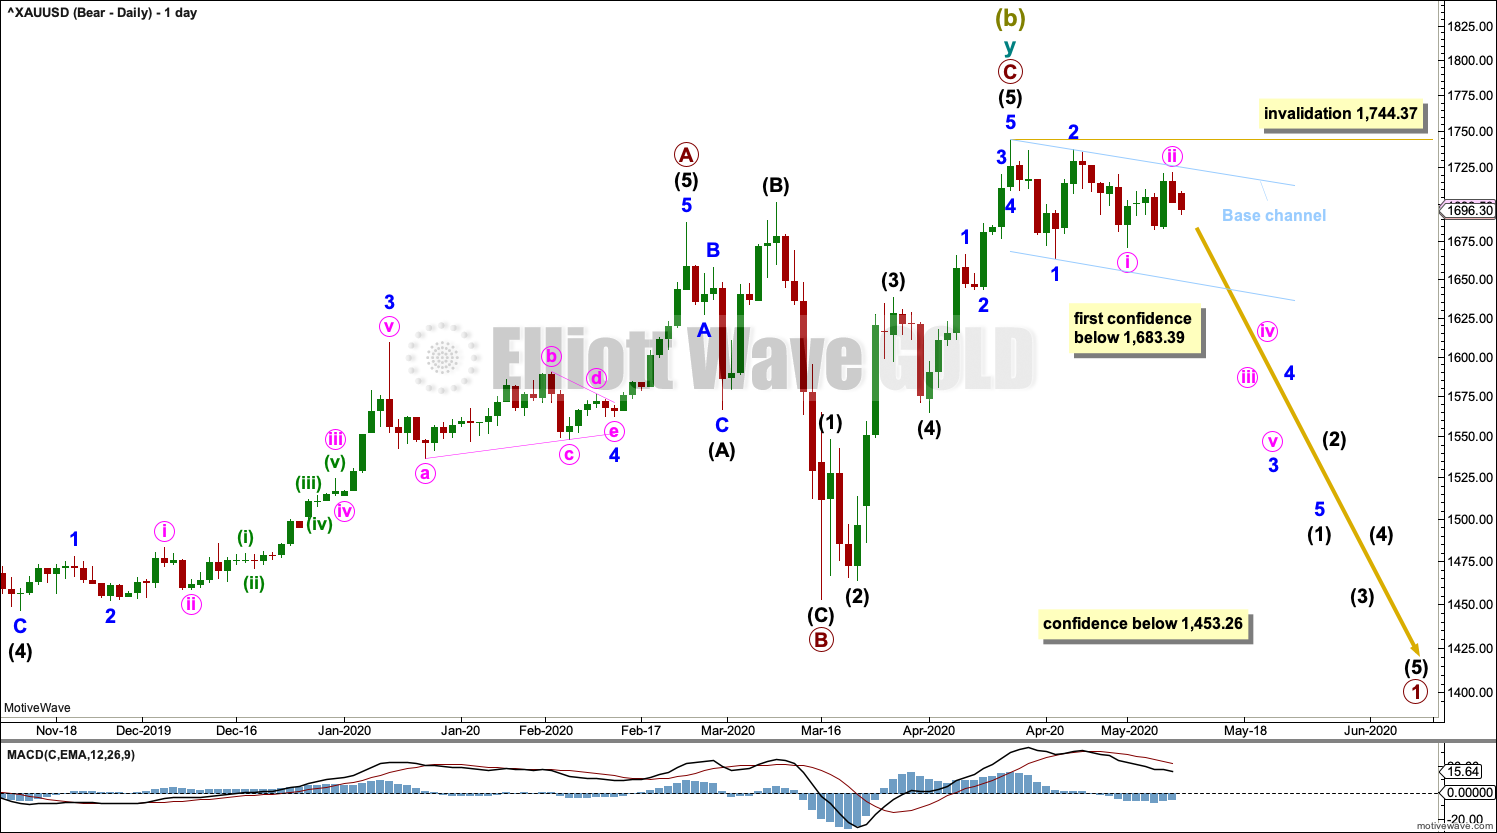
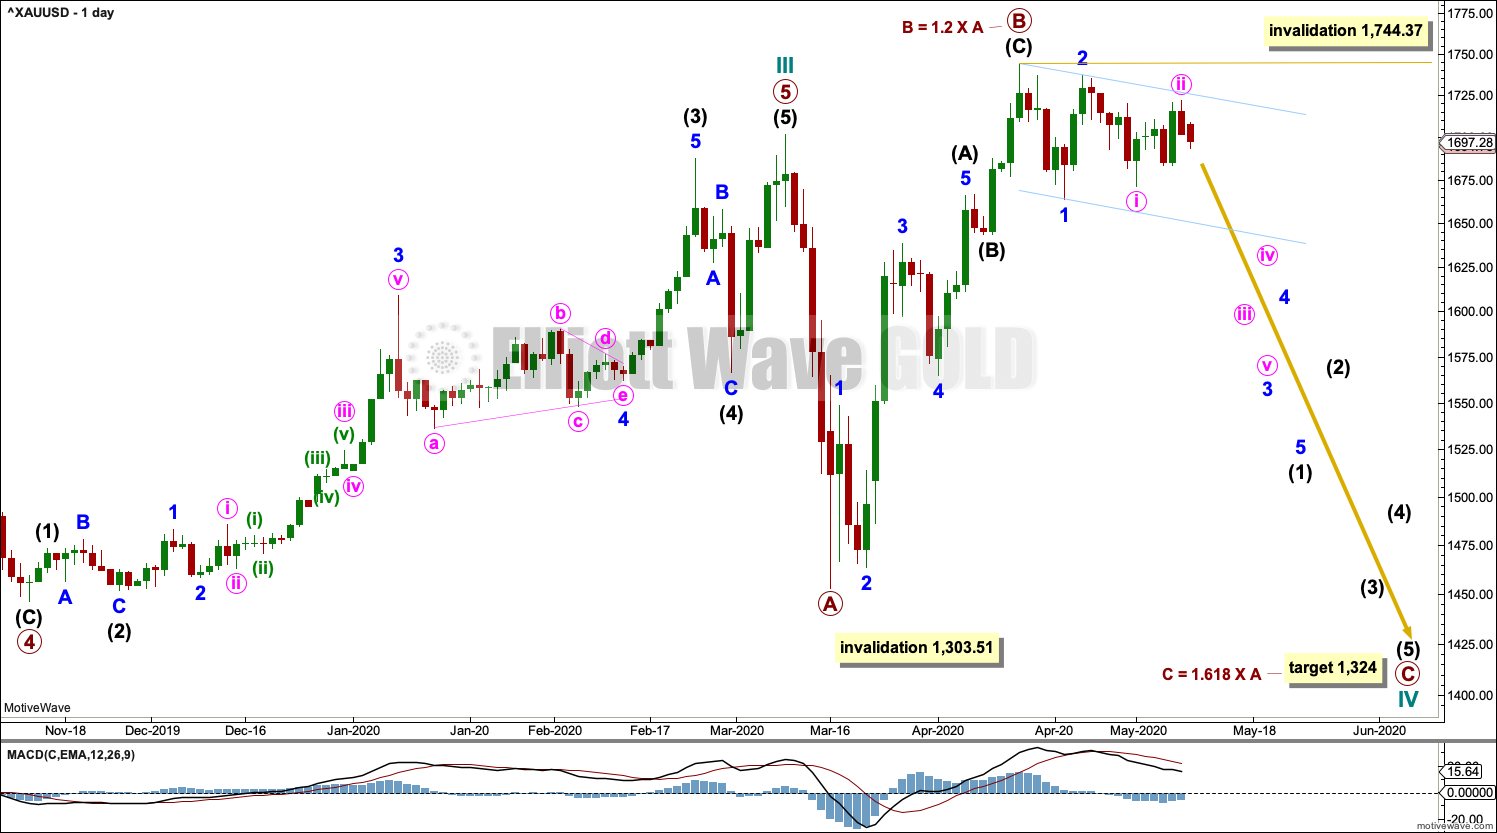
The daily chart focusses on the structure of cycle wave y. It is possible that primary wave C may be over.
No second wave correction within a new downwards trend may move beyond its start above 1,744.37.
A new low now below 1,683.39 would add some confidence to this wave count. A new low below 1,453.26 would add substantial confidence to this wave count. At that stage, the alternate below would be invalidated.
Draw a base channel about the start of downwards movement as shown in light blue. Copy this channel over to the hourly chart.
FIRST HOURLY CHART
Click chart to enlarge.
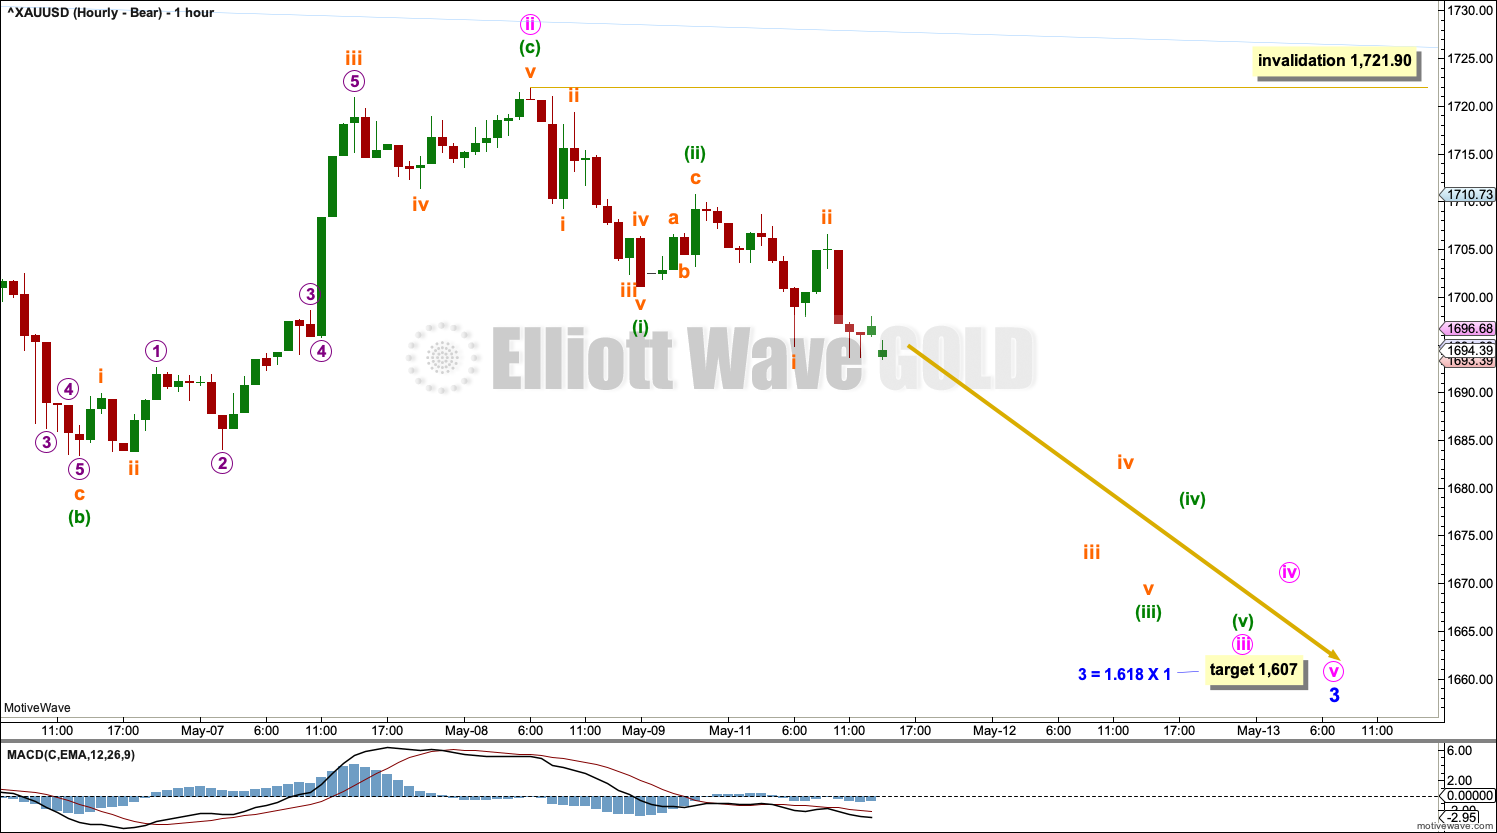
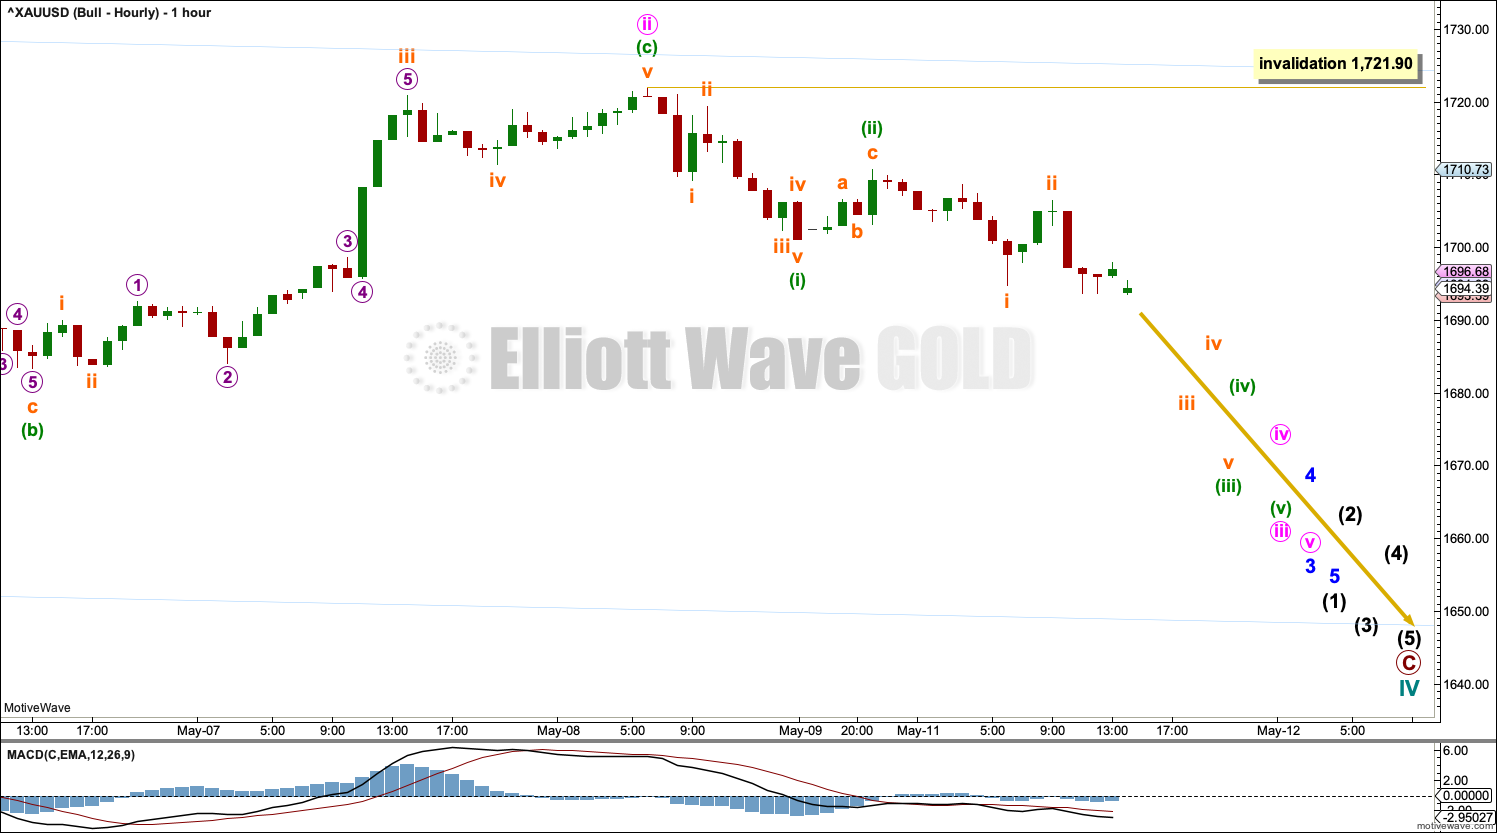
A target is calculated for minor wave 3.
Minor wave 3 may only subdivide as an impulse. Minute wave ii within minor wave 3 may now be complete, ending just short of resistance at upper edge of the base channel.
No second wave correction within minute wave iii may move beyond the start of its first wave above 1,721.90.
SECOND DAILY CHART
Click chart to enlarge.
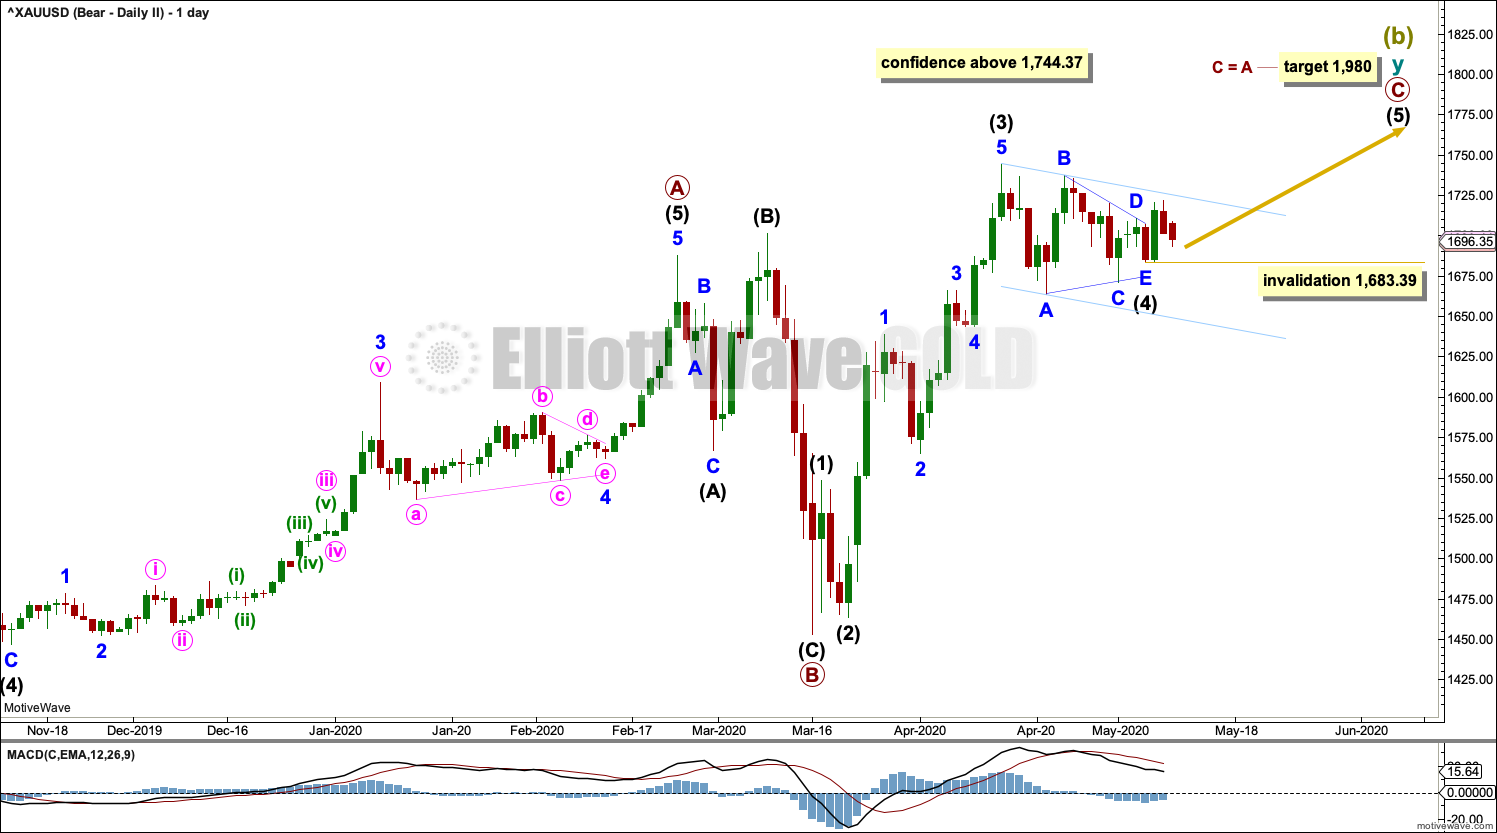
This wave count follows the alternate monthly bearish wave count published in last monthly analysis, which is linked to at the beginning of this analysis.
This wave count looks at the possibility that Grand Super Cycle wave (II) may be a flat correction, which would require Super Cycle wave (b) within it to retrace a minimum 0.9 length of Super Cycle wave (a) at 1,832.79. Super Cycle wave (b) may make a new high above the start of Super Cycle wave (a) at 1,920.18 as in an expanded flat.
Primary wave C may be an incomplete five wave impulse. Intermediate waves (1) through to (4) within primary wave C may be complete. Intermediate wave (4) may have completed as a regular contracting triangle.
This wave count should only be used if price makes a new short-term high above 1,744.37. At that stage, it would increase in probability.
SECOND HOURLY CHART

Click chart to enlarge.
Following a triangle for intermediate wave (4), intermediate wave (5) may have begun.
Minor wave 2 within intermediate wave (5) may not move beyond the start of minor wave 1 below 1,683.39.
ALTERNATE BULLISH ELLIOTT WAVE COUNT
WEEKLY CHART
Click chart to enlarge.
This wave count sees the the bear market complete at the last major low for Gold on 3 December 2015.
If Gold is in a new bull market, then it should begin with a five wave structure upwards on the weekly chart.
Cycle wave I fits as a five wave impulse with reasonably proportionate corrections for primary waves 2 and 4.
Cycle wave II fits as a double flat. However, within the first flat correction labelled primary wave W, this wave count needs to ignore what looks like an obvious triangle from July to September 2016 (this can be seen labelled as a triangle on the bear wave count above). This movement must be labelled as a series of overlapping first and second waves.
Within the first flat correction labelled primary wave W of the double flat of cycle wave II, intermediate wave (B) is 1.69 the length of intermediate wave (A). This is longer than the common range of up to 1.38, but within an allowable guideline of up to 2. The length of intermediate wave (B) reduces the probability of this wave count.
Cycle wave III may be complete. Cycle wave IV may not move into cycle wave I price territory below 1,303.51.
FIRST DAILY CHART
Click chart to enlarge.
Cycle wave III may be complete. Cycle wave IV may not move into cycle wave I price territory below 1,303.51.
Cycle wave II was relatively deep at 0.55 of cycle wave I. If cycle wave IV exhibits alternation in depth, it may more likely be shallow.
Cycle wave IV may subdivide as a flat correction, triangle or combination. Both a flat and triangle would still provide structural alternation with the combination of cycle wave II.
If cycle wave IV subdivides as a flat correction, then within it the common range for primary wave B within a flat would be from 1 to 1.38 times the length of primary wave A. If primary wave B is now over, then it is within this most common range.
If cycle wave IV subdivides as a triangle, then within it primary wave B may make a new high above the start of primary wave A as in a running triangle.
Primary wave B may be a complete zigzag.
There is no upper invalidation point for this wave count. It is possible that primary wave B may continue higher. If primary wave B does continue higher, then sideways movement of the last three weeks may be a triangle for intermediate wave (B).
FIRST HOURLY CHART
Click chart to enlarge.
Primary wave C downwards must subdivide as a five wave structure. Intermediate wave (1) within primary wave C may be incomplete.
Minor waves 1 and 2 within intermediate wave (1) may be complete.
Minute wave ii within minor wave 3 may now be complete, falling just short of resistance at the upper edge of the base channel.
No second wave correction within minute wave iii may move beyond the start of its first wave above 1,721.90.
SECOND DAILY CHART
Click chart to enlarge.
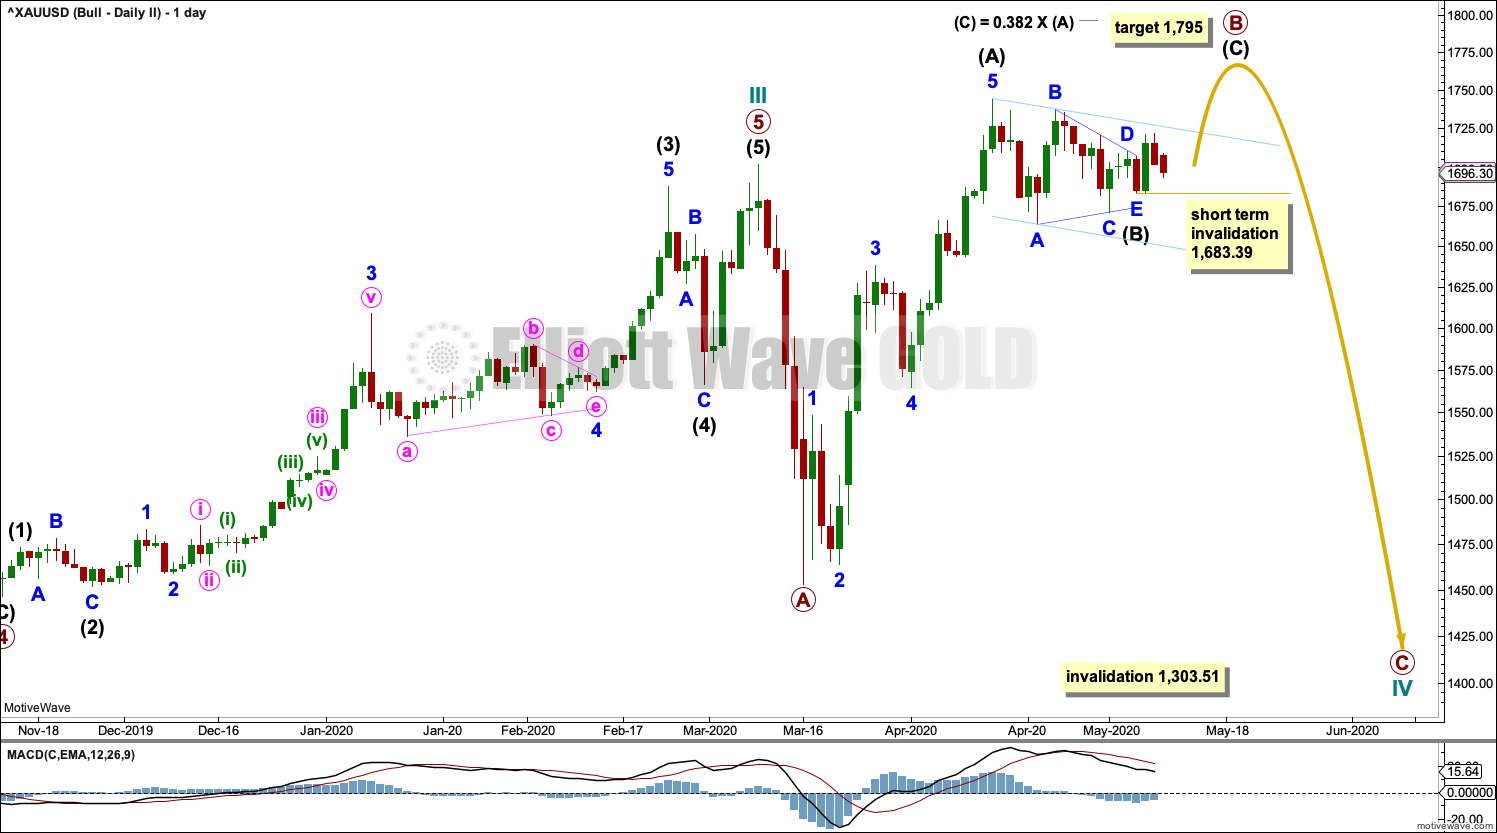
Cycle wave IV may be an incomplete expanded flat correction. Primary wave A within the flat correction may have subdivided as a zigzag. Primary wave B may now be an incomplete zigzag.
Intermediate waves (A) and (B) within primary wave B may now be complete. Intermediate wave (B) may have just completed as a regular contracting triangle. A target is calculated for intermediate wave (C) to exhibit a Fibonacci ratio to intermediate wave (A).
The normal range for primary wave B within a flat would be from 1 to 1.38 times the length of primary wave A, giving a range from 1,701.61 to 1,795.98. The target calculated would see primary wave B end right at the upper edge of this normal range.
A new low below 1,683.39 in the short term, prior to a new high above 1,744.37, would invalidate this wave count.
At the hourly chart level, this wave count would see subdivisions in the same way as the second bearish hourly wave count.
TECHNICAL ANALYSIS
WEEKLY CHART
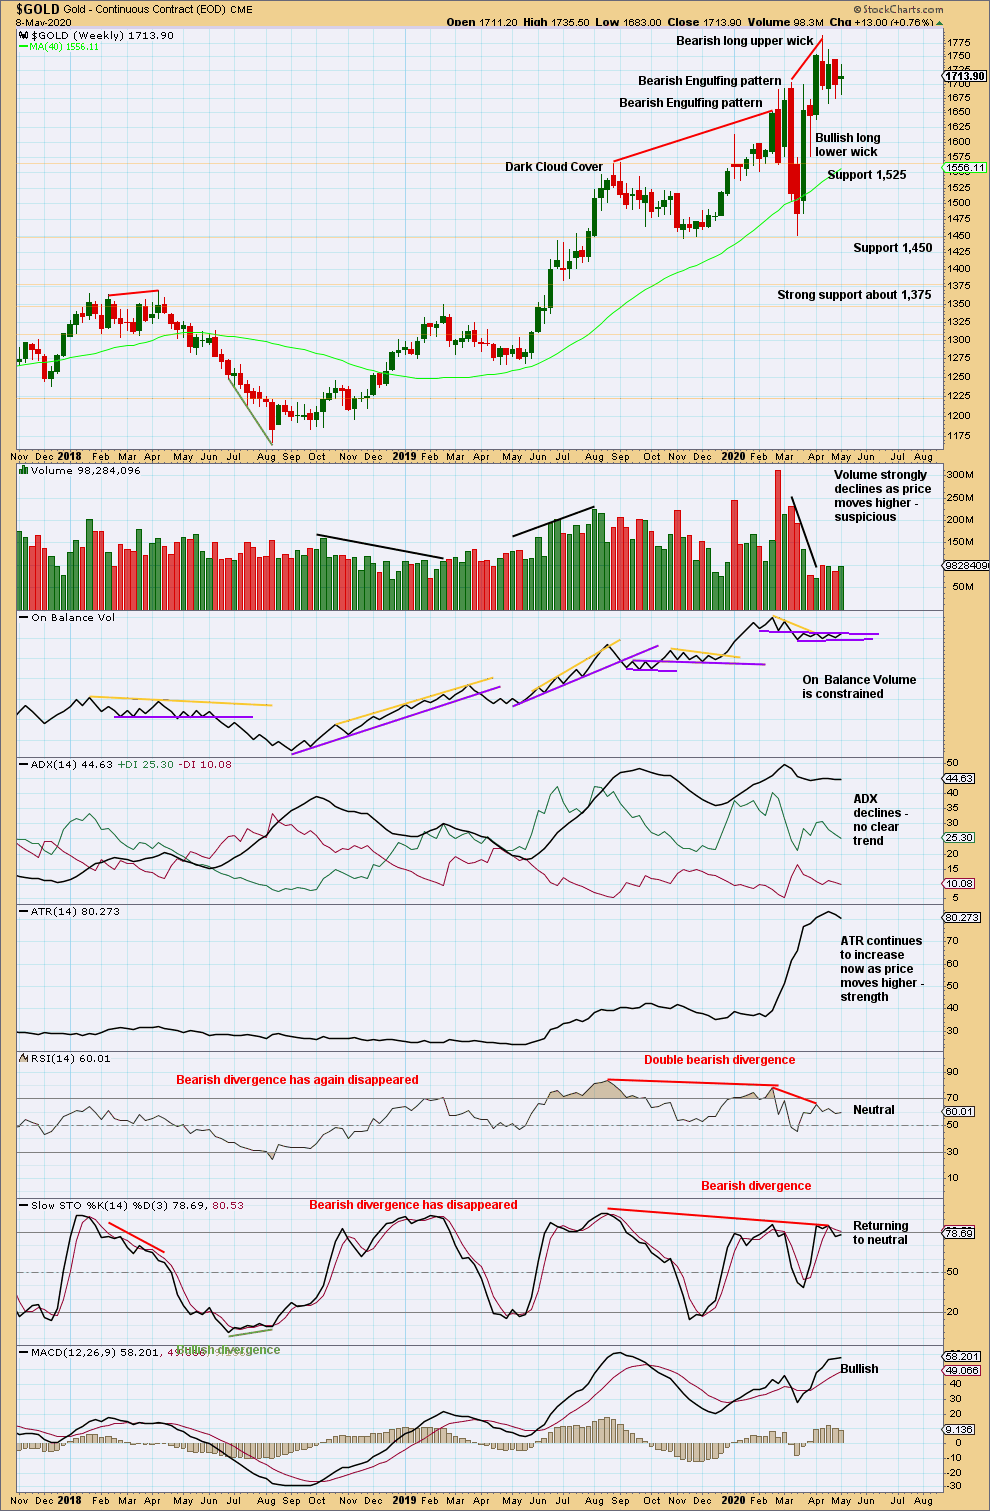
Click chart to enlarge. Chart courtesy of StockCharts.com.
Extreme bullish conditions at the last high with bearish divergence between price and RSI indicate the risk of a trend change here is high.
Another inside week with overall flat volume does not change this view.
DAILY CHART
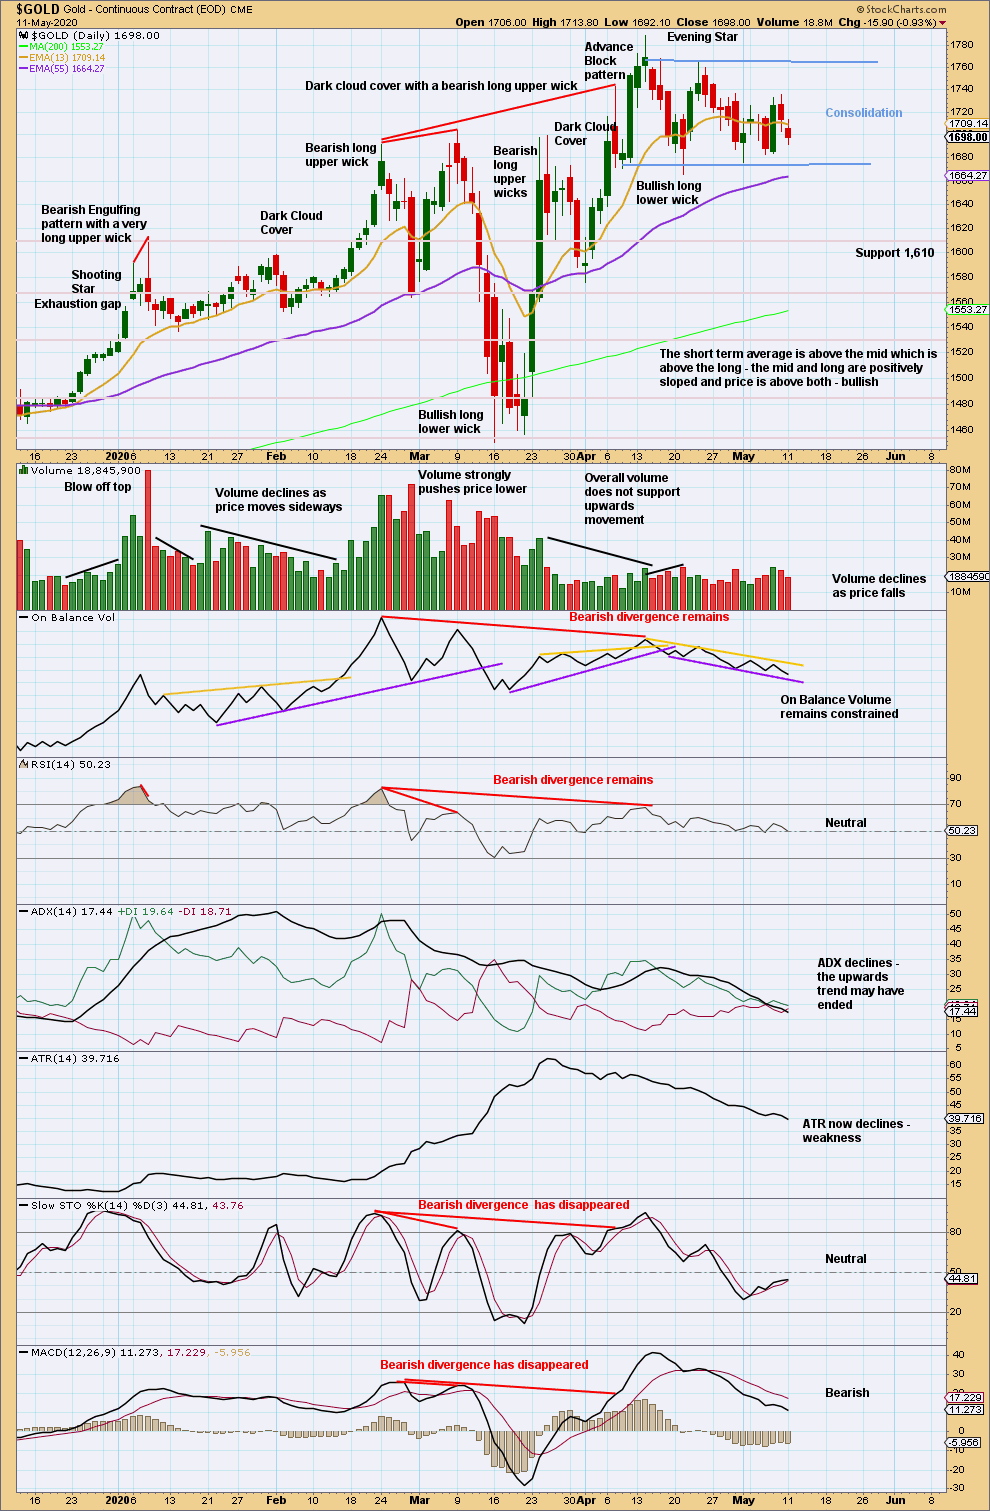
Click chart to enlarge. Chart courtesy of StockCharts.com.
Sideways movement of the last three weeks has bought conditions down from extreme. There is again room for price to rise, but there is also room for price to fall.
Price is consolidating with resistance about 1,768 and support about 1,675. A breakout would be required for confidence in the next direction for price.
When looking for a breakout from a consolidation zone, an upwards breakout requires support from volume for confidence. A downwards breakout does not, but more confidence in the breakout may be had if volume supports it.
GDX WEEKLY CHART
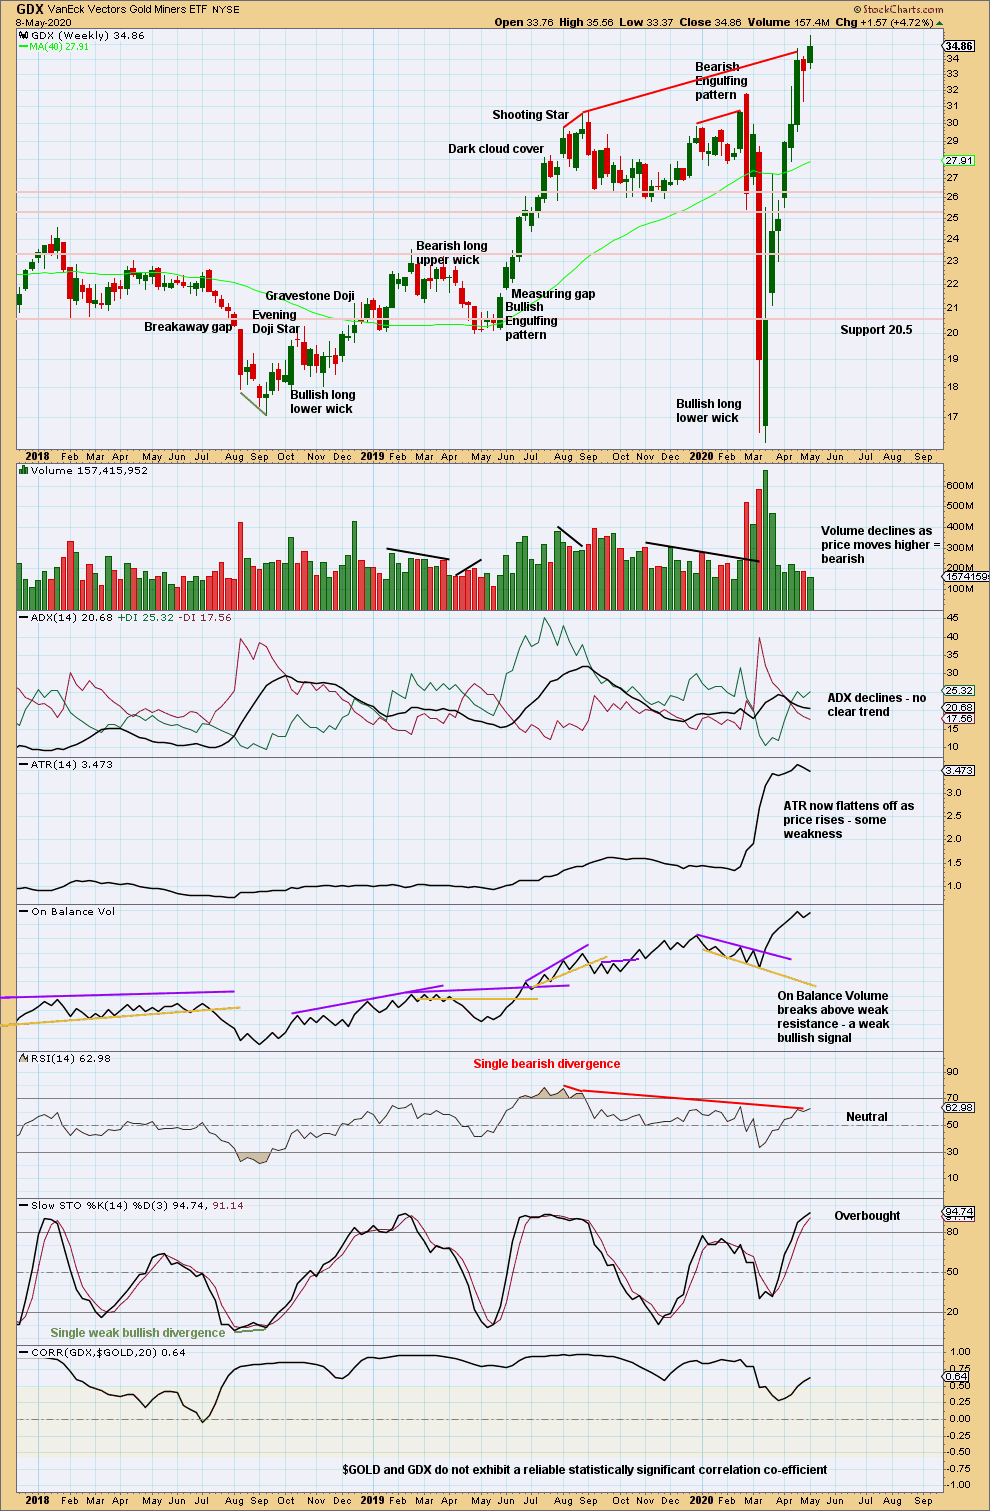
Click chart to enlarge. Chart courtesy of StockCharts.com.
The Hanging Man has not been followed by downwards movement, so it is not confirmed. However, upwards movement may be viewed with suspicion as it has declining range and lacks support from volume.
GDX DAILY CHART
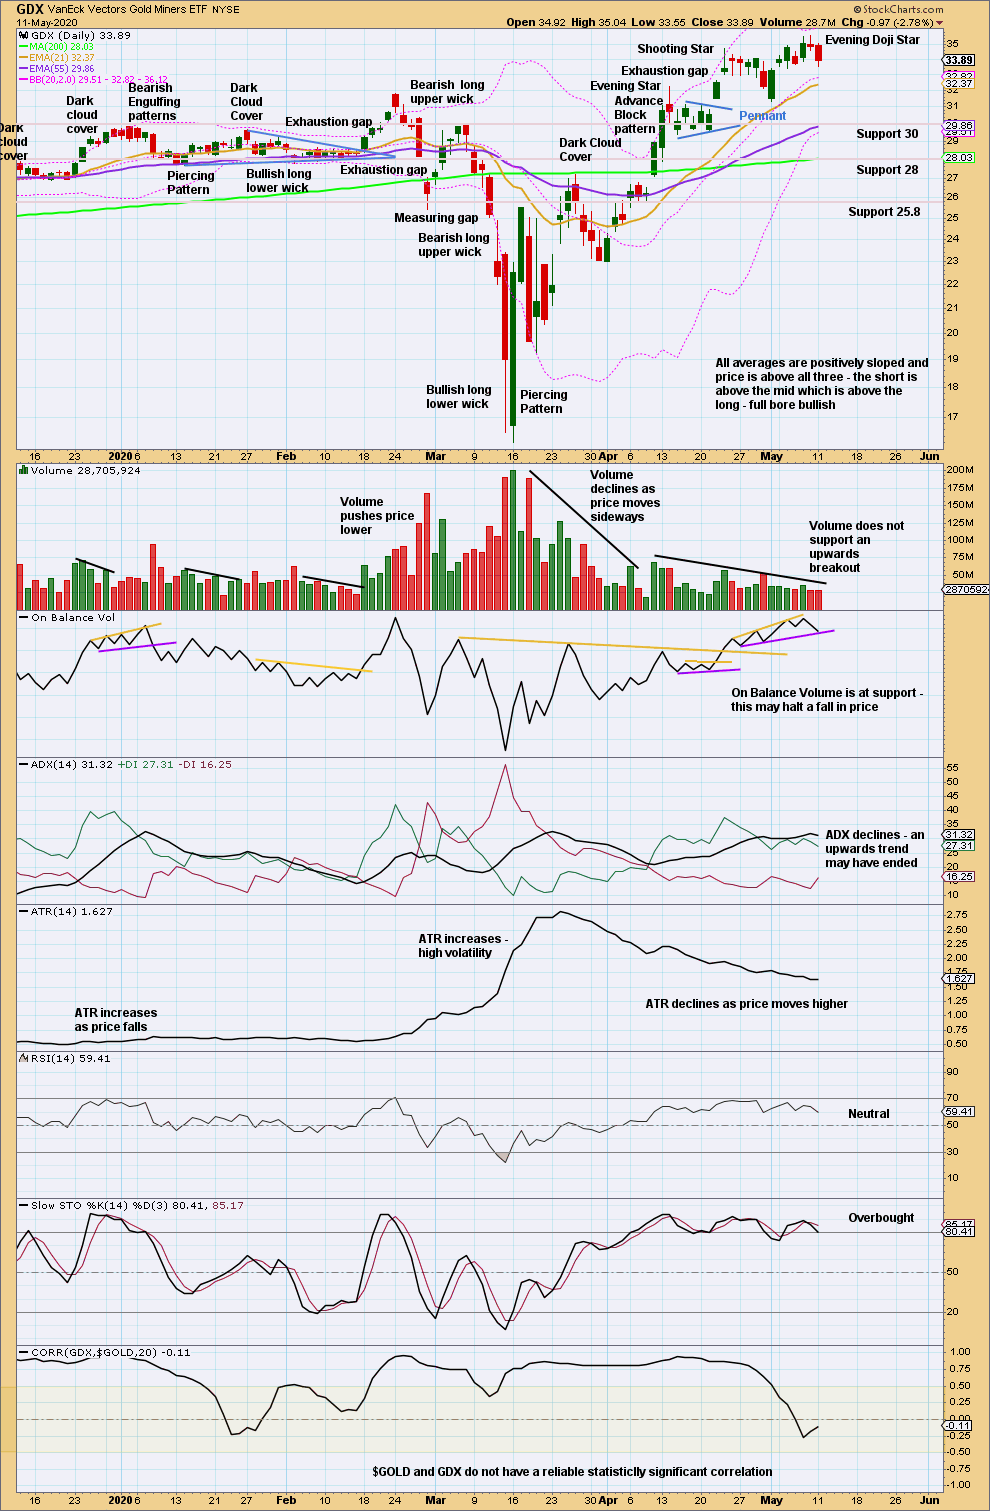
Click chart to enlarge. Chart courtesy of StockCharts.com.
A close above a prior small resistance zone does not have support from volume. ADX is extreme (the AD line is above both DX lines). Stochastics is overbought. Upwards movement here may be limited.
A bearish reversal pattern today in an Evening Doji Star suggests a trend change here to either down or sideways.
Published @ 07:29 p.m. EST.
—
Careful risk management protects your trading account(s).
Follow my two Golden Rules:
1. Always trade with stops.
2. Risk only 1-5% of equity on any one trade.
—
New updates to this analysis are in bold.