
GOLD: Elliott Wave and Technical Analysis | Charts – May 19, 2020
A small range downwards day closes green. Price remains above the short-term invalidation point and all Elliott wave counts remain valid.
Summary: The target is at 1,980. This target is valid only while price remains above 1,693.39.
If price breaks below 1,693.39, then expect continuing downwards movement to at least 1,362.
Grand SuperCycle analysis is here.
Monthly charts were last updated here.
MAIN BEARISH ELLIOTT WAVE COUNT
WEEKLY CHART
Click chart to enlarge.
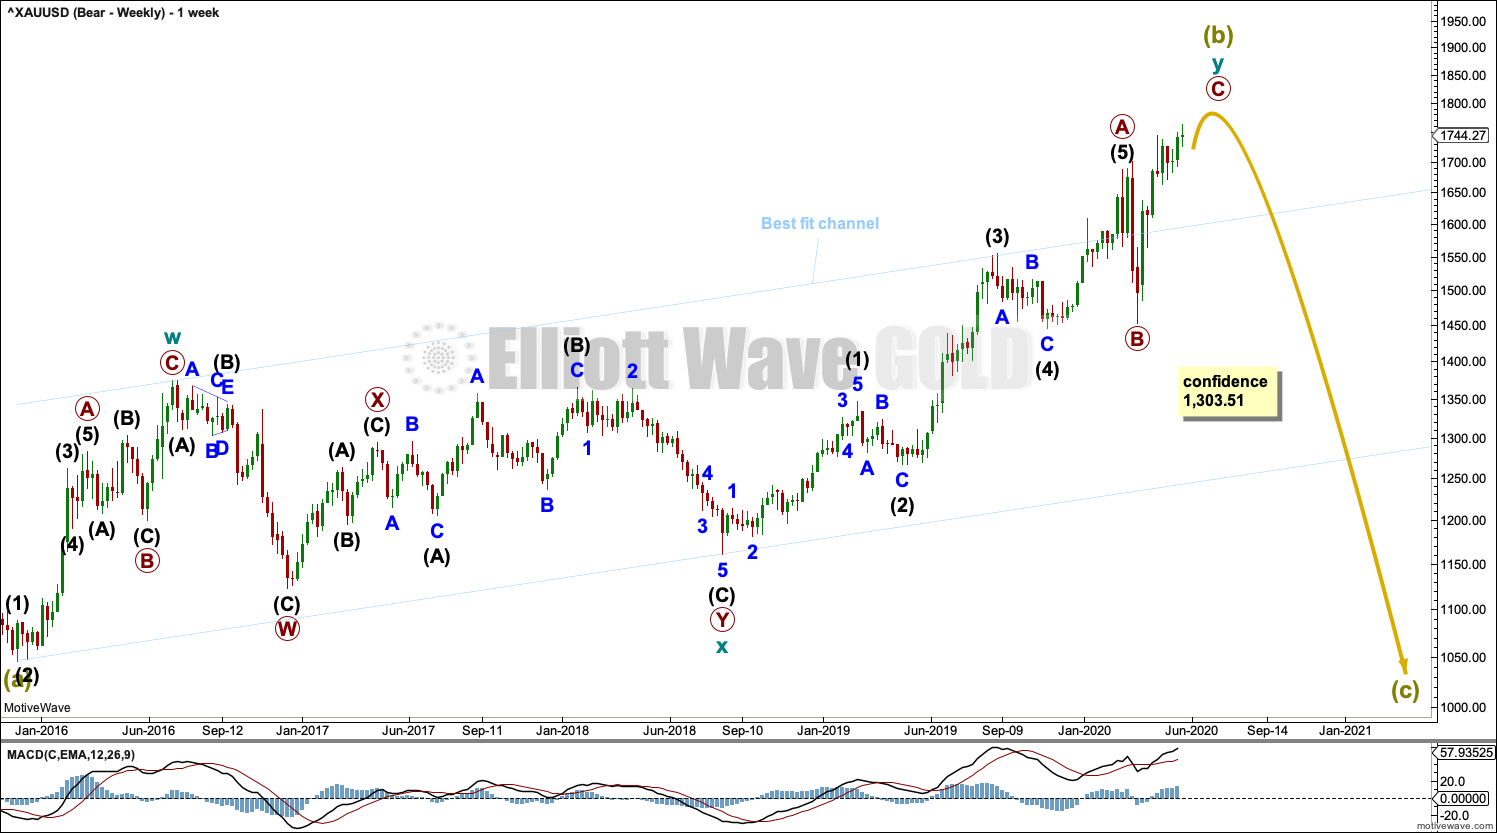
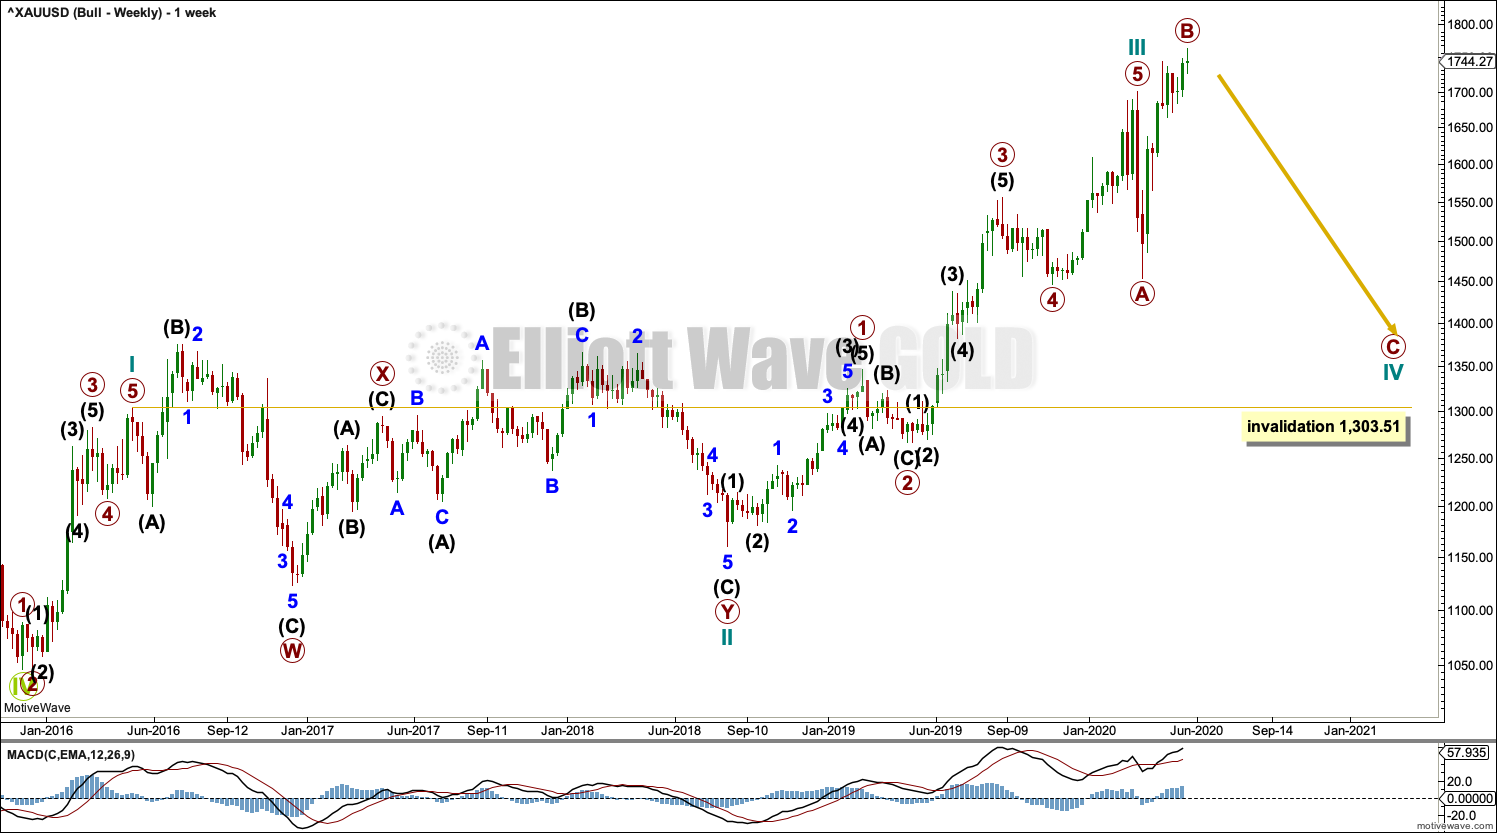
Super Cycle wave (b) may be an incomplete double zigzag.
The first zigzag in the double is labelled cycle wave w. The double is joined by a three in the opposite direction, a combination labelled cycle wave x. The second zigzag in the double is labelled cycle wave y.
The purpose of the second zigzag in a double is to deepen the correction. Cycle wave y has achieved this purpose.
DAILY CHART
Click chart to enlarge.
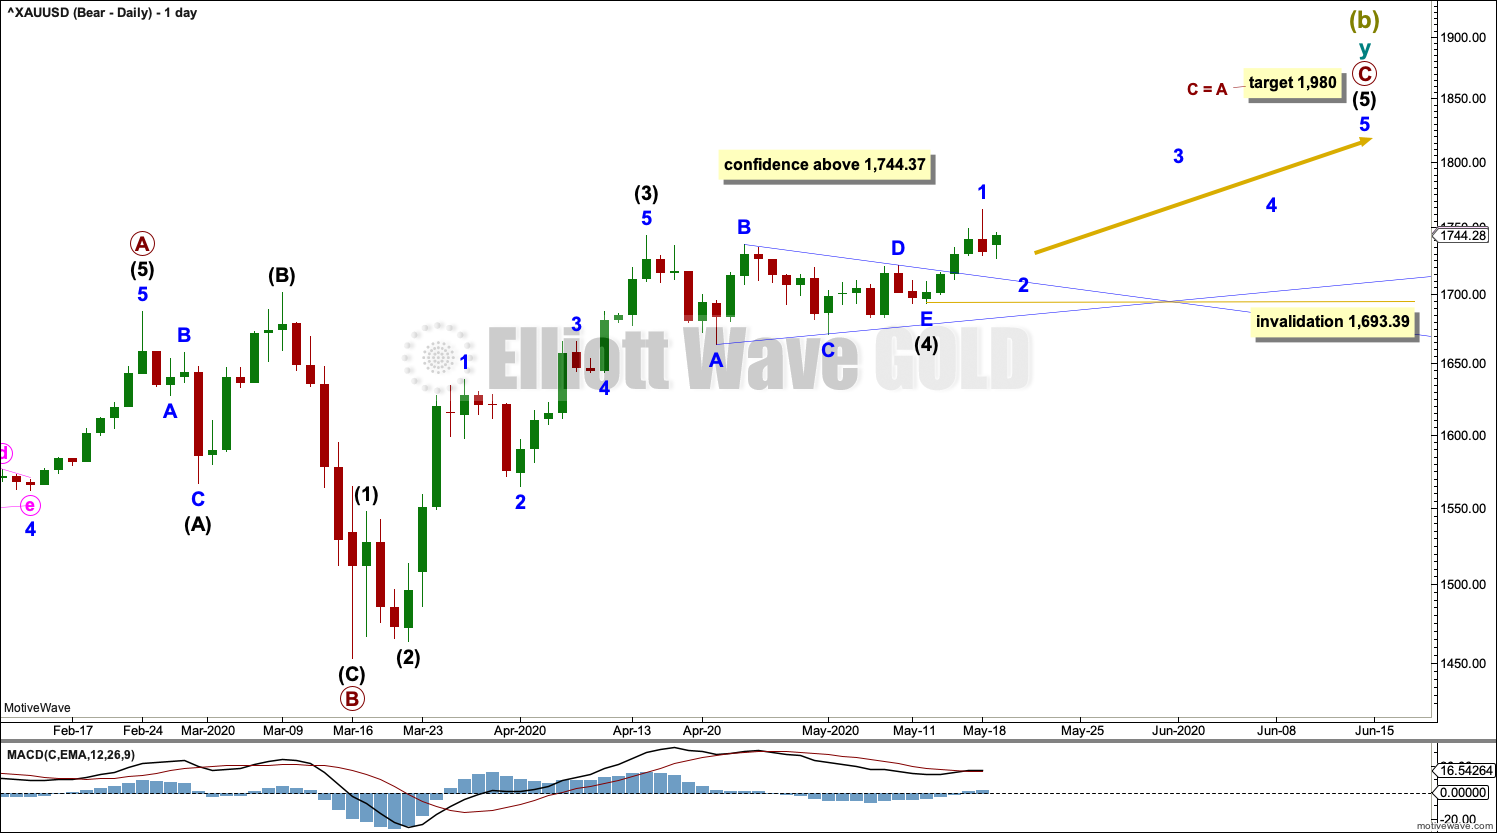
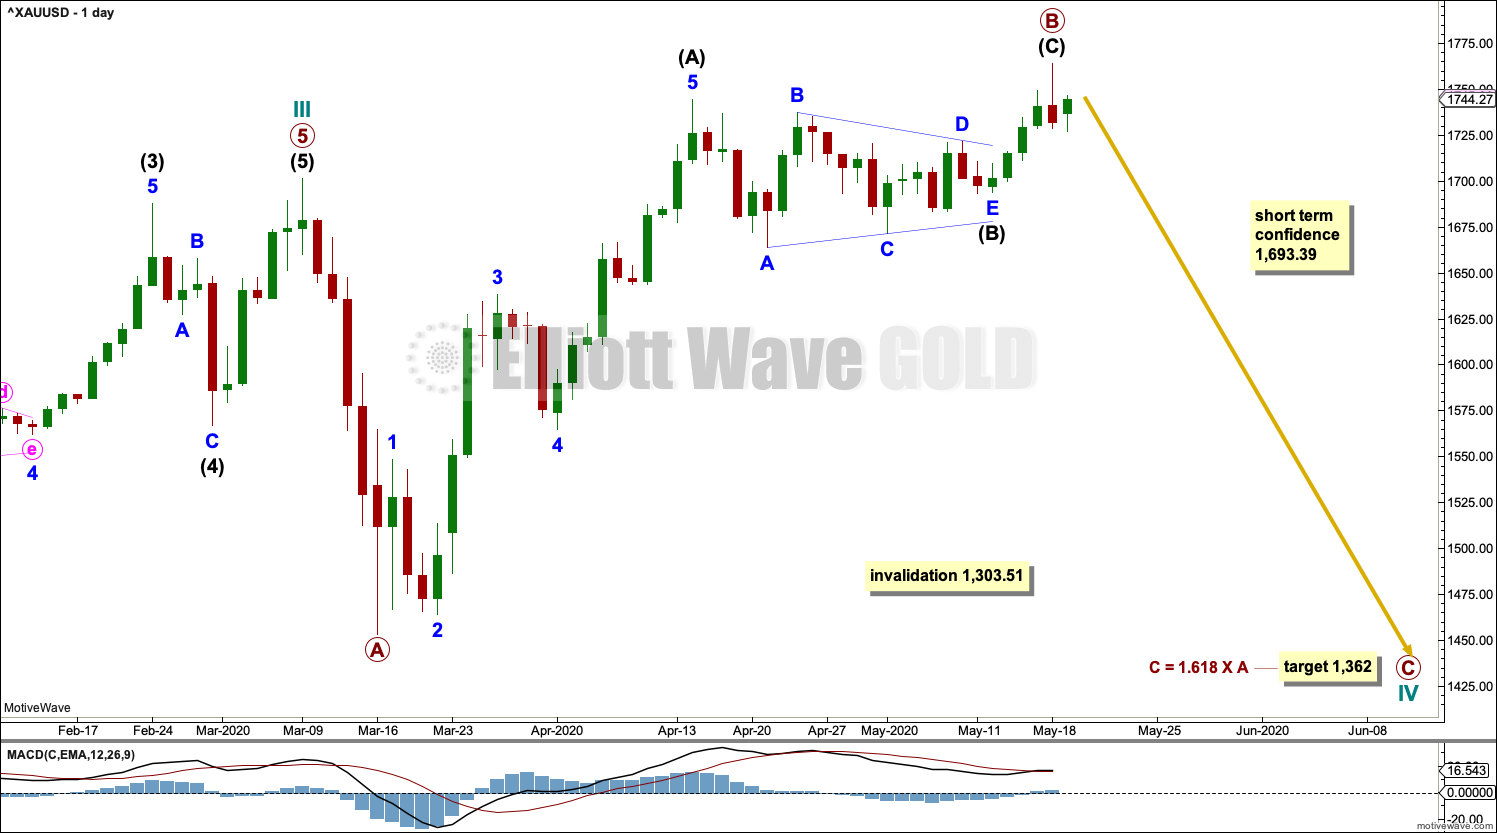
Primary wave C may be an incomplete five wave impulse. Intermediate waves (1) through to (3) within primary wave C may be complete. Intermediate wave (4) may be a regular contracting triangle. Minor wave E within the triangle may now be complete. No second wave correction within intermediate wave (5) may move beyond the start of its first wave below 1,693.39.
The point in time at which an Elliott wave triangles trend lines cross over is sometimes when a trend change occurs. Extend the triangle trend lines from intermediate wave (4) outwards. A trend change may occur on this date to either down or sideways.
HOURLY CHART
Click chart to enlarge.
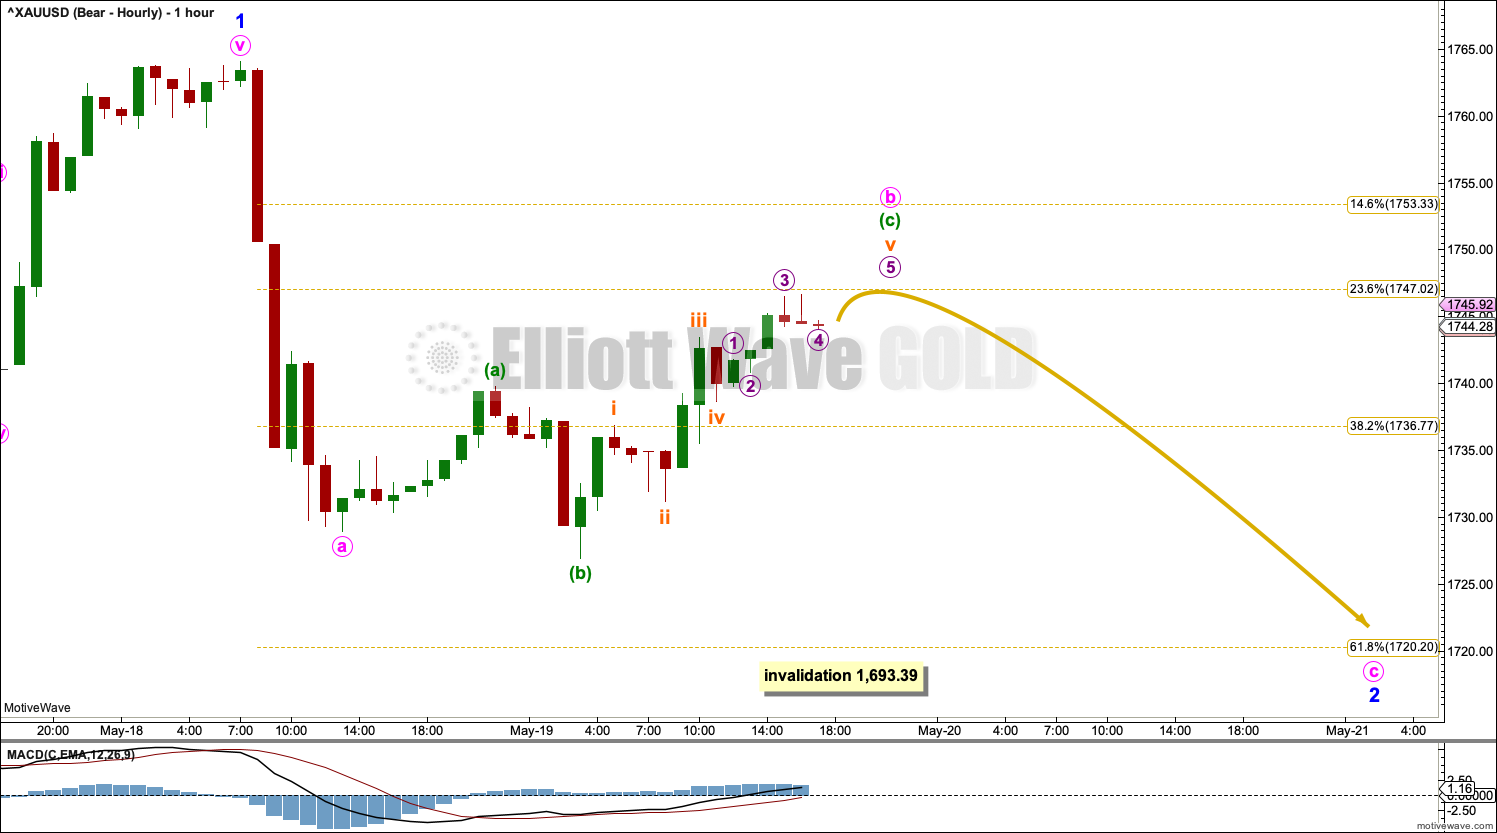
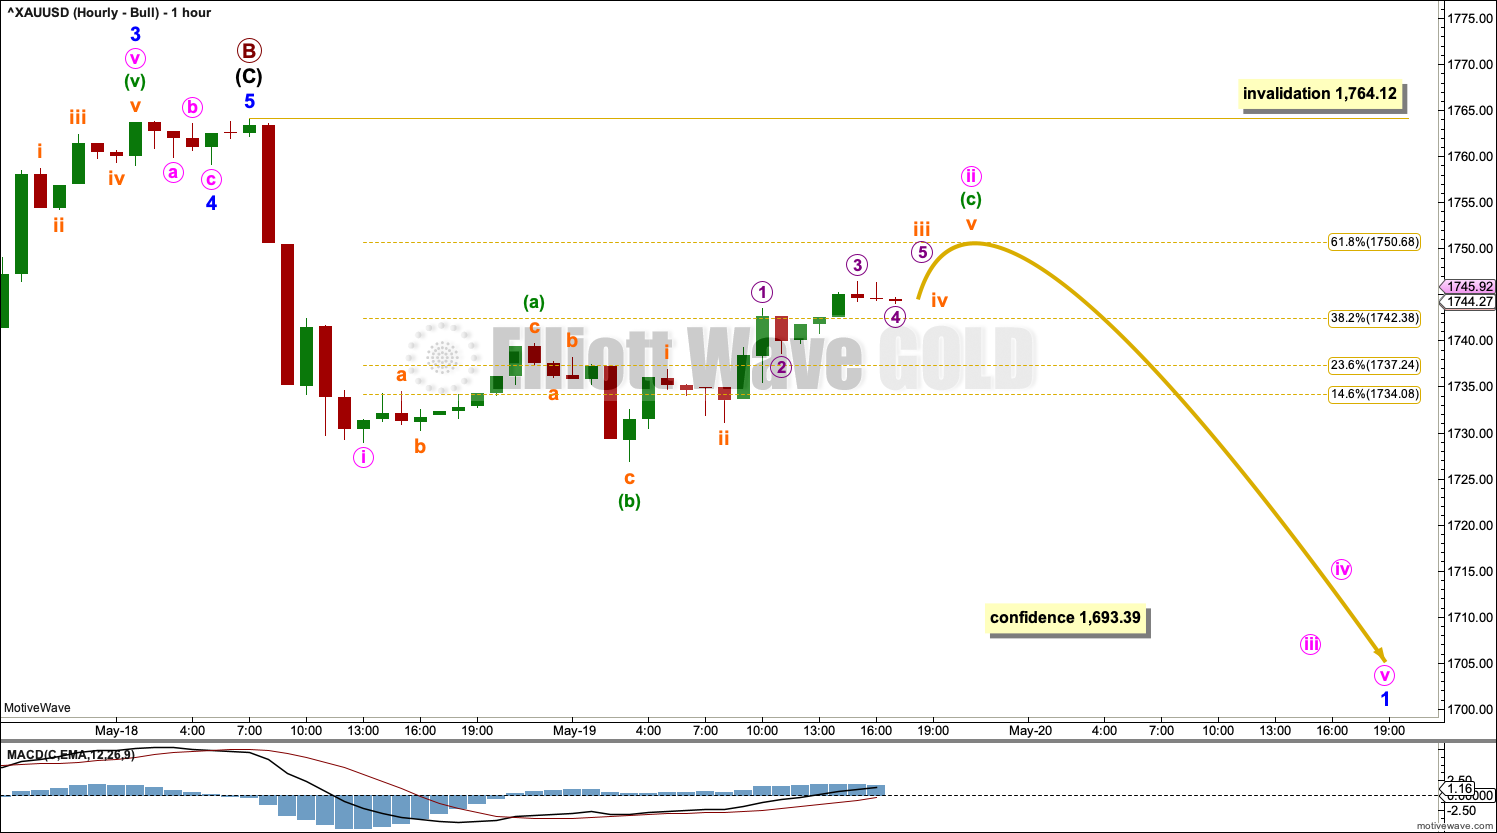
Intermediate wave (5) must subdivide as a five wave motive structure, either an impulse or an ending diagonal. An impulse is much more likely, so that shall be what is expected until and unless overlapping suggests a diagonal.
Minor wave 1 within intermediate wave (5) may be complete.
Minor wave 2 may be about half way through. It would most likely subdivide as a zigzag and most likely end about the 0.618 Fibonacci ratio of minor wave 2. Minor wave 2 may end in another one to very few sessions.
Minor wave 2 may not move beyond the start of minor wave 1 below 1,693.39.
ALTERNATE HOURLY CHART
Click chart to enlarge.
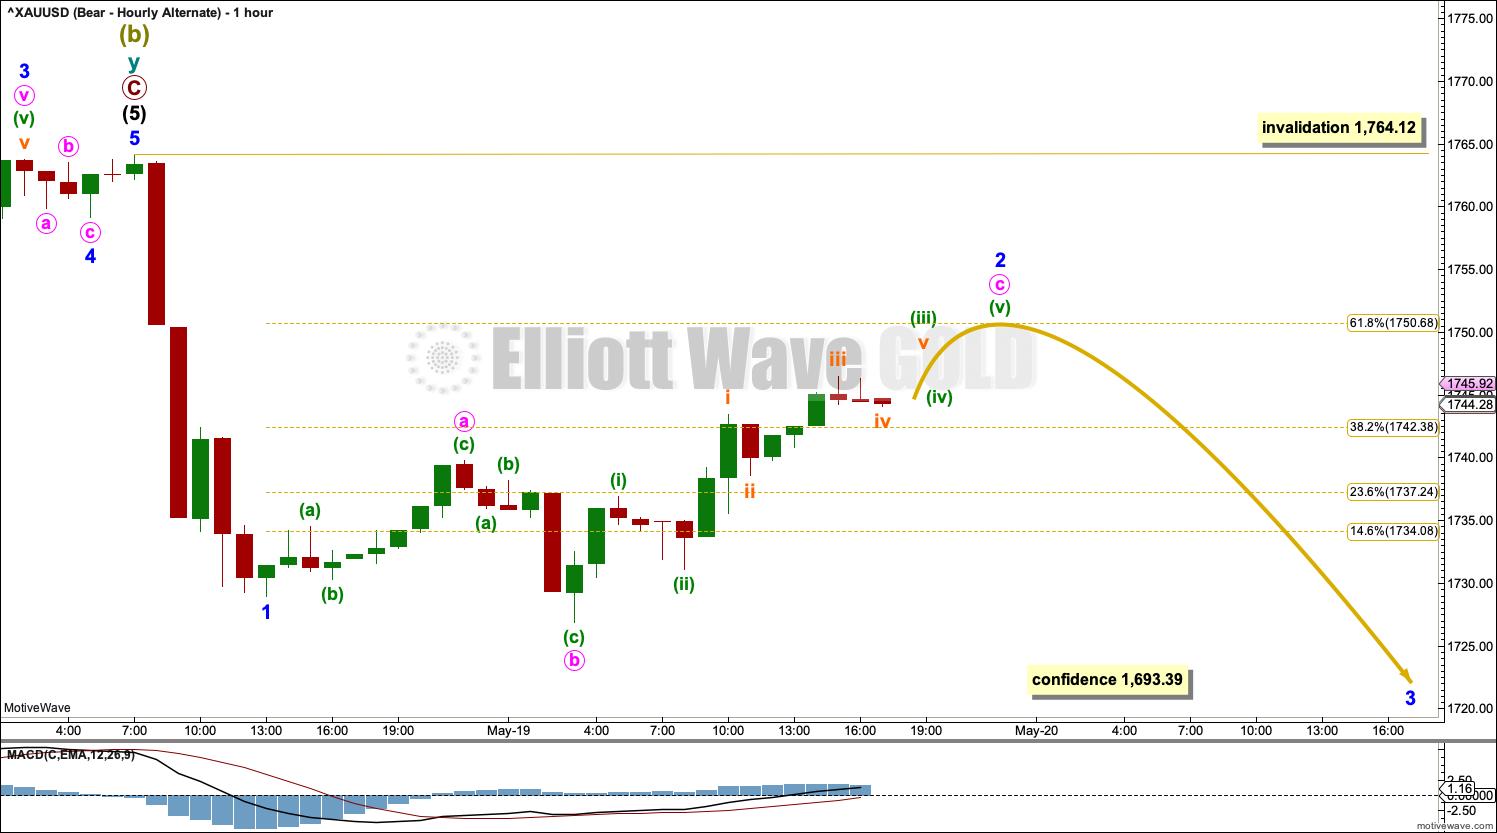
It is again possible that Super Cycle wave (b) may be complete. This wave count requires a new low below 1,693.39 for initial confidence. Further downwards movement and a new low below 1,453.26 would add substantial confidence.
This wave count labels subdivisions in upwards movement in the same way, except it moves the degree of labelling within intermediate wave (5) all up one degree.
Minor wave 2 may not move beyond the start of minor wave 1 above 1,764.12.
ALTERNATE BULLISH ELLIOTT WAVE COUNT
WEEKLY CHART
Click chart to enlarge.
This wave count sees the the bear market complete at the last major low for Gold on 3 December 2015.
If Gold is in a new bull market, then it should begin with a five wave structure upwards on the weekly chart.
Cycle wave I fits as a five wave impulse with reasonably proportionate corrections for primary waves 2 and 4.
Cycle wave II fits as a double flat. However, within the first flat correction labelled primary wave W, this wave count needs to ignore what looks like an obvious triangle from July to September 2016 (this can be seen labelled as a triangle on the bear wave count above). This movement must be labelled as a series of overlapping first and second waves.
Within the first flat correction labelled primary wave W of the double flat of cycle wave II, intermediate wave (B) is 1.69 the length of intermediate wave (A). This is longer than the common range of up to 1.38, but within an allowable guideline of up to 2. The length of intermediate wave (B) reduces the probability of this wave count.
Cycle wave III may be complete. Cycle wave IV may not move into cycle wave I price territory below 1,303.51.
DAILY CHART
Click chart to enlarge.
Cycle wave IV may be an incomplete expanded flat correction. Primary wave A within the flat correction may have subdivided as a zigzag. Primary wave B may now be a complete zigzag. Primary wave B would be a 1.25 length of primary wave A. This is within the normal range for primary wave B within a flat from 1 to 1.38 times the length of primary wave A.
A target is calculated for primary wave C to end based upon the most common Fibonacci ratio to primary wave A within an expanded flat.
HOURLY CHART
Click chart to enlarge.
Intermediate wave (C) must subdivide as a five wave motive structure, either an impulse or an ending diagonal. It may be a complete impulse.
Minute wave ii within the new downwards trend may not move beyond the start of minute wave i above 1,764.12.
TECHNICAL ANALYSIS
WEEKLY CHART
Click chart to enlarge. Chart courtesy of StockCharts.com.
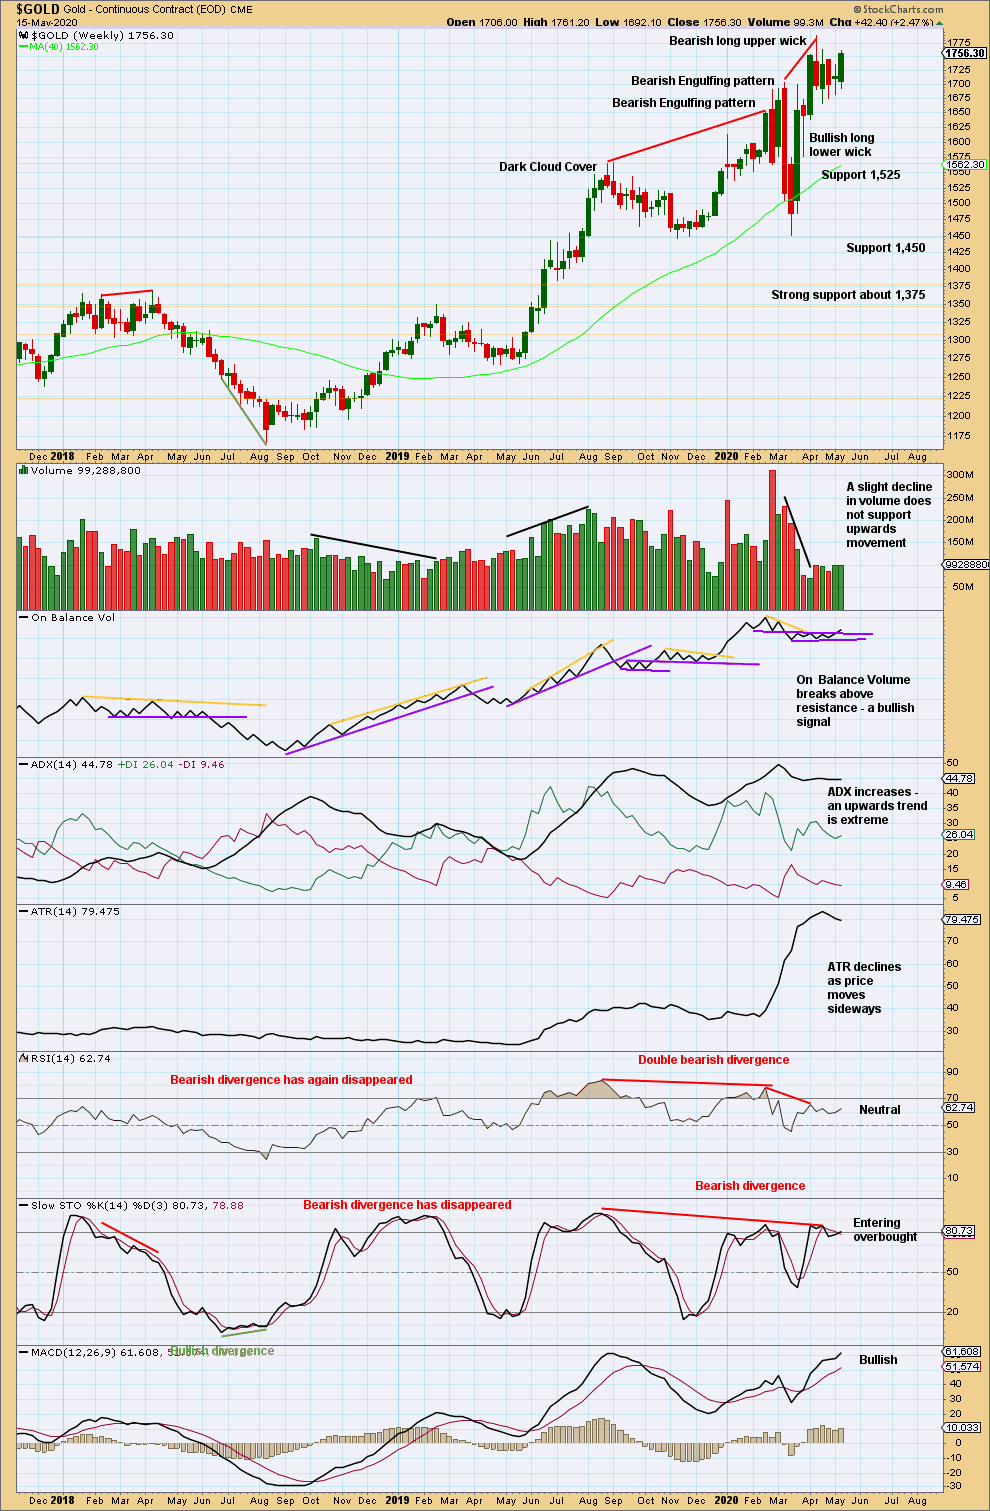
A bullish signal last week supports the Elliott wave counts. The upwards trend remains extreme.
DAILY CHART
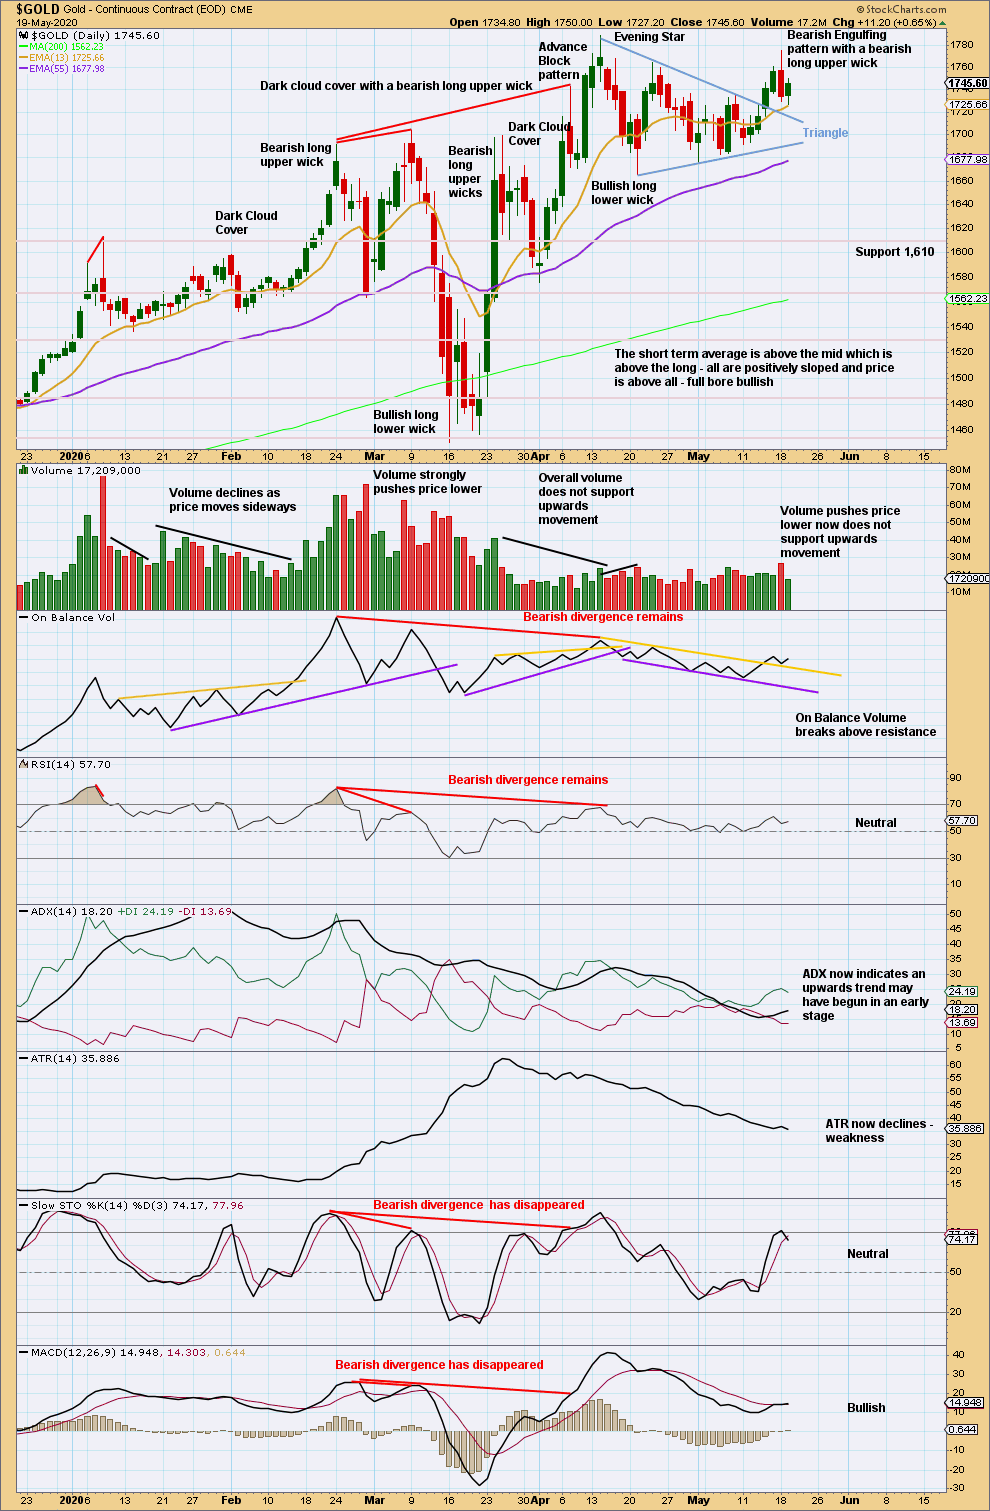
Click chart to enlarge. Chart courtesy of StockCharts.com.
Price has closed above the upper edge of a triangle pattern. A target is at 1,849. However, a lack of support from volume for upwards movement indicates this market may currently be vulnerable to pullbacks. Extra caution regarding risk management is advised at this time.
Now a strong bearish reversal pattern with support from volume increases the warning that this market is vulnerable to a trend change.
The short-term volume profile is bearish. The session for Monday was dominated by downwards movement, which had support from volume. Now the session for Tuesday is dominated by upwards movement, which lacks support from volume.
GDX WEEKLY CHART
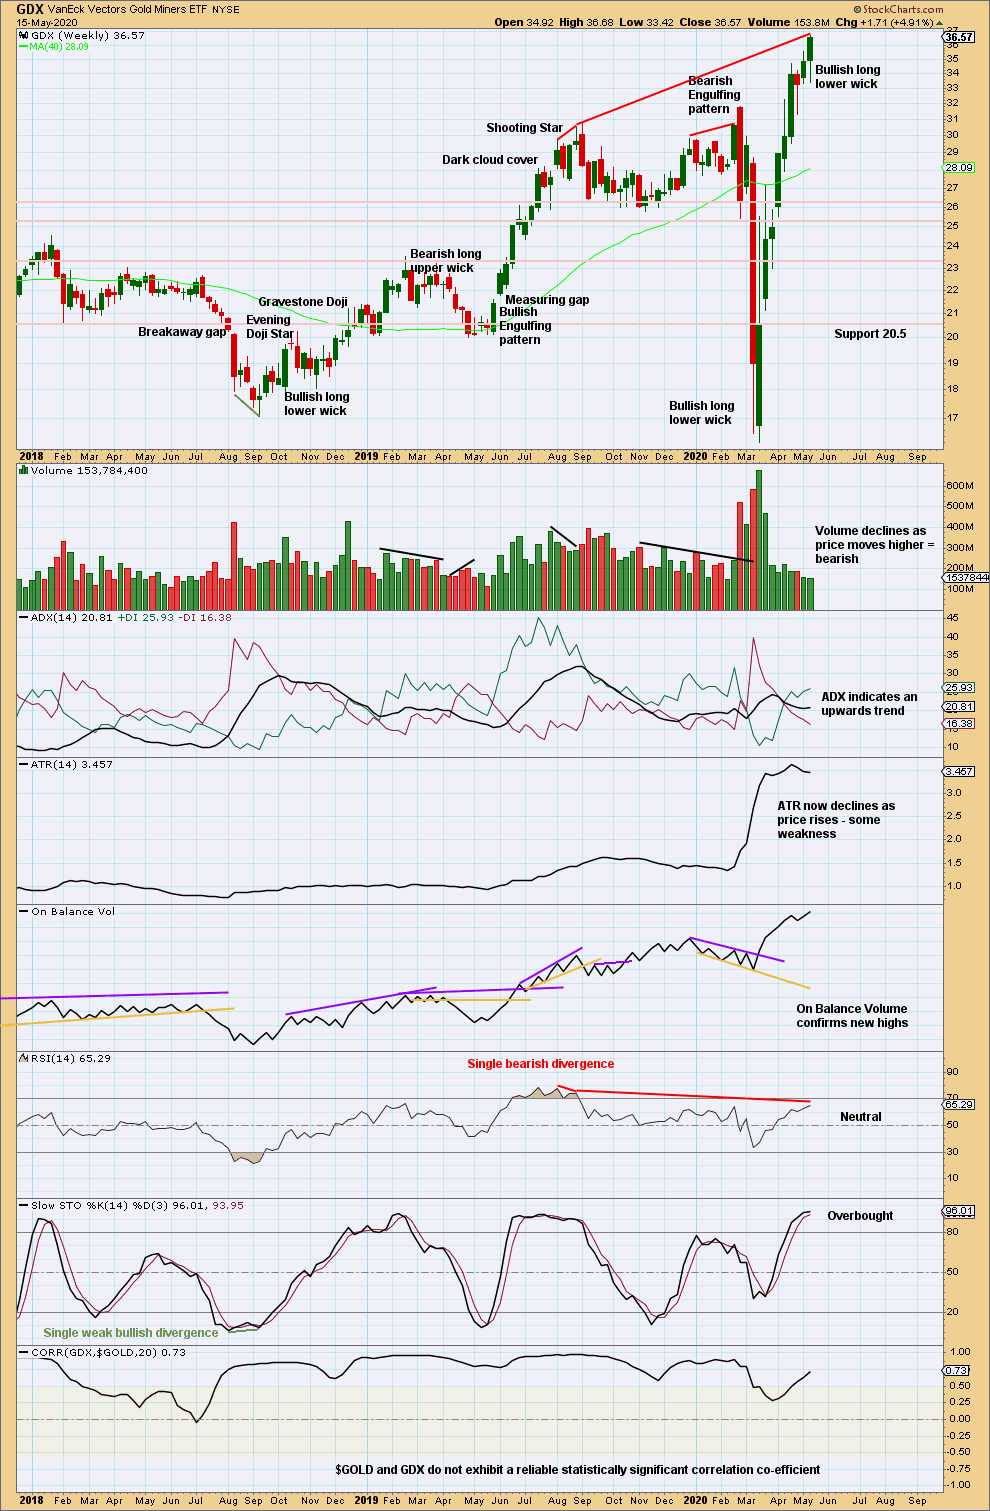
Click chart to enlarge. Chart courtesy of StockCharts.com.
A bullish long lower wick suggests more upwards movement this week. It may be limited though because volume does not support upwards movement.
GDX DAILY CHART
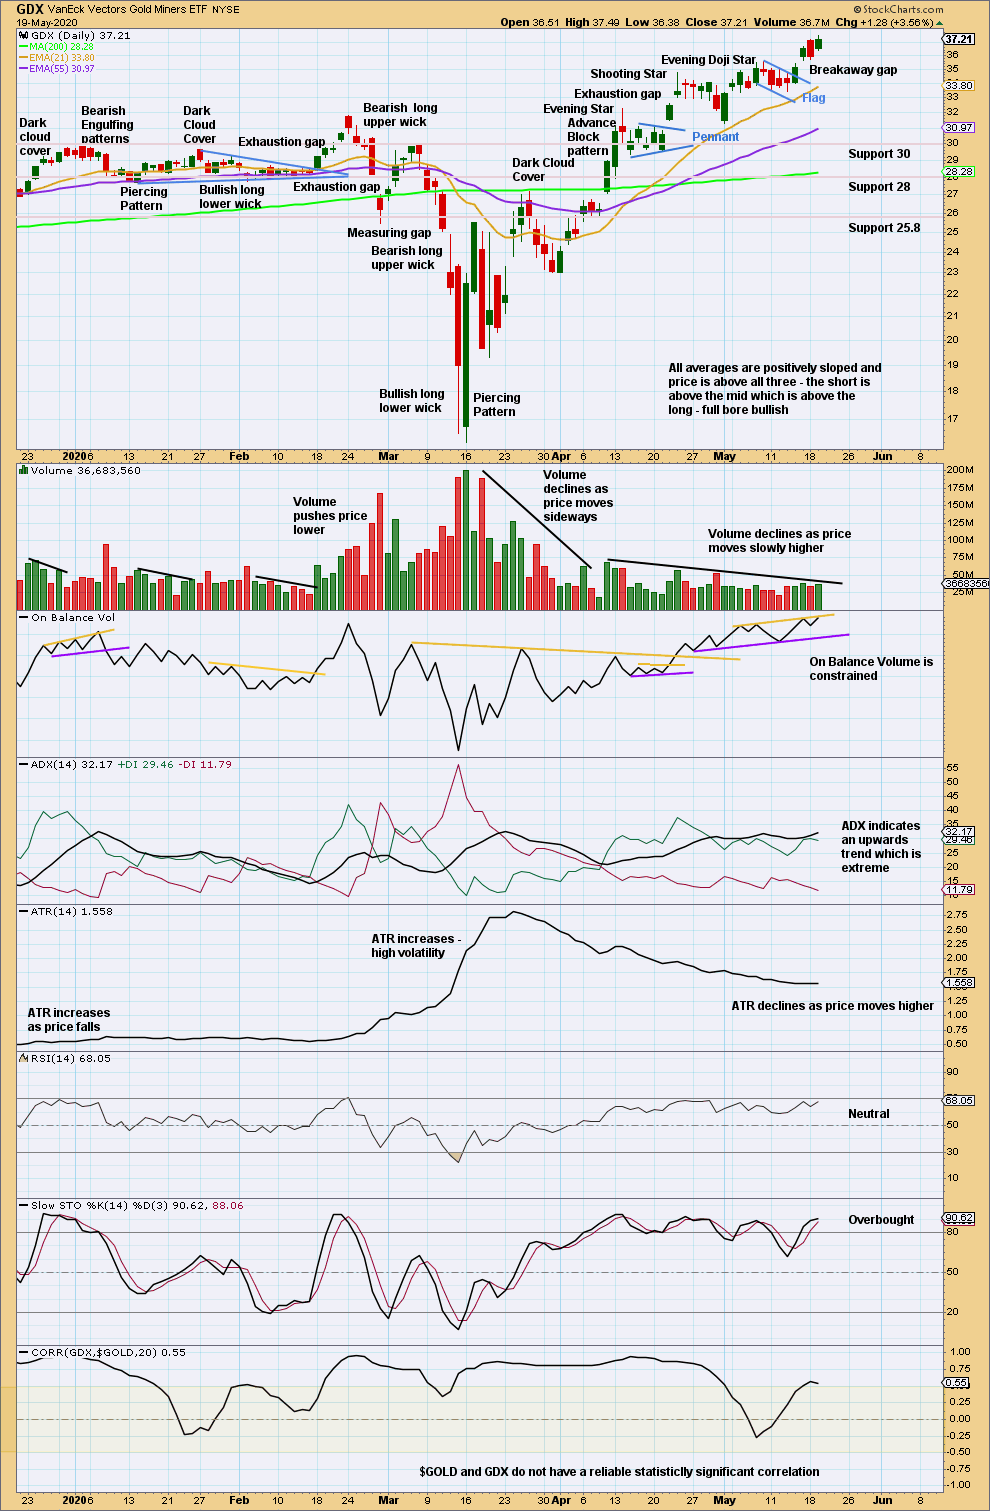
Click chart to enlarge. Chart courtesy of StockCharts.com.
A flag may have completed. A target calculated from the flag pole is at 38.92. The breakaway gap may offer support at 35.45.
A possible Bearish Engulfing pattern yesterday has now been followed by an upwards session. The bearishness of the reversal pattern is negated.
Published @ 06:45 p.m. EST.
—
Careful risk management protects your trading account(s).
Follow my two Golden Rules:
1. Always trade with stops.
2. Risk only 1-5% of equity on any one trade.
—
New updates to this analysis are in bold.