
GOLD: Elliott Wave and Technical Analysis | Charts – May 25, 2020
Summary: The target is at 1,980. This target is valid only while price remains above 1,693.39.
If price breaks below 1,693.39, then expect continuing downwards movement to at least 1,362.
Grand SuperCycle analysis is here.
Monthly charts were last updated here.
MAIN BEARISH ELLIOTT WAVE COUNT
WEEKLY CHART
Click chart to enlarge.
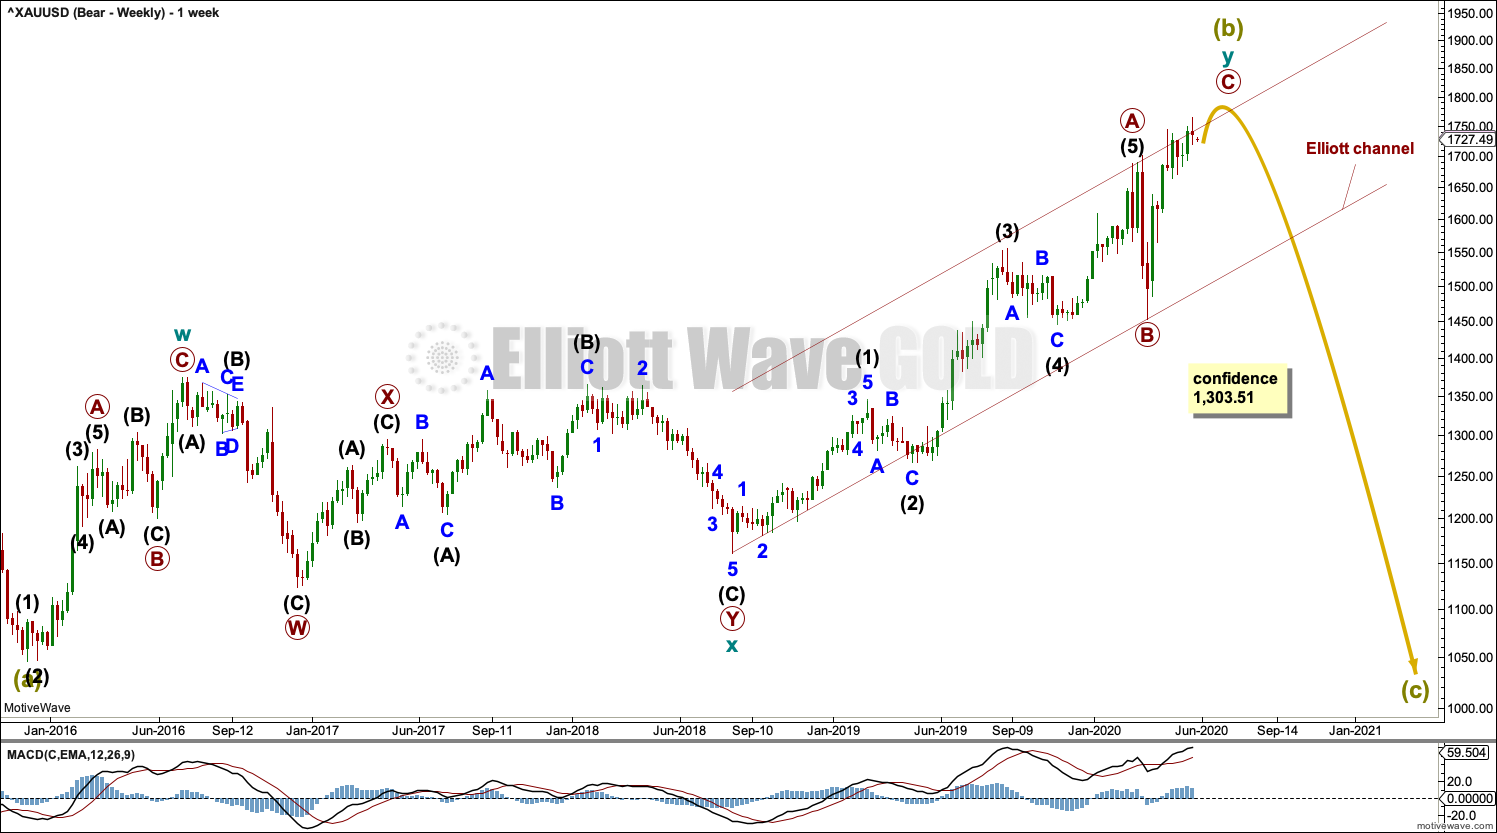
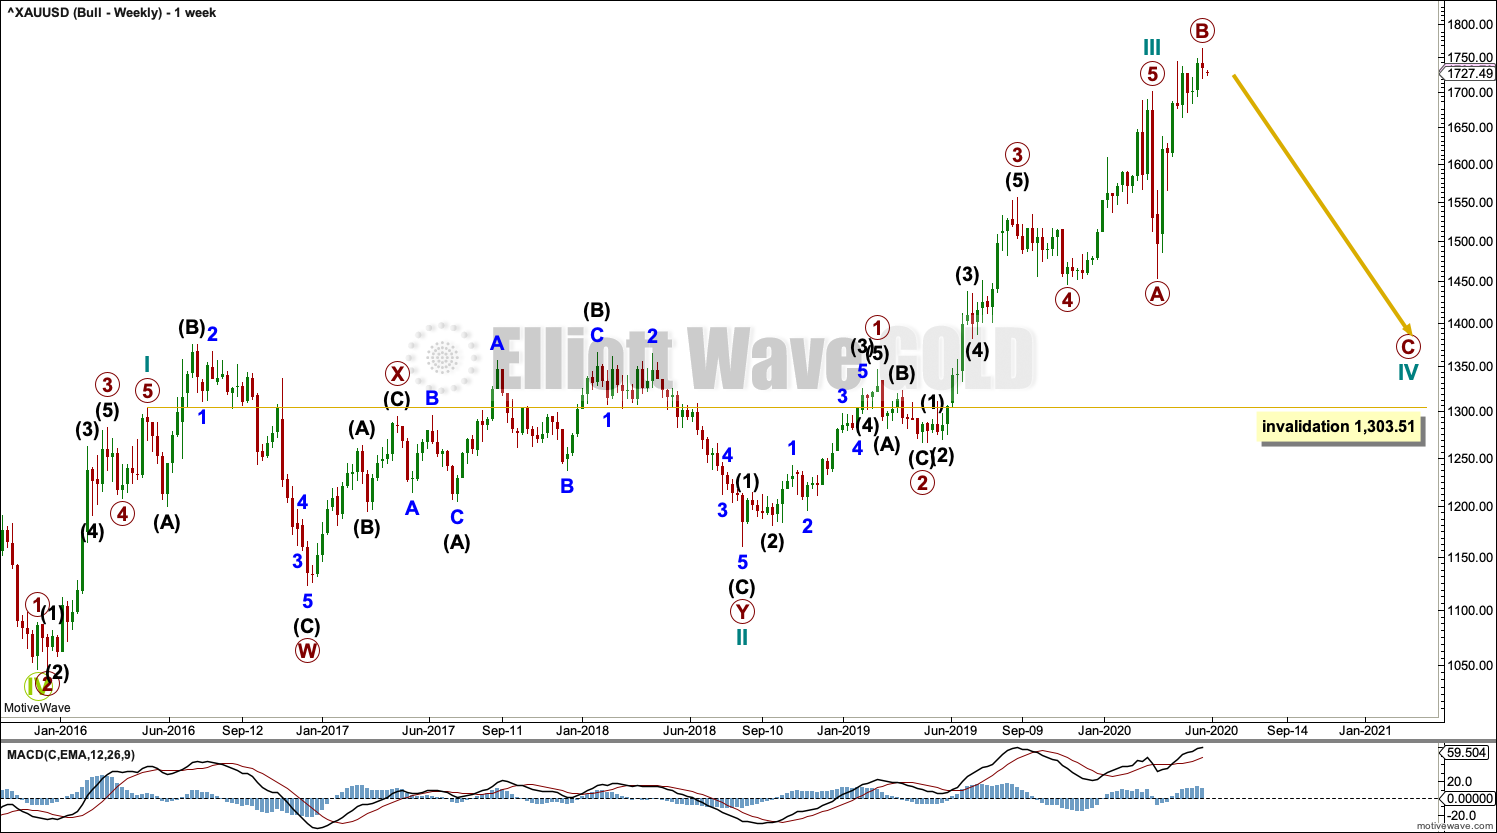
The bigger picture for this main bearish Elliott wave count sees Gold as still within a bear market, in a three steps back pattern that is labelled Grand Super Cycle wave IV on monthly charts.
Super Cycle wave (b) within Grand Super Cycle wave IV may be an incomplete double zigzag.
The first zigzag in the double is labelled cycle wave w. The double is joined by a three in the opposite direction, a combination labelled cycle wave x. The second zigzag in the double is labelled cycle wave y.
The purpose of the second zigzag in a double is to deepen the correction. Cycle wave y has achieved this purpose.
DAILY CHART
Click chart to enlarge.
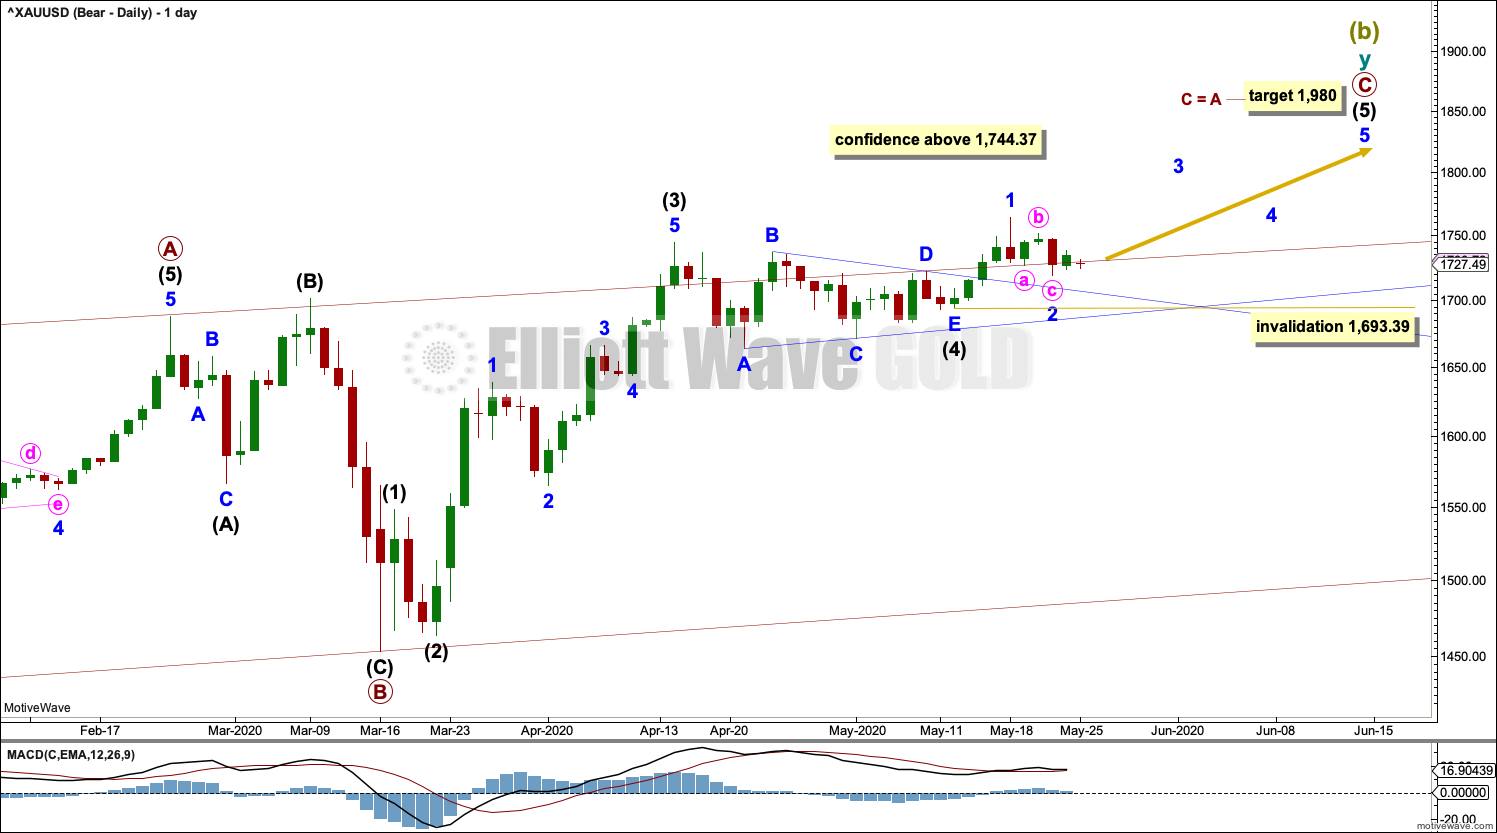
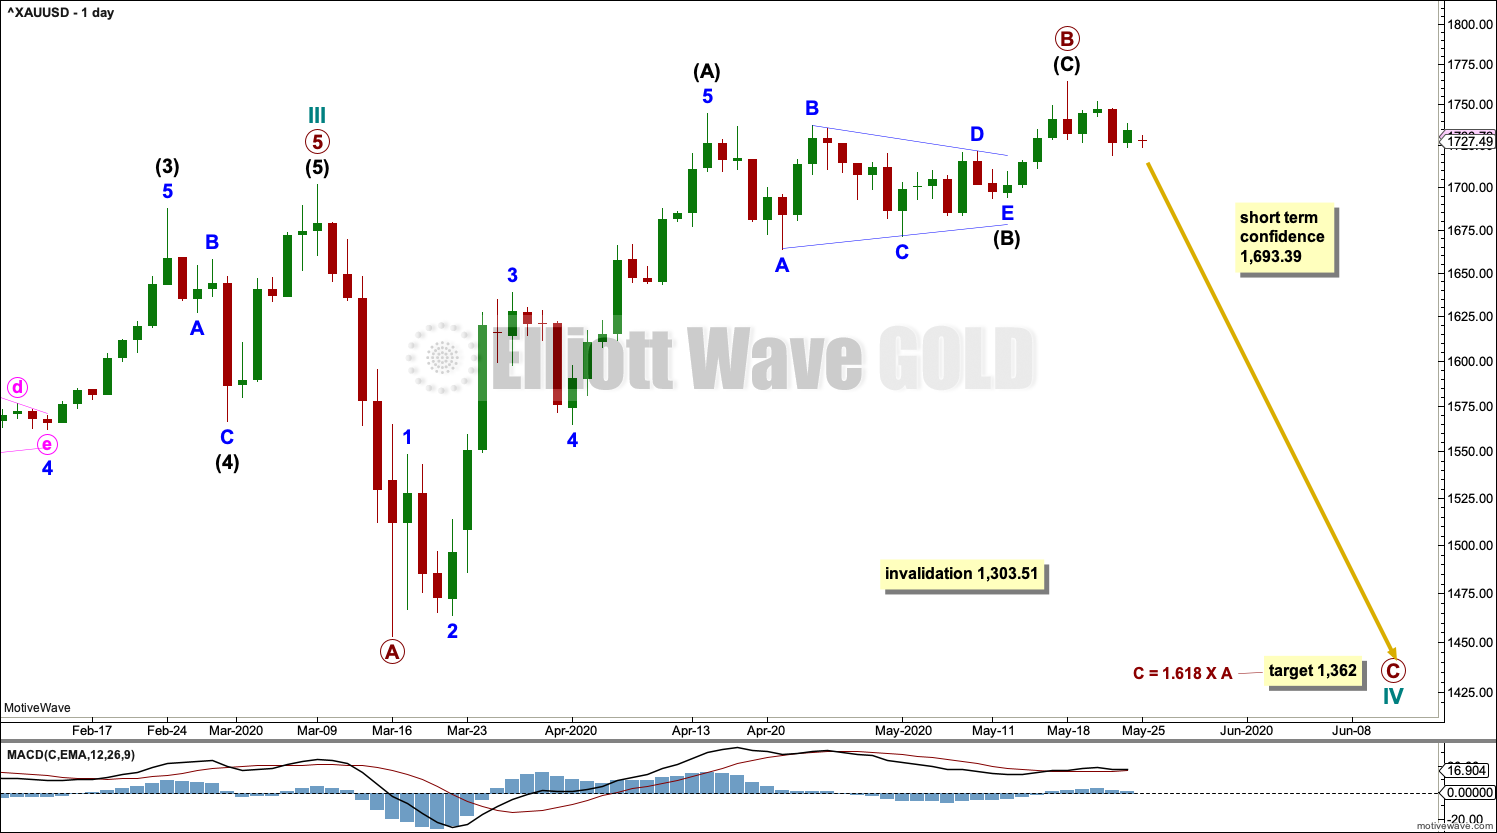
Primary wave C within cycle wave y may be an incomplete five wave impulse. Intermediate waves (1) through to (4) within primary wave C may be complete.
The point in time at which an Elliott wave triangles trend lines cross over is sometimes when a trend change occurs. Extend the triangle trend lines from intermediate wave (4) outwards. A trend change may occur on this date to either down or sideways.
Intermediate wave (5) must subdivide as a five wave structure upwards. Minor wave 1 within intermediate wave (5) may be complete. Minor wave 2 may not move beyond the start of minor wave 1 below 1,693.39.
HOURLY CHART
Click chart to enlarge.
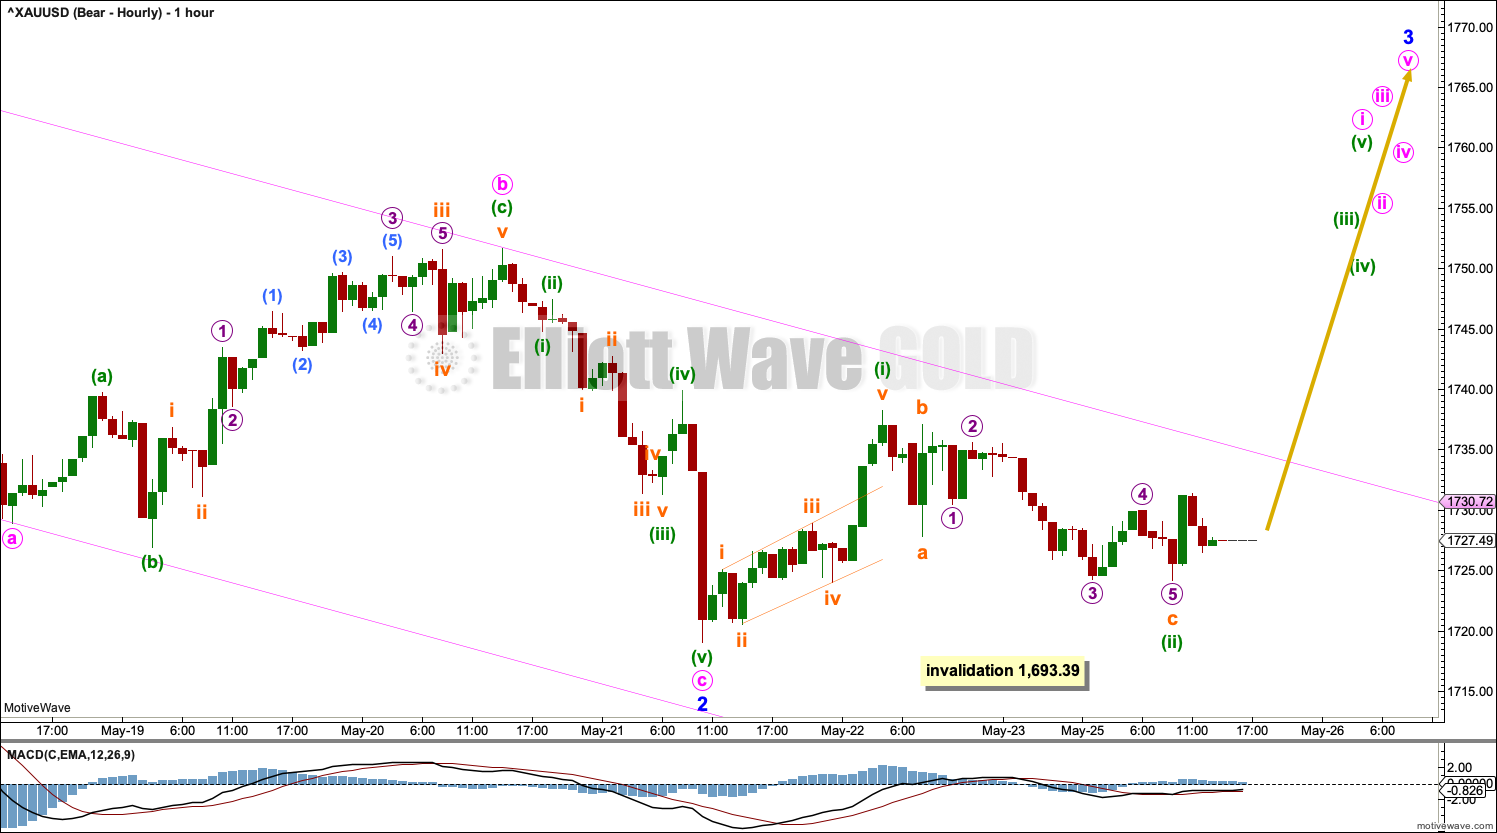
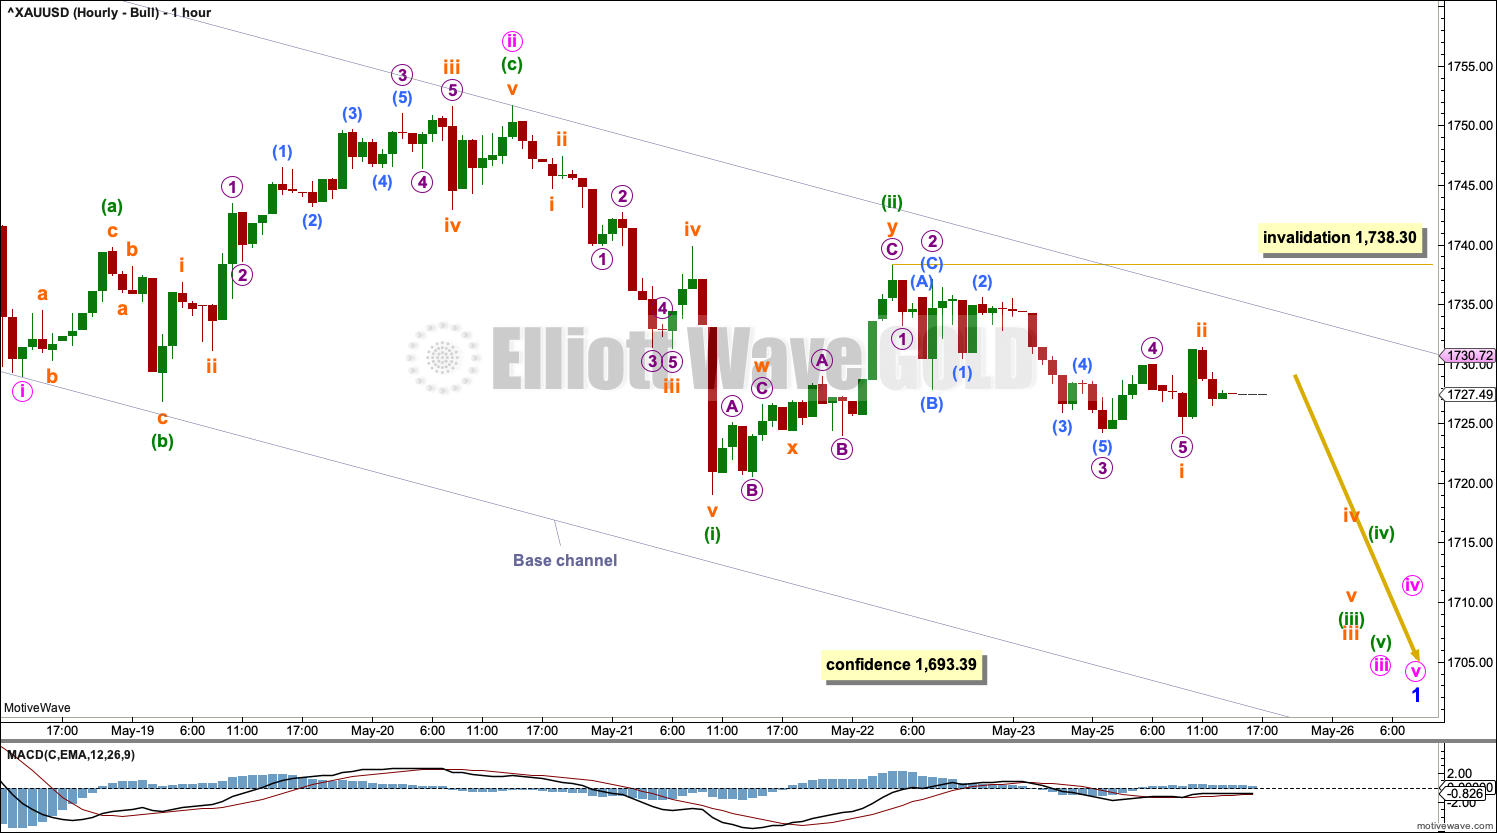
Intermediate wave (5) must subdivide as a five wave motive structure, either an impulse or an ending diagonal. An impulse is much more likely, so that shall be what is expected until and unless overlapping suggests a diagonal.
Minor wave 1 within intermediate wave (5) may be complete.
Minor wave 2 may be complete as a single zigzag. However, if it continues lower as a double zigzag, then minor wave 2 may not move beyond the start of minor wave 1 below 1,693.39.
This Elliott wave count expects a third wave up to begin for minor wave 3.
ALTERNATE HOURLY CHART
Click chart to enlarge.
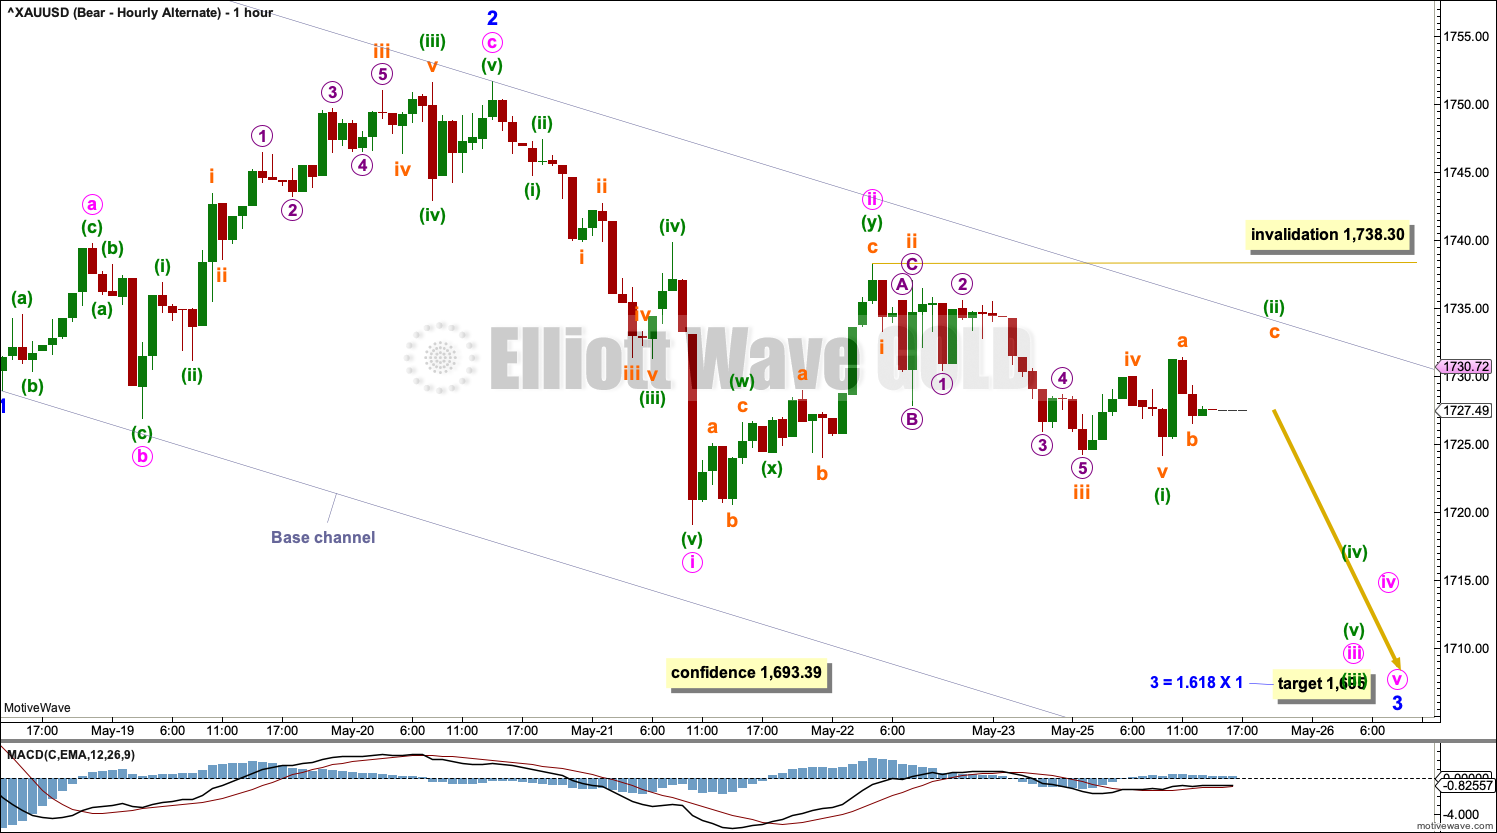
It is again possible that Super Cycle wave (b) may be complete. This wave count requires a new low below 1,693.39 for initial confidence. Further downwards movement and a new low below 1,453.26 would add substantial confidence.
If intermediate wave (5) is complete at the last high, then a new downwards trend to new lows may have just begun. This new downwards trend would be labelled Super Cycle wave (c) at higher time frames.
Minor waves 1 and 2 within the new downwards trend may now be complete. Minute waves i and ii within minor wave 3 may now be complete. Minute wave iii may only subdivide as an impulse. Minuette wave (ii) within minute wave iii may not move beyond the start of minuette wave (i) above 1,738.30.
ALTERNATE BULLISH ELLIOTT WAVE COUNT
WEEKLY CHART
Click chart to enlarge.
This wave count sees the the bear market complete at the last major low for Gold on 3 December 2015.
If Gold is in a new bull market, then it should begin with a five wave structure upwards on the weekly chart.
Cycle wave I fits as a five wave impulse with reasonably proportionate corrections for primary waves 2 and 4.
Cycle wave II fits as a double flat. However, within the first flat correction labelled primary wave W, this wave count needs to ignore what looks like an obvious triangle from July to September 2016 (this can be seen labelled as a triangle on the bear wave count above). This movement must be labelled as a series of overlapping first and second waves. Ignoring this triangle reduces the probability of this wave count in Elliott wave terms.
Within the first flat correction labelled primary wave W of the double flat of cycle wave II, intermediate wave (B) is 1.69 the length of intermediate wave (A). This is longer than the common range of up to 1.38, but within an allowable guideline of up to 2. The length of intermediate wave (B) reduces the probability of this wave count.
Cycle wave III may be complete. Cycle wave IV may not move into cycle wave I price territory below 1,303.51.
DAILY CHART
Click chart to enlarge.
Cycle wave IV may be an incomplete expanded flat correction. Primary wave A within the flat correction may have subdivided as a zigzag. Primary wave B may now be a complete zigzag. Primary wave B would be a 1.25 length of primary wave A. This is within the normal range for primary wave B within a flat from 1 to 1.38 times the length of primary wave A.
A target is calculated for primary wave C to end based upon the most common Fibonacci ratio to primary wave A within an expanded flat. Primary wave C must subdivide as a five wave motive structure.
HOURLY CHART
Click chart to enlarge.
Primary wave C must subdivide as a five wave motive structure, either an impulse or an ending diagonal. An impulse is more common, so that is what shall be expected.
Minor wave 1 within the new downwards trend may be incomplete. Minute waves i and ii within minor wave 1 may be complete. Minute wave iii may only subdivide as an impulse. Minuette waves (i) and (ii) within minute wave iii may be complete. Subminuette wave ii within minuette wave (iii) may not move beyond that start of subminuette wave i above 1,738.30.
TECHNICAL ANALYSIS
There is no new technical analysis data to analyse today due to the Memorial Day public holiday in the United States. StockCharts data is available only when New York Stock Exchange is open.
WEEKLY CHART
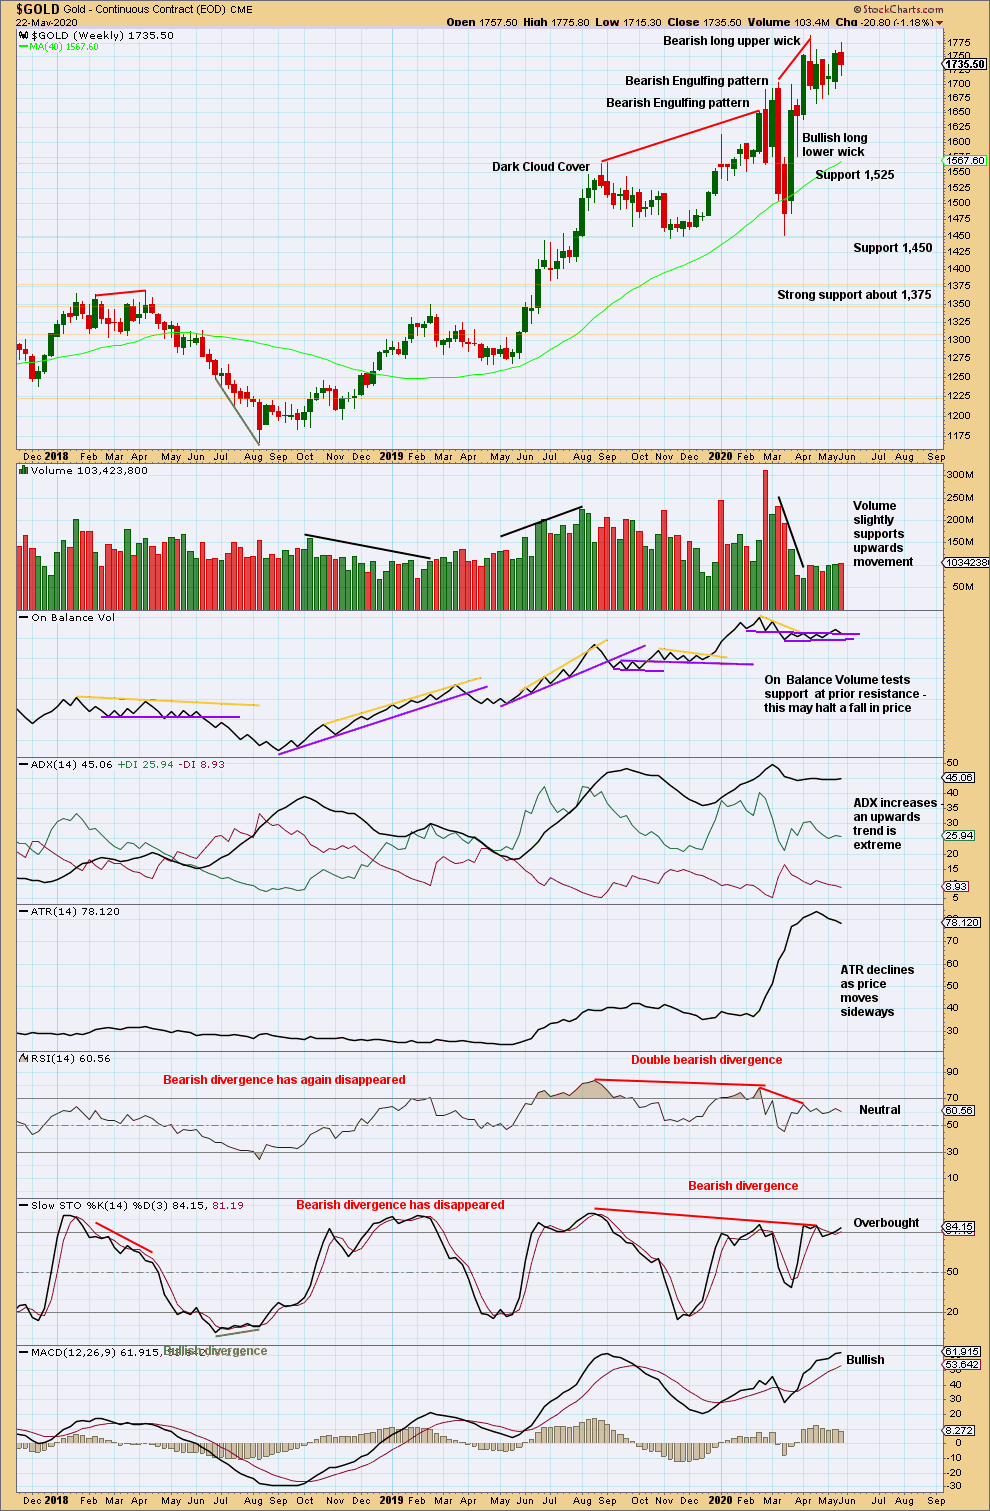
Click chart to enlarge. Chart courtesy of StockCharts.com.
The upwards trend remains extreme. RSI is not yet overbought; there is room for an upwards trend to continue.
DAILY CHART
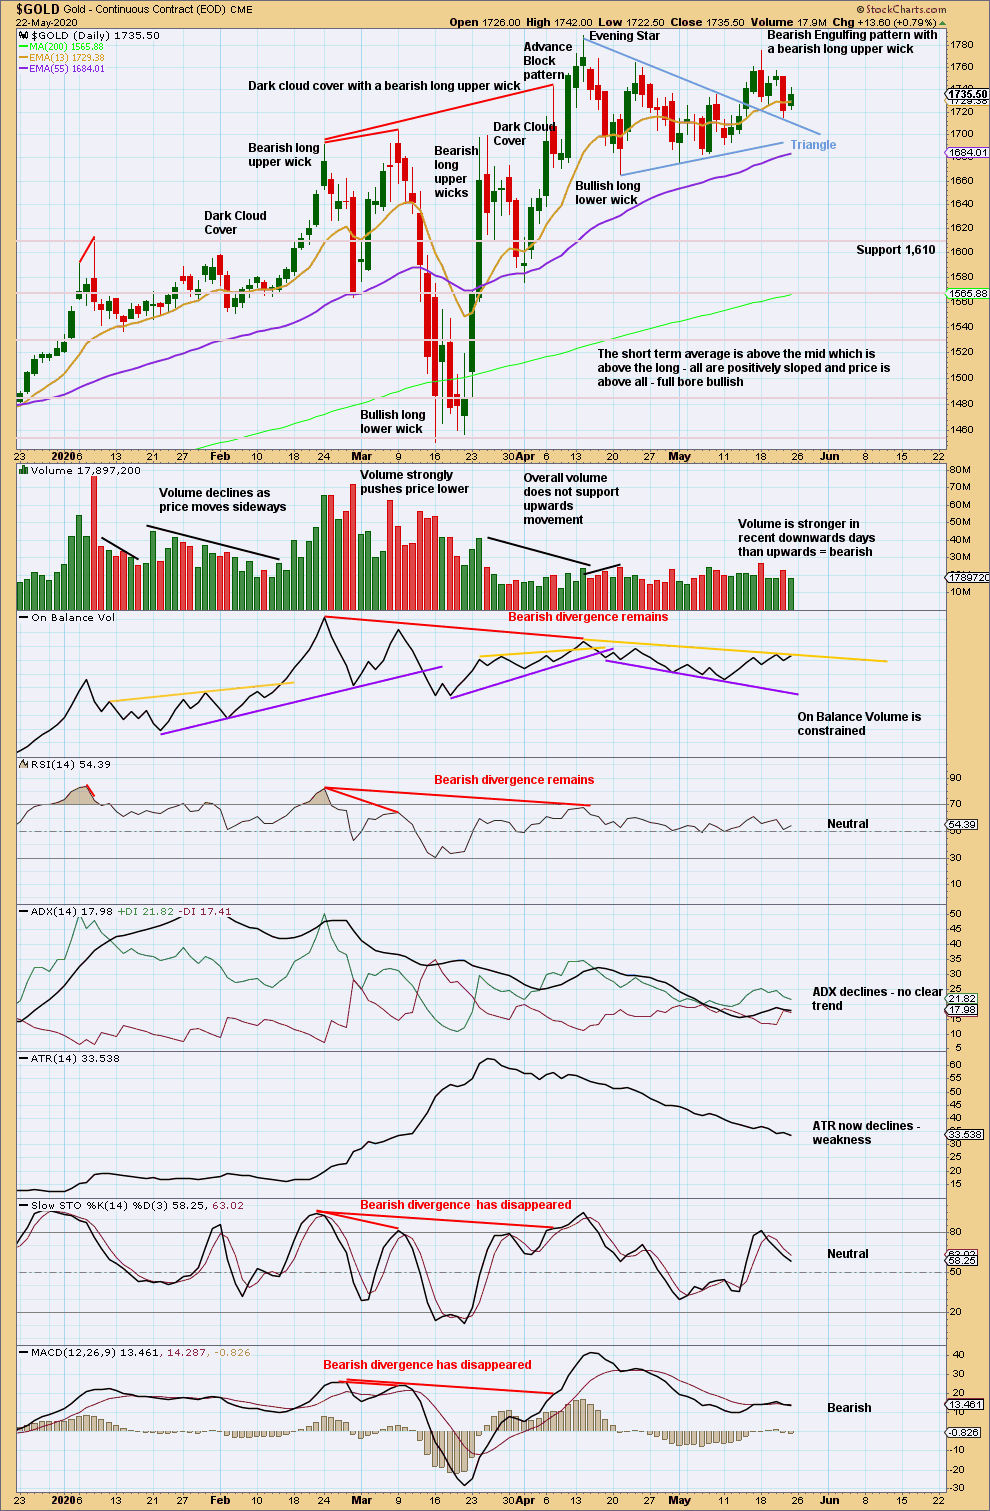
Click chart to enlarge. Chart courtesy of StockCharts.com.
Price has closed above the upper edge of a triangle pattern. A target is at 1,849. However, a lack of support from volume for upwards movement indicates this market may currently be vulnerable to pullbacks. Extra caution regarding risk management is advised at this time.
Now a strong bearish reversal pattern with support from volume increases the warning that this market is vulnerable to a trend change.
The short-term volume profile is bearish.
Price has found support at the upper triangle trend line. This may be a typical back test of support. A breach of this line would be a bearish signal, but in the first instance expect price to most likely bounce up off support here.
GDX WEEKLY CHART
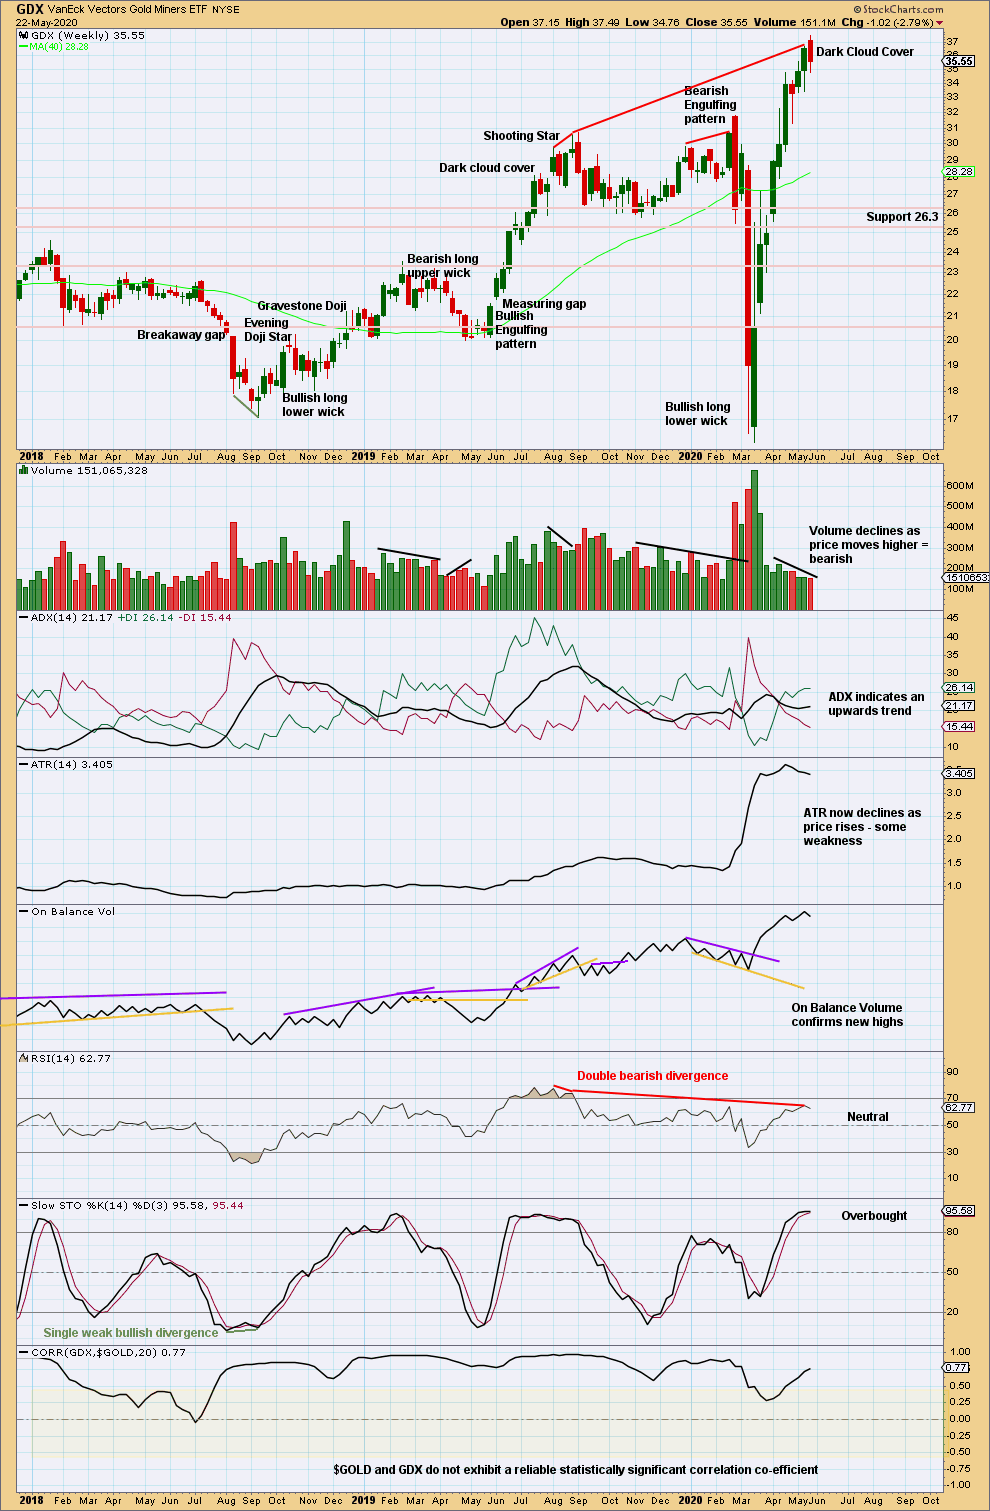
Click chart to enlarge. Chart courtesy of StockCharts.com.
Weak volume and now a bearish candlestick pattern indicate the risk of a trend change here to either down or sideways is high.
GDX DAILY CHART
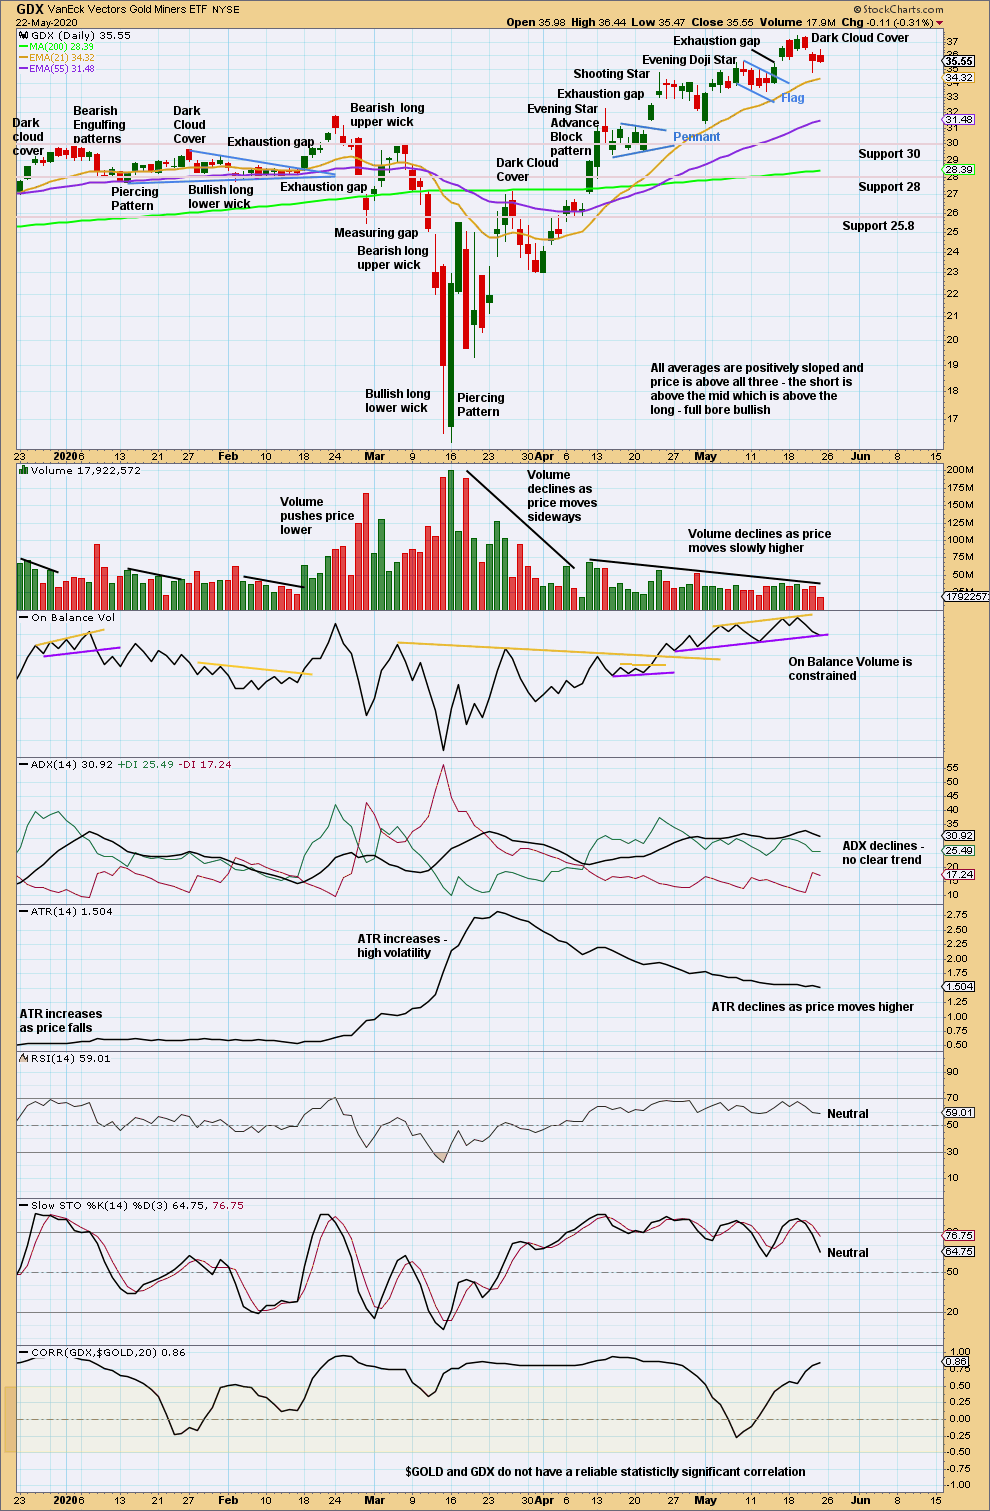
Click chart to enlarge. Chart courtesy of StockCharts.com.
Another bearish candlestick reversal pattern appears in the context of an extreme upwards trend that exhibits weakness in declining ATR. It should be taken as reasonable warning there may be a trend change here to either downwards or sideways.
The last gap down at 36.45 remains open today just by 0.01. It may be a breakaway gap, which may not be closed. If it is closed, then that would be a bullish signal.
Published @ 06:36 p.m. EST.
—
Careful risk management protects your trading account(s).
Follow my two Golden Rules:
1. Always trade with stops.
2. Risk only 1-5% of equity on any one trade.
—
New updates to this analysis are in bold.