
Lara’s Weekly: Elliott Wave and Technical Analysis of S&P500 and Gold and US Oil | Charts – May 1, 2020

S&P 500
Downwards movement to end the week has been enough to invalidate a short-term alternate Elliott wave count and provide some confidence in the main short-term Elliott wave count.
Summary: A downwards or sideways movement may develop here, which may last a few days to a few weeks and may find support about 2,663 to 2,650.
Thereafter, upwards movement to the final target about 3,069 to 3,261 may begin.
Thereafter, the downwards trend may resume with strength.
The biggest picture, Grand Super Cycle analysis, is here.
Last monthly charts are here. Video is here. Members are encouraged to view all three monthly charts. The third is much more bearish than this main wave count and remains a valid possibility.
ELLIOTT WAVE COUNTS
WEEKLY CHART
Click chart to enlarge.
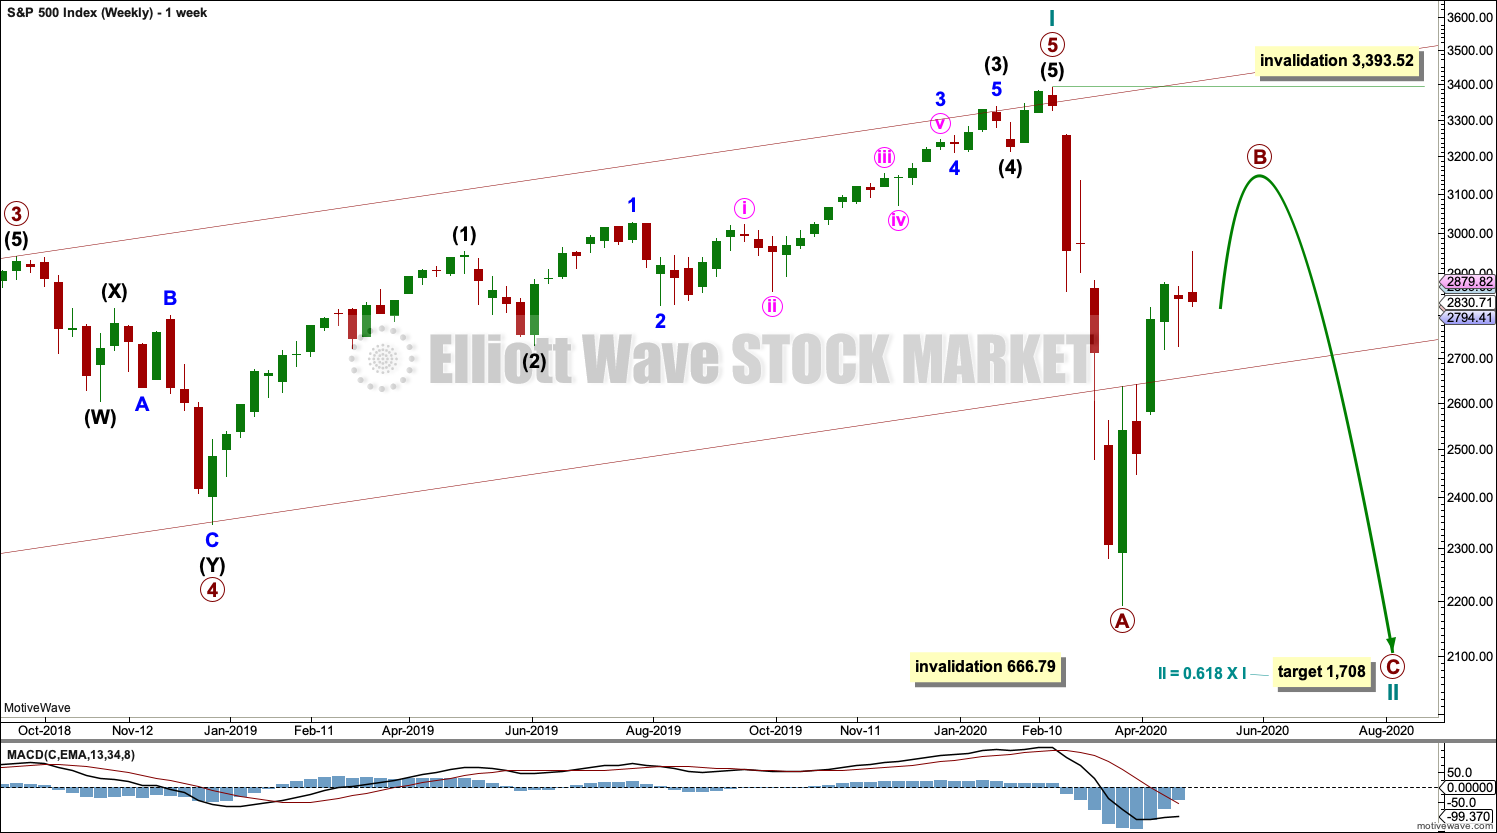
The channel is now breached by a full weekly candlestick below and not touching the lower edge. Further confidence in this wave count may be had.
Price has reached below the 0.382 Fibonacci ratio of cycle wave I at 2,352 on the last downwards movement. The structure of cycle wave II may need further to go to complete. The next Fibonacci ratio at 0.618 is now a preferred target for cycle wave II to end.
Cycle wave II would most likely subdivide as a zigzag; thus far that looks like what is unfolding. When primary waves A and B may both be complete, then the target may be calculated using a Fibonacci ratio between primary waves A and C. At that stage, the final target may change or widen to a zone.
Cycle wave II may not move beyond the start of cycle wave I below 666.79.
DAILY CHART
Click chart to enlarge.
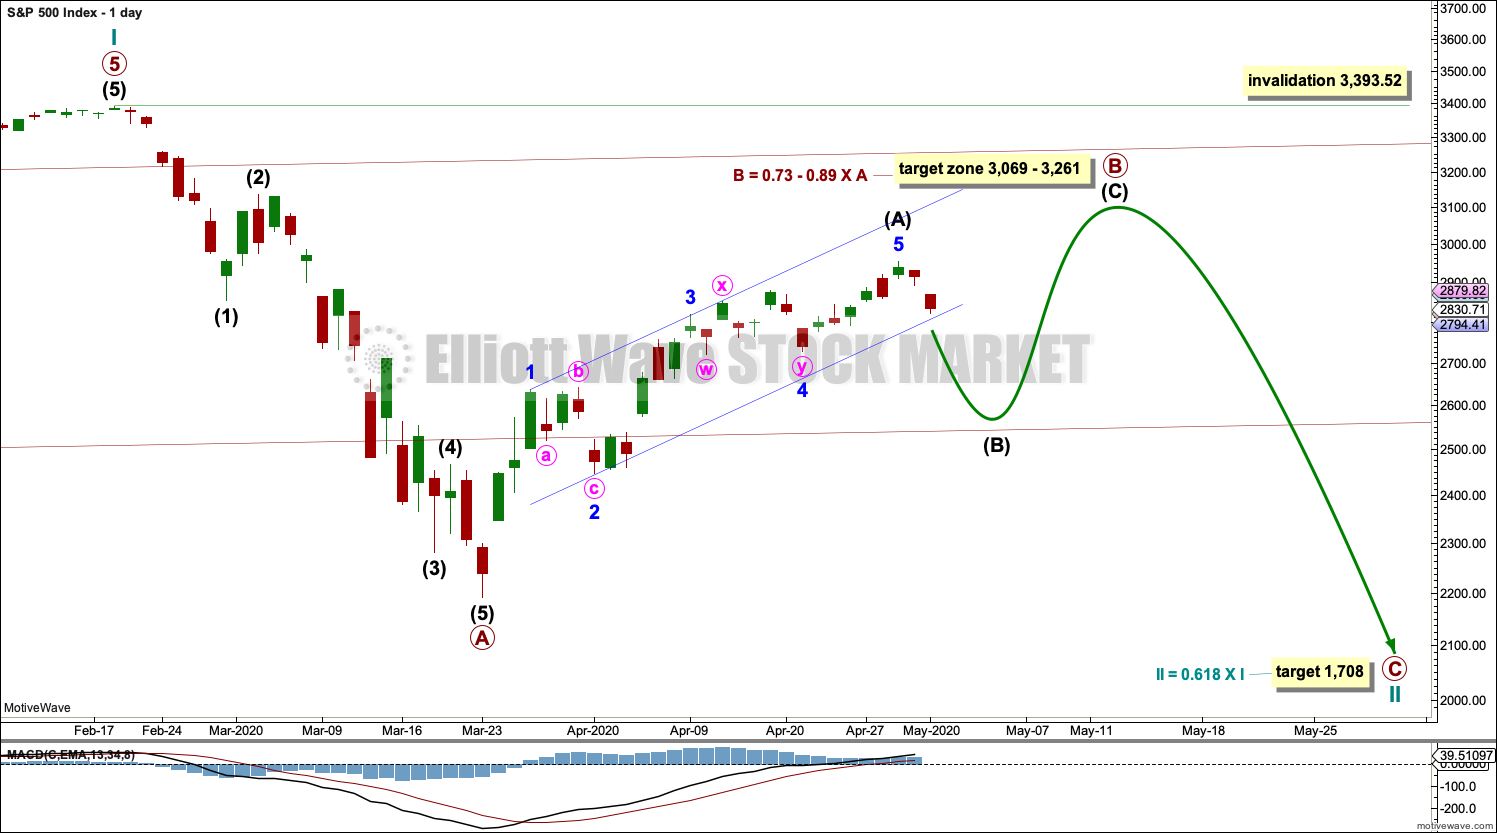
Draw the wide maroon trend channel carefully: draw the first trend line from the end of primary wave 1 at 2,093.55 (December 26, 2014), to the end of primary wave 3 at 2,940.91 (September 21, 2018), then place a parallel copy on the end of primary wave 2 at 1,810.10 (February 11, 2016). The channel is fully breached indicating a trend change from the multi-year bull trend to a new bear trend. Resistance at the lower edge has been overcome; price has closed above this trend line. The lower edge of this trend channel may provide support now as primary wave B continues.
Cycle wave II may subdivide as any Elliott wave corrective structure except a triangle. It would most likely be a zigzag. Primary wave A may be a complete five wave impulse. Primary wave B may not move beyond the start of primary wave A above 3,393.52.
Cycle wave II must subdivide as a corrective structure. It may not subdivide as a five wave motive structure. So far it looks like a five up may be complete; if this is correct, then cycle wave II would be incomplete.
Draw a channel about intermediate wave (A) using Elliott’s first technique: draw the first trend line from the end of minor waves 1 to 3, then place a parallel copy on the end of minor wave 2. Intermediate wave (B) may breach this channel. Intermediate wave (B) may find support at the lower edge of the wider maroon channel.
When intermediate wave (B) may be complete, then a new and wider channel may be drawn to contain all of primary wave B.
ALTERNATE DAILY CHART
Click chart to enlarge.
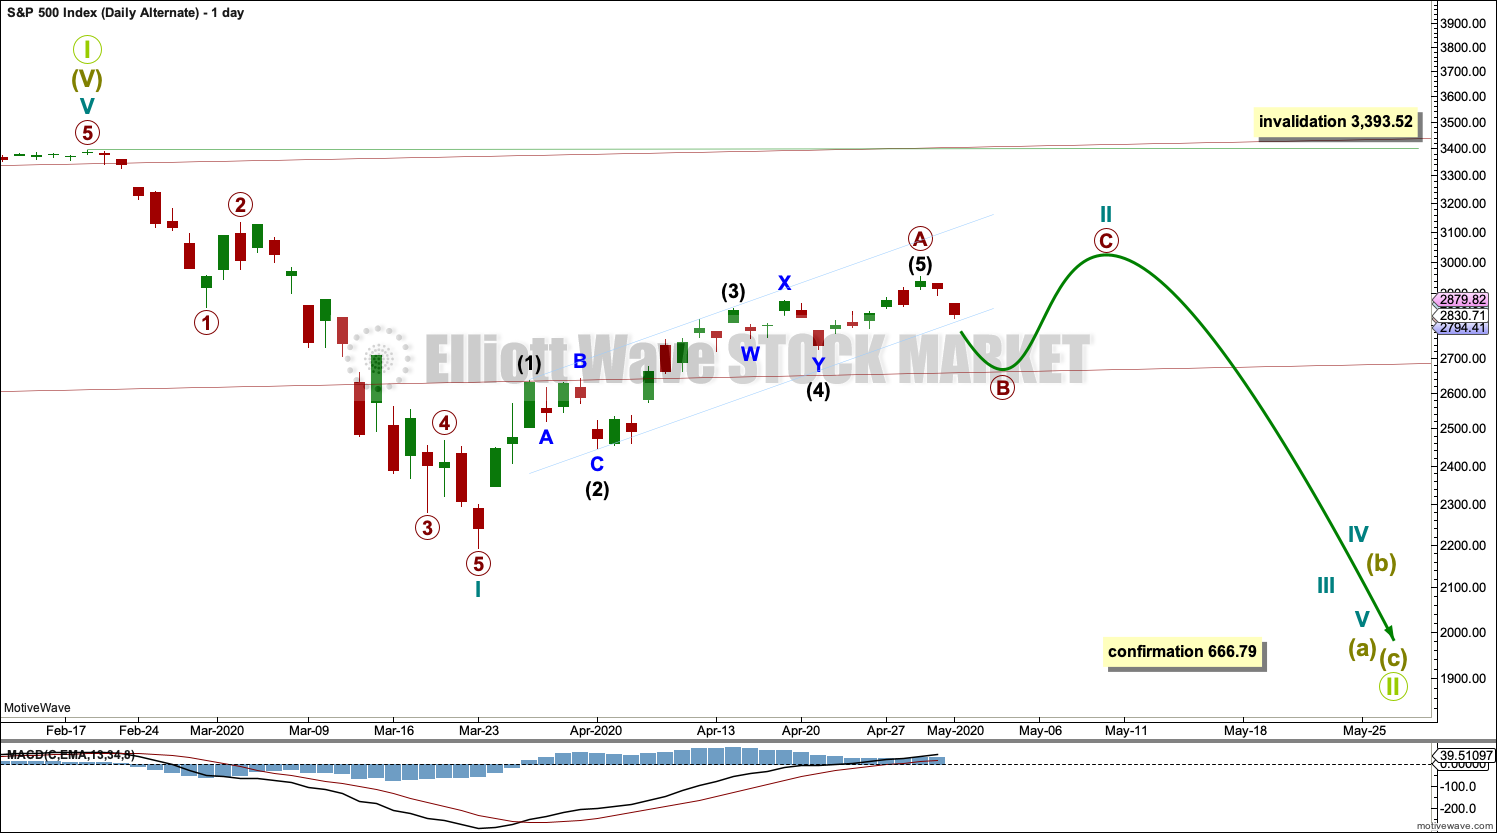
This alternate daily chart follows the Second Alternate Monthly chart published here. Video is here.
By simply moving the degree of labelling in the bull market beginning March 2009 up one degree, it is possible that a Grand Super Cycle trend change occurred on February 19, 2020.
A correction at Grand Super Cycle degree may be expected to last at least a decade, possibly longer. Corrections for this market tend to be much quicker than bullish moves, and so a fair amount of flexibility is required in expectations for duration of the different degrees.
Grand Super Cycle II would most likely subdivide as a zigzag, although it may be any corrective structure except a triangle. It should begin with a five down at the weekly chart time frame, which would be incomplete.
The first wave down on the daily chart is labelled cycle wave I. If this degree of labelling is wrong, it may be too high; it may need to be moved down one degree.
Following cycle wave I, cycle wave II may be continuing higher as a zigzag. Cycle wave II may not move beyond the start of cycle wave I above 3,393.52.
When cycle wave II may again be complete, then a target for cycle wave III may be calculated.
TECHNICAL ANALYSIS
WEEKLY CHART
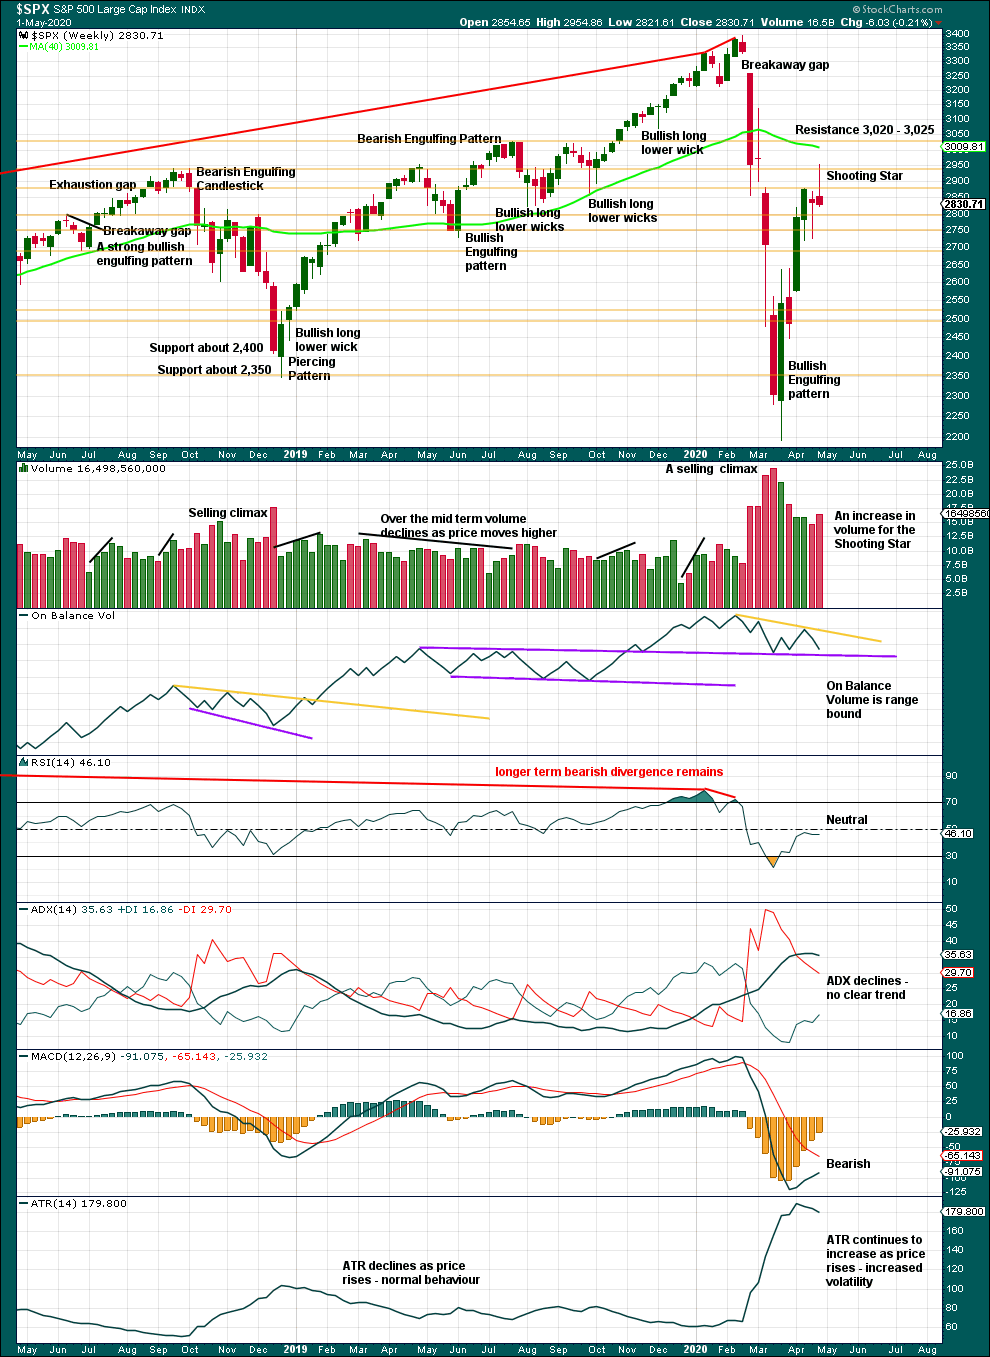
Click chart to enlarge. Chart courtesy of StockCharts.com.
The Shooting Star pattern warns of a trend change here to either down or sideways.
DAILY CHART
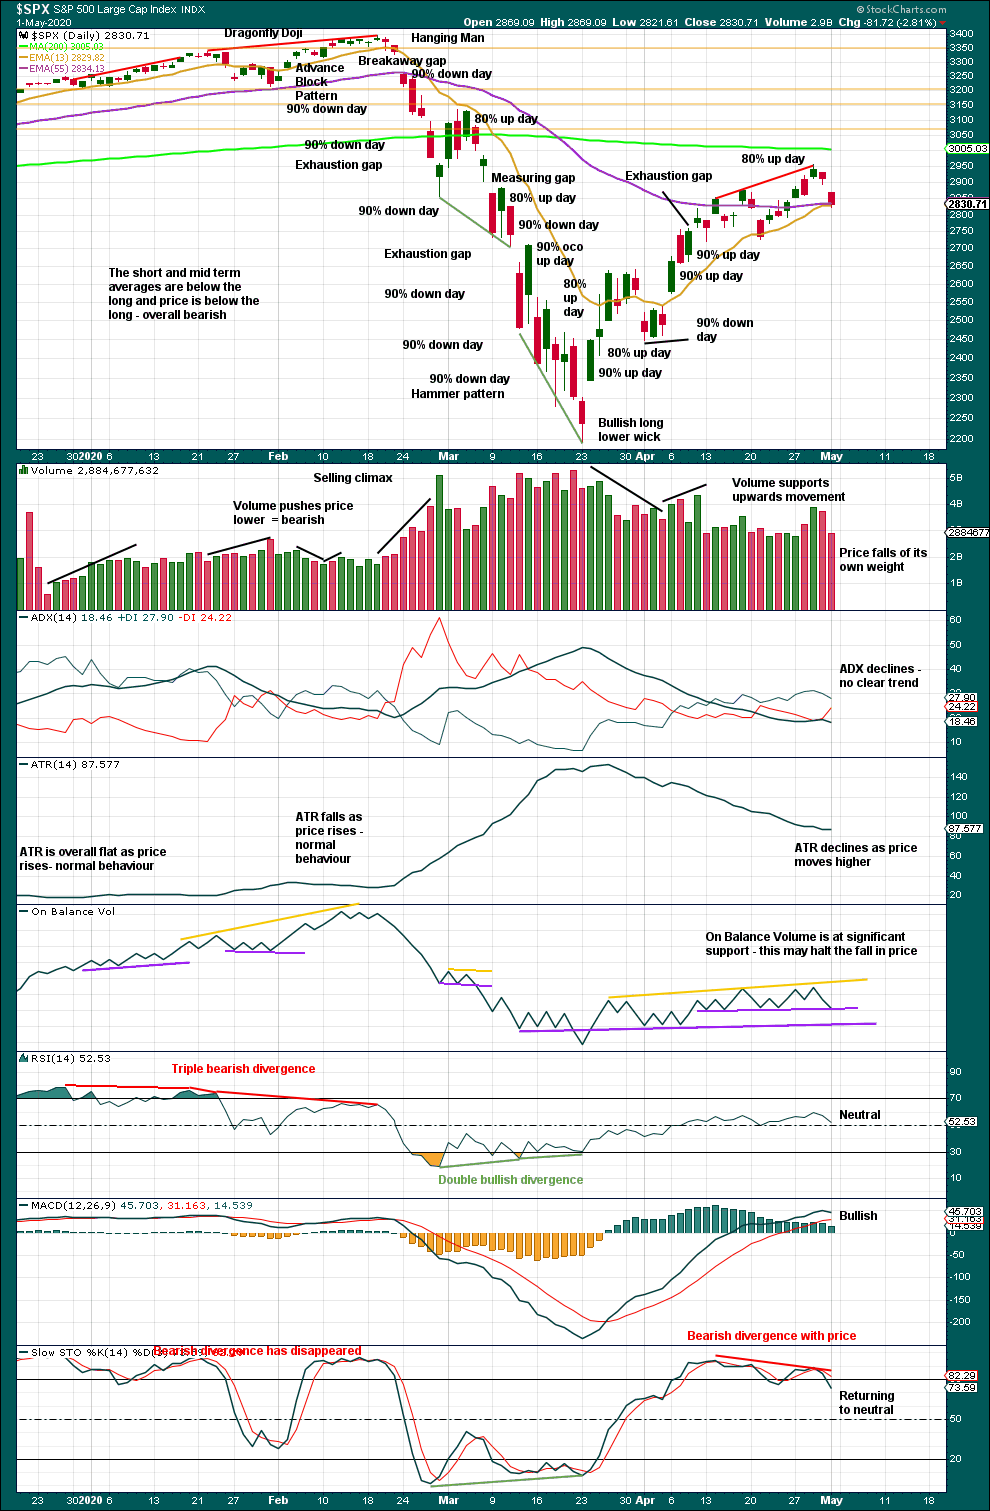
Click chart to enlarge. Chart courtesy of StockCharts.com.
In the bear market from October 2000 to March 2009, the first multi-day bounce retraced 0.73 of the first wave down. In the bear market from March 2000 to October 2002, the first multi-day bounce retraced 0.89 of the first wave down. So far this current bounce has retraced 0.63 of the first wave down, so it seems reasonable that it could continue higher.
To see what signals may be looked for to identify a high, the two previous large bear markets were analysed in end of week analysis. The DotCom crash was analysed here with video here. The Global Financial Crisis was also analysed here with video here.
There is now a bearish reversal pattern on the weekly chart but not the daily chart. It is now technically possible that the bounce is over, but the Elliott wave count sees the bounce as an incomplete structure.
BREADTH – AD LINE
WEEKLY CHART
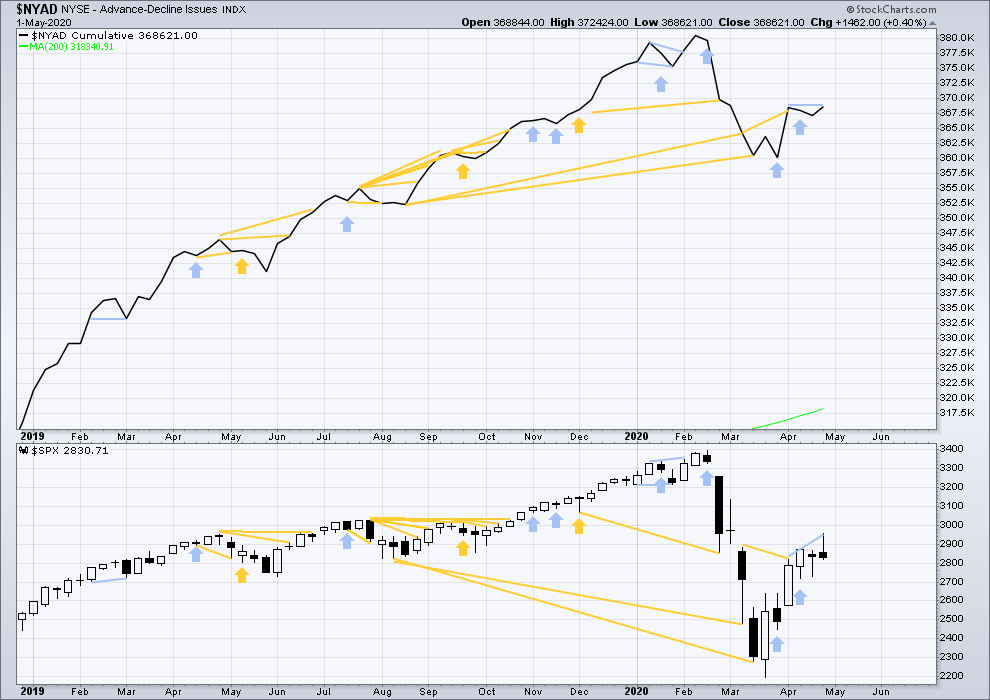
Click chart to enlarge. Chart courtesy of StockCharts.com. So that colour blind members are included, bearish signals will be noted with blue and bullish signals with yellow.
Breadth should be read as a leading indicator.
This week price has moved higher, but the AD line is flat. This divergence is bearish, but it is weak.
Large caps all time high: 3,393.52 on 19th February 2020.
Mid caps all time high: 2,109.43 on 20th February 2020.
Small caps all time high: 1,100.58 on 27th August 2018.
DAILY CHART
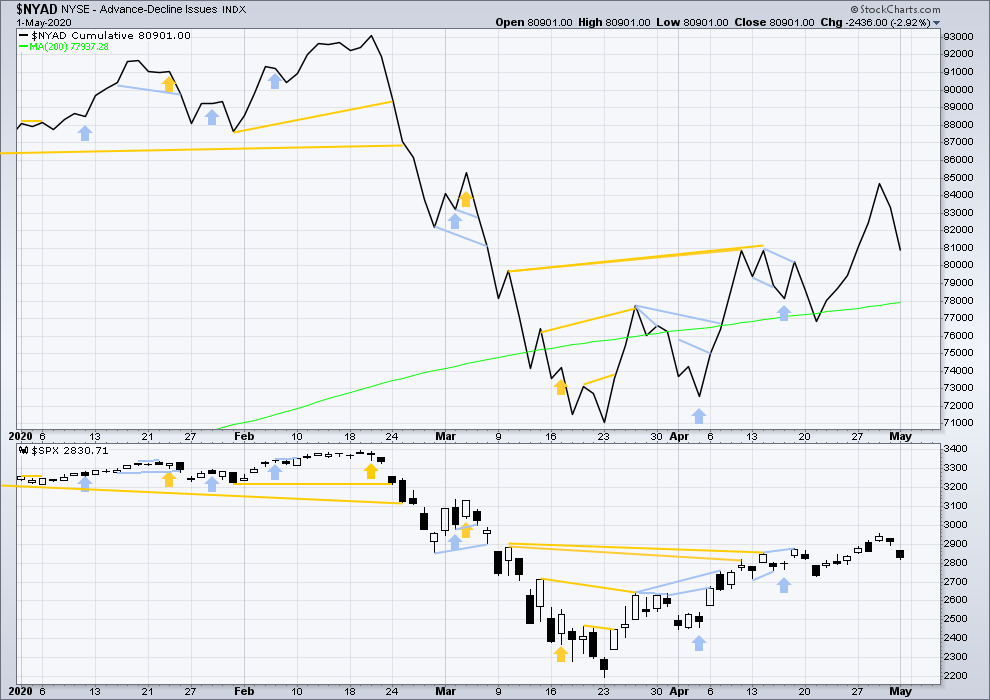
Click chart to enlarge. Chart courtesy of StockCharts.com. So that colour blind members are included, bearish signals will be noted with blue and bullish signals with yellow.
Today both price and the AD line have moved lower. There is no new divergence.
All of small, mid and large caps have made new swing highs above the prior highs of 17th and 9th of April.
VOLATILITY – INVERTED VIX CHART
WEEKLY CHART
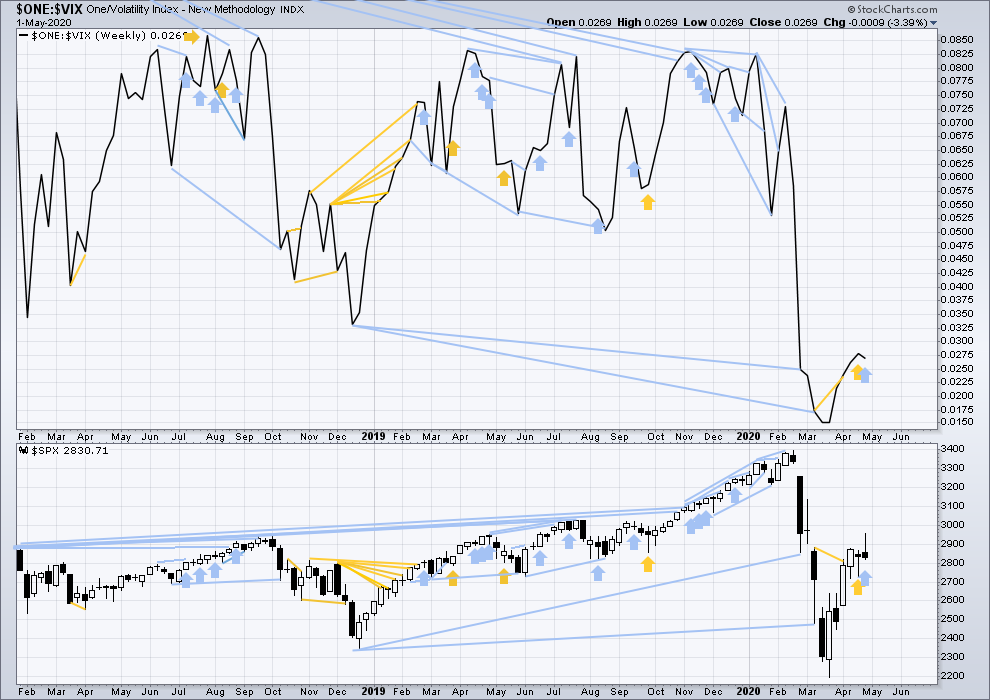
Click chart to enlarge. Chart courtesy of StockCharts.com. So that colour blind members are included, bearish signals will be noted with blue and bullish signals with yellow.
Last week noted bullish divergence between price and inverted VIX. This has been followed by an upwards week, so it is considered to have been predictive.
This week price has moved higher, but inverted VIX has moved lower. This divergence is bearish and supports the Elliott wave count.
DAILY CHART
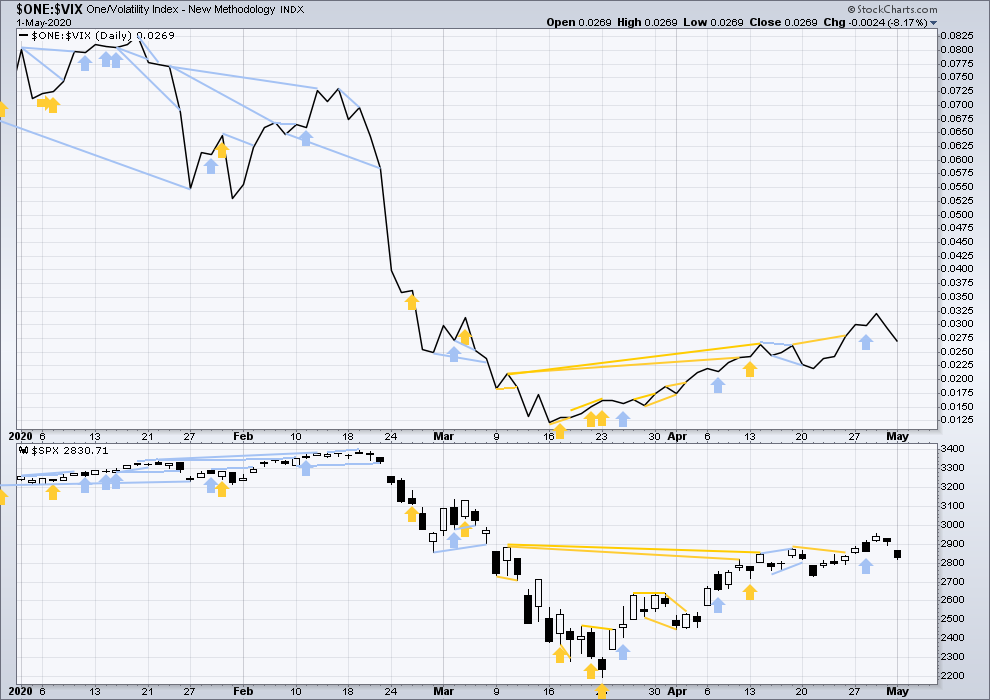
Click chart to enlarge. Chart courtesy of StockCharts.com. So that colour blind members are included, bearish signals will be noted with blue and bullish signals with yellow.
Today both price and inverted VIX have moved lower. There is no new divergence.
DOW THEORY
Dow Theory has confirmed a bear market with the following lows made on a closing basis:
DJIA: 21,712.53 – a close below this point has been made on the March 12, 2020.
DJT: 8,636.79 – a close below this point has been made on March 9, 2020.
Adding in the S&P and Nasdaq for an extended Dow Theory, a bear market has now been confirmed:
S&P500: 2,346.58 – a close below this point has now been made on March 20, 2020.
Nasdaq: 7,292.22 – a close below this point was made on the March 12, 2020.
GOLD
The week ends with more downwards movement, but price remains range bound.
Summary: A target for the bullish wave count for a downwards wave is at 1,324. The main bearish wave count expects a new downwards trend for several months to new lows below 1,046.27 with a new short-term target for a third wave down at 1,607.
If price makes a new high above 1,744.37, then an alternate wave count would be more likely. The target would then be at 1,980.
Grand SuperCycle analysis is here.
Monthly charts were last updated here.
MAIN BEARISH ELLIOTT WAVE COUNT
WEEKLY CHART
Click chart to enlarge.
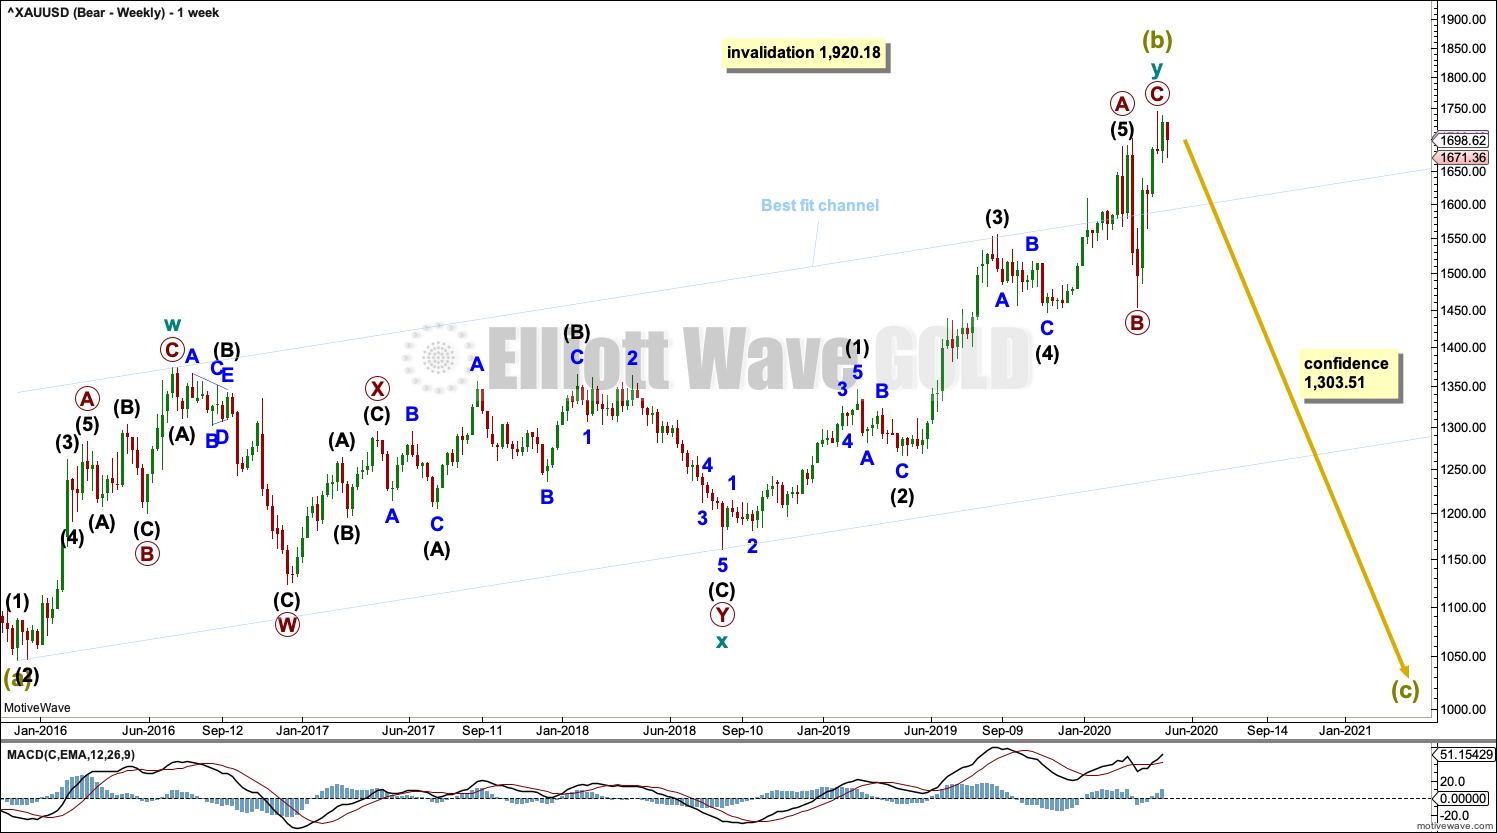
Super Cycle wave (b) may be a complete double zigzag.
The first zigzag in the double is labelled cycle wave w. The double is joined by a three in the opposite direction, a combination labelled cycle wave x. The second zigzag in the double is labelled cycle wave y.
The purpose of the second zigzag in a double is to deepen the correction. Cycle wave y has achieved this purpose.
A wide best fit channel is added in light blue. Copy this channel over to daily charts.
DAILY CHART
Click chart to enlarge.
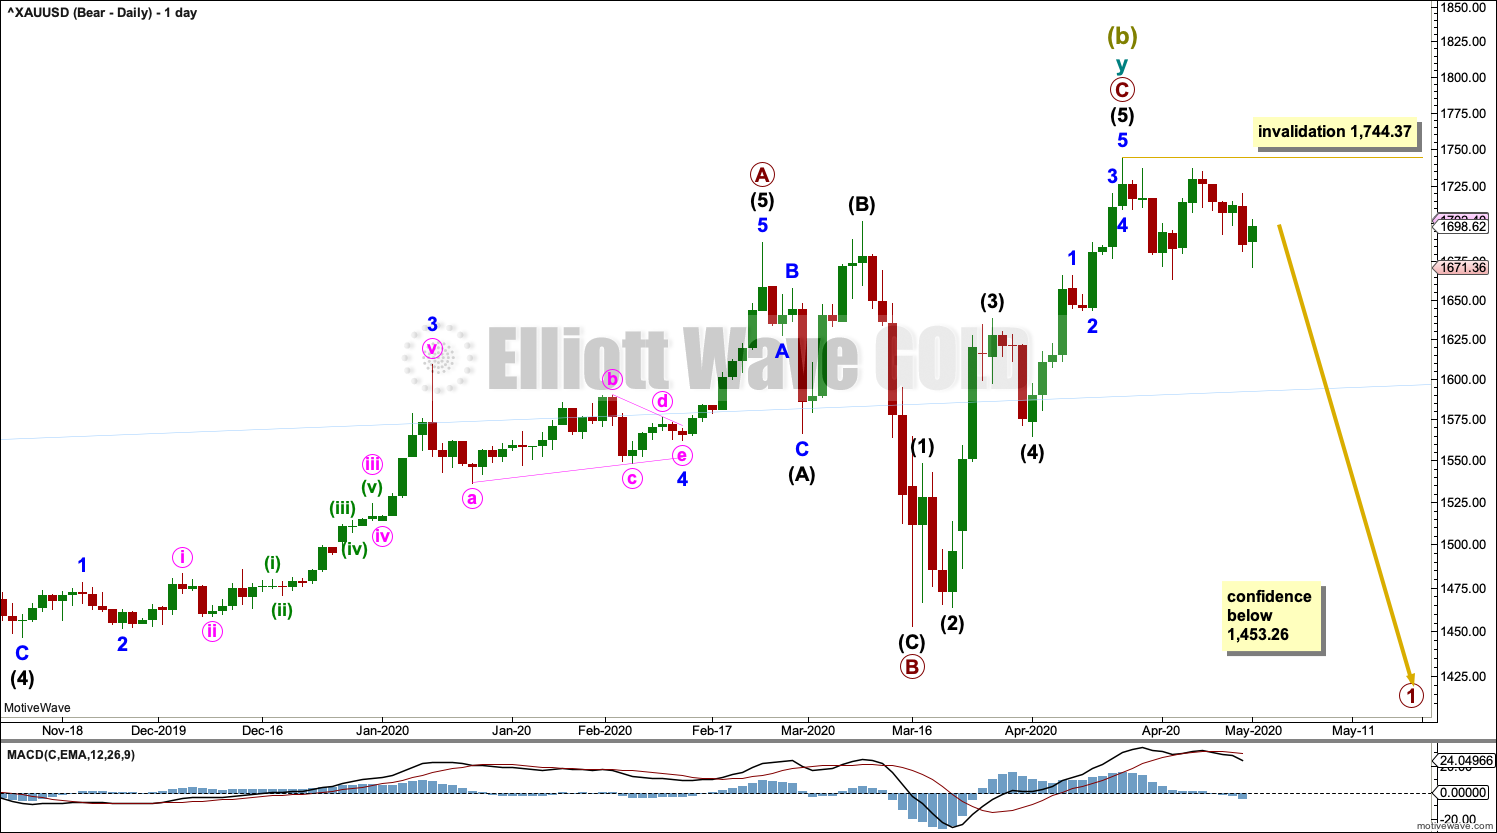
The daily chart focusses on the structure of cycle wave y. It is possible that primary wave C may be over.
No second wave correction within a new downwards trend may move beyond its start above 1,744.37.
A new low now below 1,453.26 would add substantial confidence to this wave count. At that stage, the alternate below would be invalidated.
ALTERNATE BEARISH WAVE COUNT
DAILY CHART
Click chart to enlarge.
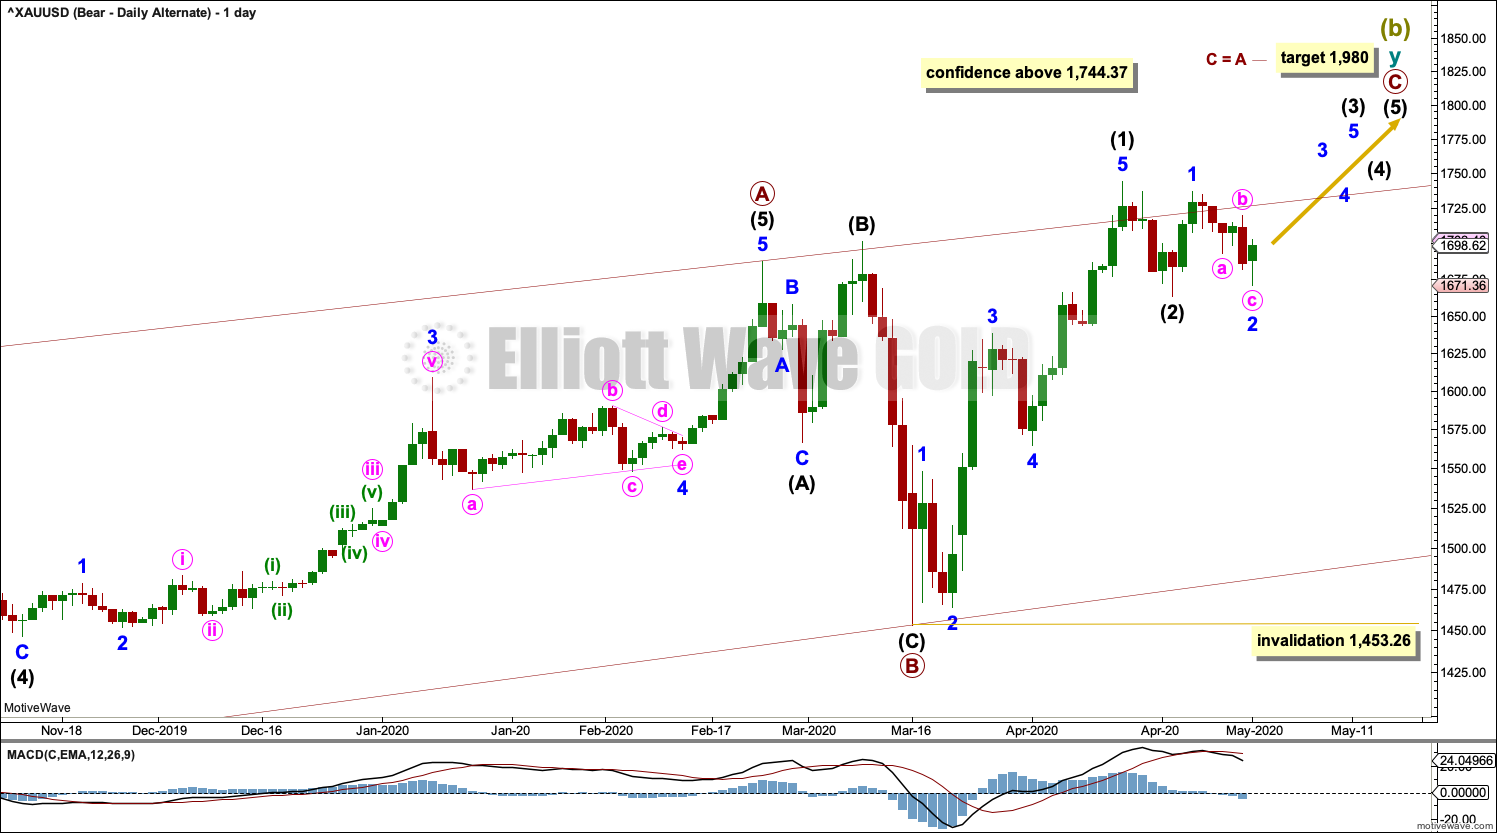
This wave count follows the alternate monthly bearish wave count published in last monthly analysis, which is linked to at the beginning of this analysis.
This wave count looks at the possibility that Grand Super Cycle wave (II) may be a flat correction, which would require Super Cycle wave (b) within it to retrace a minimum 0.9 length of Super Cycle wave (a) at 1,832.79. Super Cycle wave (b) may make a new high above the start of Super Cycle wave (a) at 1,920.18 as in an expanded flat.
By moving the degree of labelling within primary wave C down one degree, it is possible to see that it may be incomplete. Only intermediate wave (1) within primary wave C may be complete. Intermediate wave (2) may not move beyond the start of intermediate wave (1) below 1,453.26.
This wave count should only be used if price makes a new short-term high above 1,744.37. At that stage, it would increase in probability.
ALTERNATE BULLISH ELLIOTT WAVE COUNT
WEEKLY CHART
Click chart to enlarge.
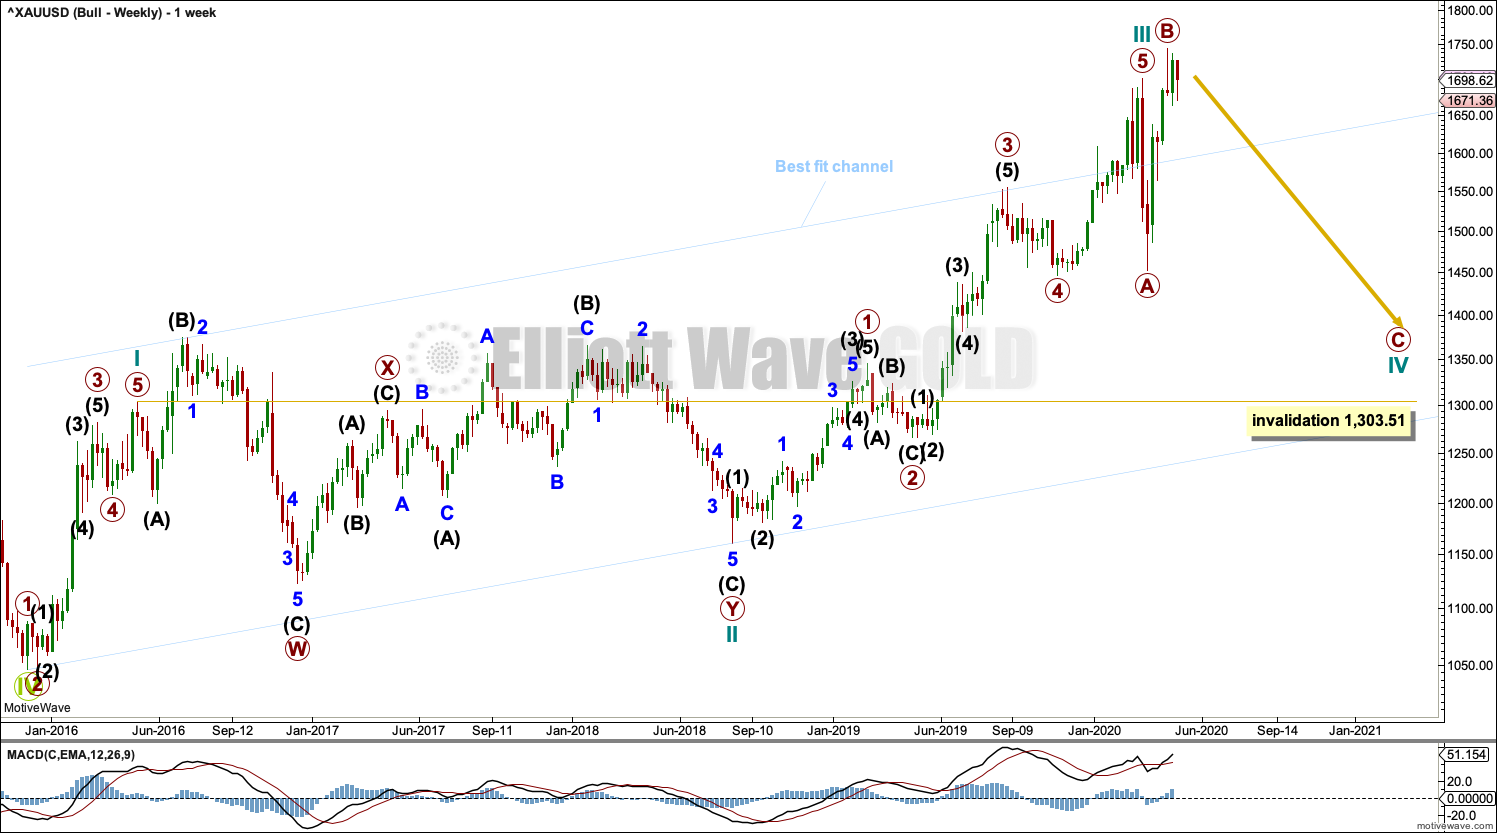
This wave count sees the the bear market complete at the last major low for Gold on 3 December 2015.
If Gold is in a new bull market, then it should begin with a five wave structure upwards on the weekly chart.
Cycle wave I fits as a five wave impulse with reasonably proportionate corrections for primary waves 2 and 4.
Cycle wave II fits as a double flat. However, within the first flat correction labelled primary wave W, this wave count needs to ignore what looks like an obvious triangle from July to September 2016 (this can be seen labelled as a triangle on the bear wave count above). This movement must be labelled as a series of overlapping first and second waves.
Within the first flat correction labelled primary wave W of the double flat of cycle wave II, intermediate wave (B) is 1.69 the length of intermediate wave (A). This is longer than the common range of up to 1.38, but within an allowable guideline of up to 2. The length of intermediate wave (B) reduces the probability of this wave count.
Cycle wave III may be complete. Cycle wave IV may not move into cycle wave I price territory below 1,303.51.
DAILY CHART
Click chart to enlarge.
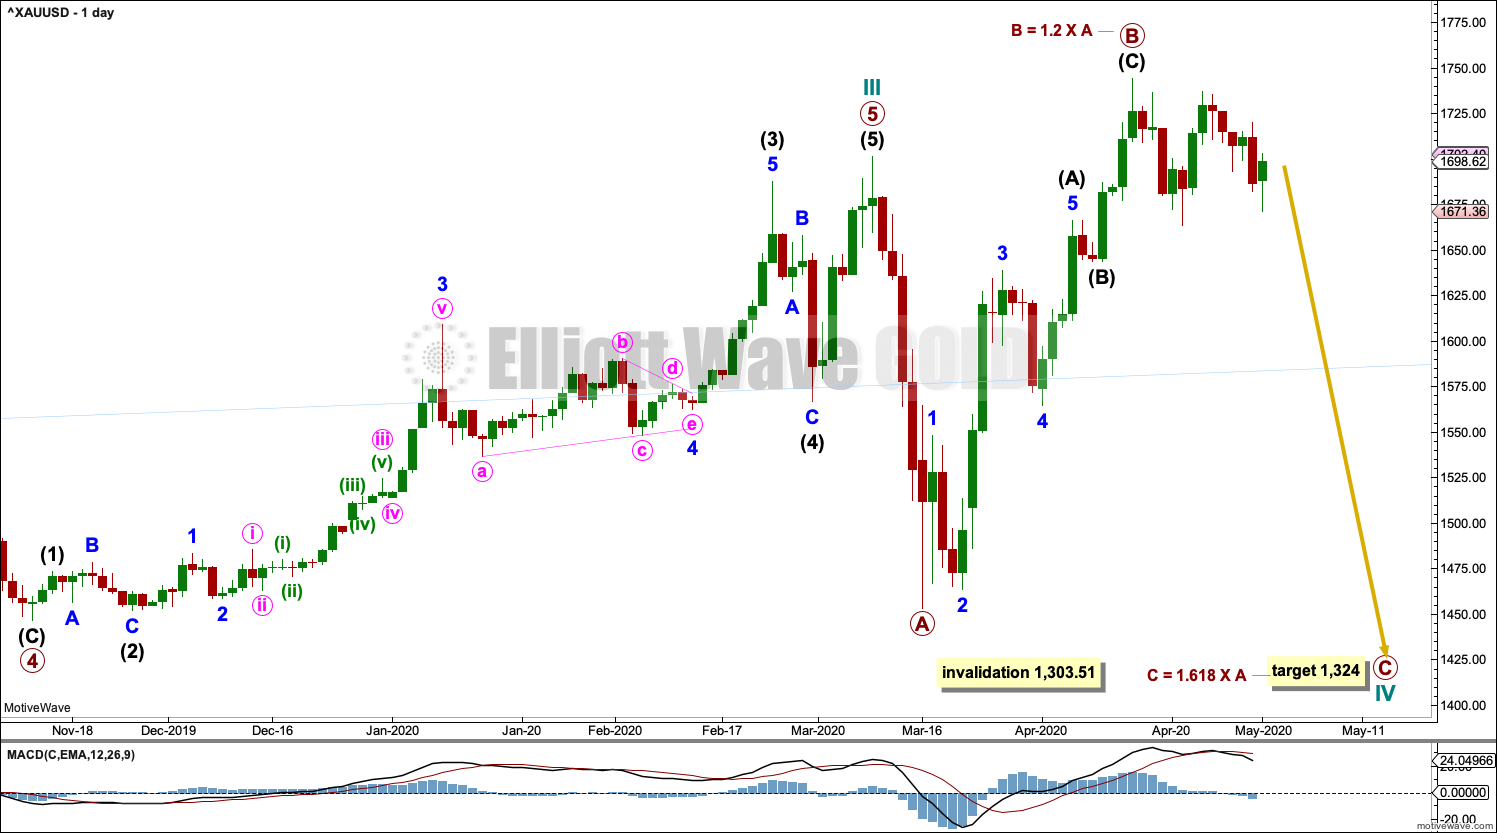
Cycle wave III may be complete. Cycle wave IV may not move into cycle wave I price territory below 1,303.51.
Cycle wave II was relatively deep at 0.55 of cycle wave I. If cycle wave IV exhibits alternation in depth, it may more likely be shallow.
Cycle wave IV may subdivide as a flat correction, triangle or combination. Both a flat and triangle would still provide structural alternation with the combination of cycle wave II.
If cycle wave IV subdivides as a flat correction, then within it the common range for primary wave B within a flat would be from 1 to 1.38 times the length of primary wave A. If primary wave B is now over, then it is within this most common range.
If cycle wave IV subdivides as a triangle, then within it primary wave B may make a new high above the start of primary wave A as in a running triangle.
Primary wave B may be a complete zigzag.
There is no upper invalidation point for this wave count. It is possible that primary wave B may continue higher.
TECHNICAL ANALYSIS
WEEKLY CHART
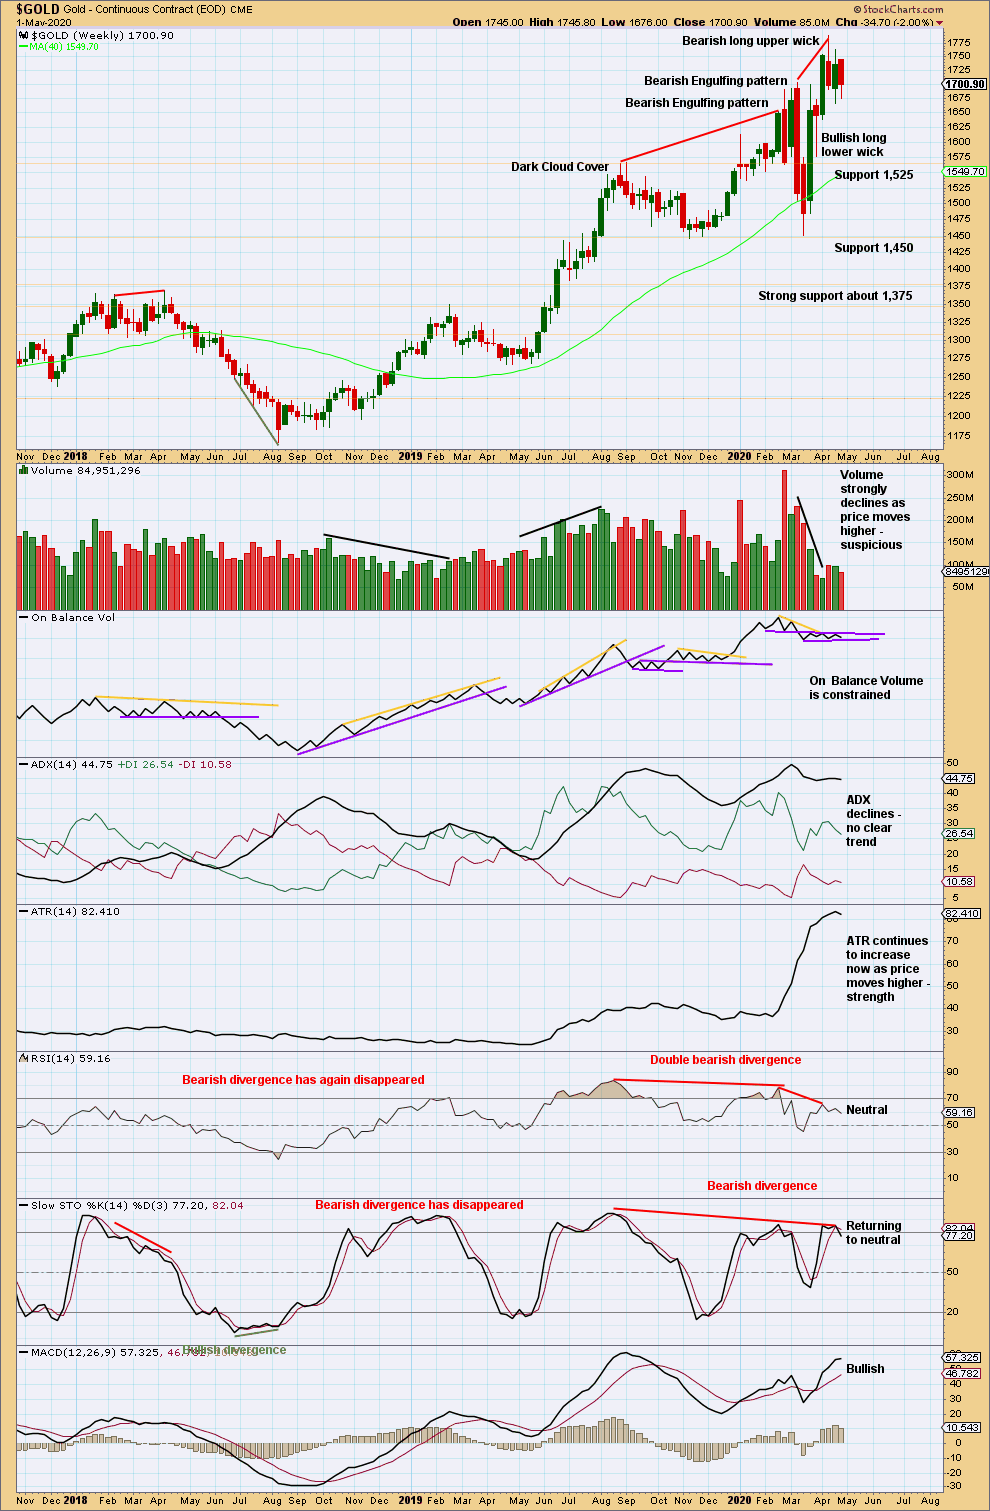
Click chart to enlarge. Chart courtesy of StockCharts.com.
Extreme bullish conditions at the last high with bearish divergence between price and RSI indicate the risk of a trend change here is high.
DAILY CHART
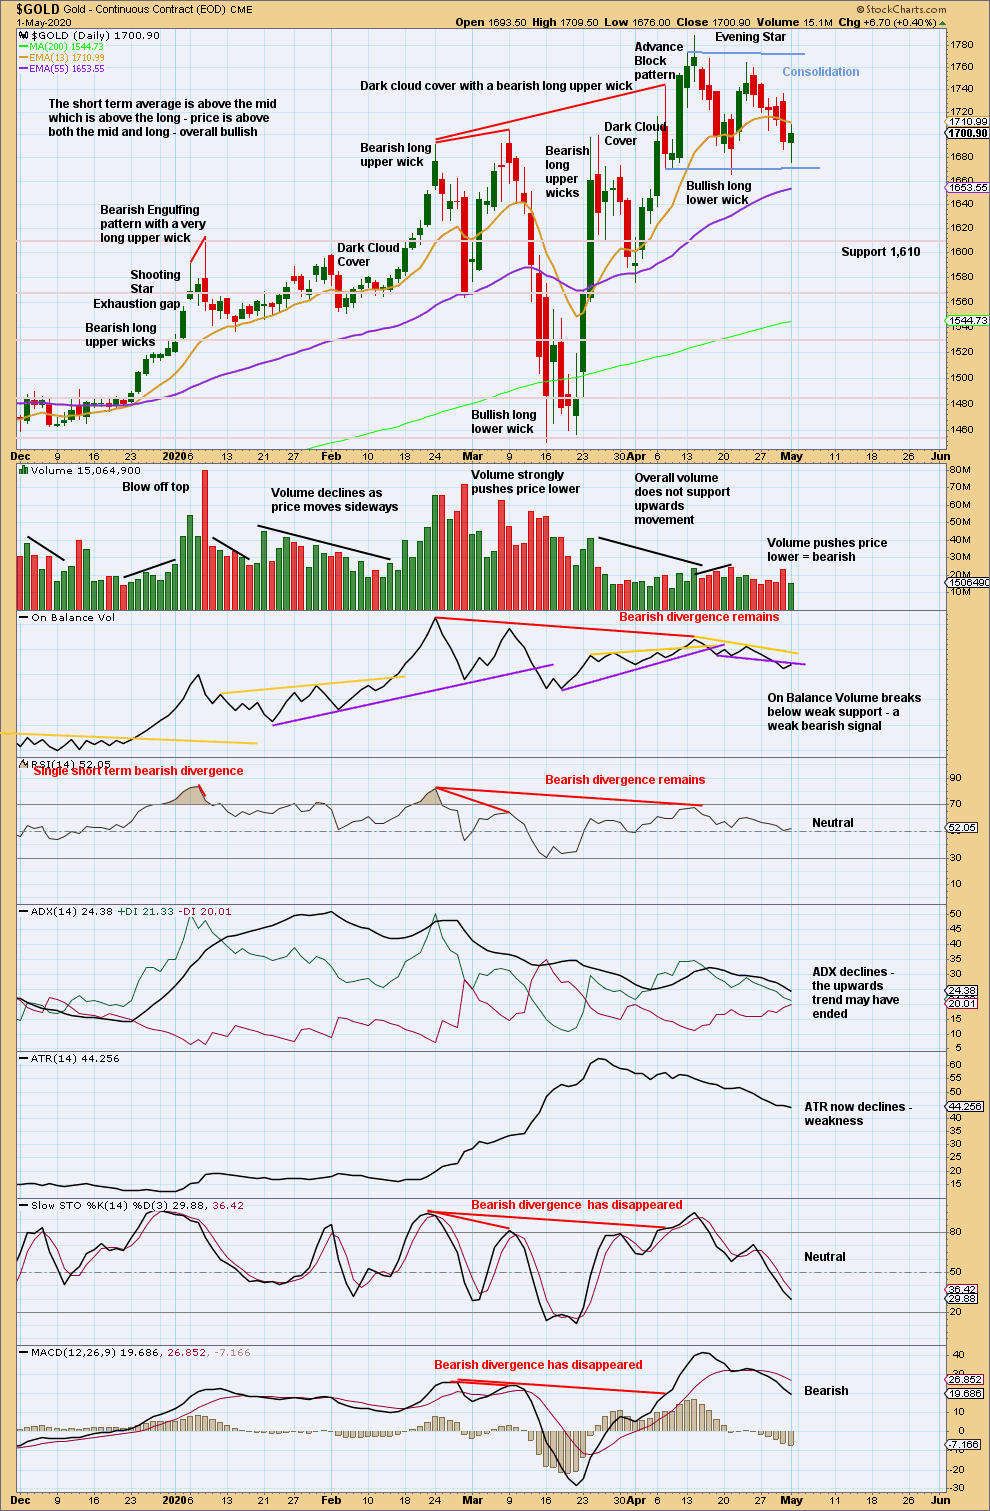
Click chart to enlarge. Chart courtesy of StockCharts.com.
An Advance Block pattern, a long upper wick, and now an Evening Star pattern are all bearish reversal signs. Mid-term bearish divergence between price and RSI increases the bearishness of these signals.
Currently, price is consolidating with resistance about 1,770 and support about 1,670. A breakout of this range is required before confidence in the next direction may be had.
GDX WEEKLY CHART
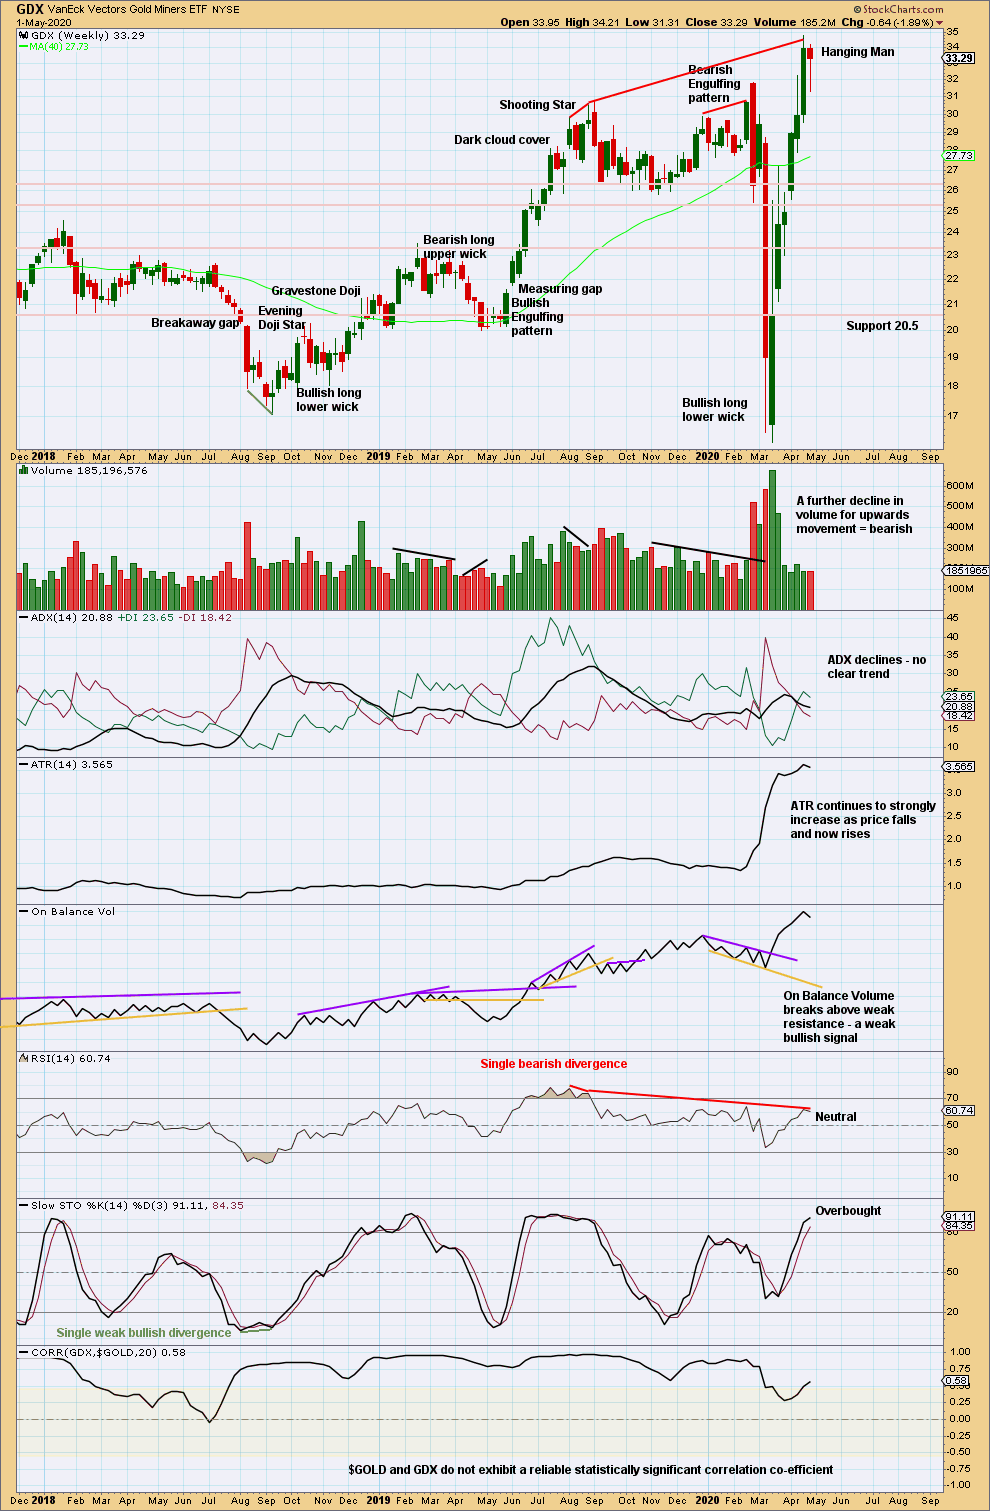
Click chart to enlarge. Chart courtesy of StockCharts.com.
The long lower wick of a Hanging Man candlestick pattern has a bullish implication; but although a Hanging Man is a bearish reversal pattern, it requires bearish confirmation in the following candlestick for confidence thus making a Hanging Man essentially a two candlestick pattern.
A bearish reversal pattern with mid-term bearish divergence between price and RSI warns that the risk of a trend change here is high.
GDX DAILY CHART
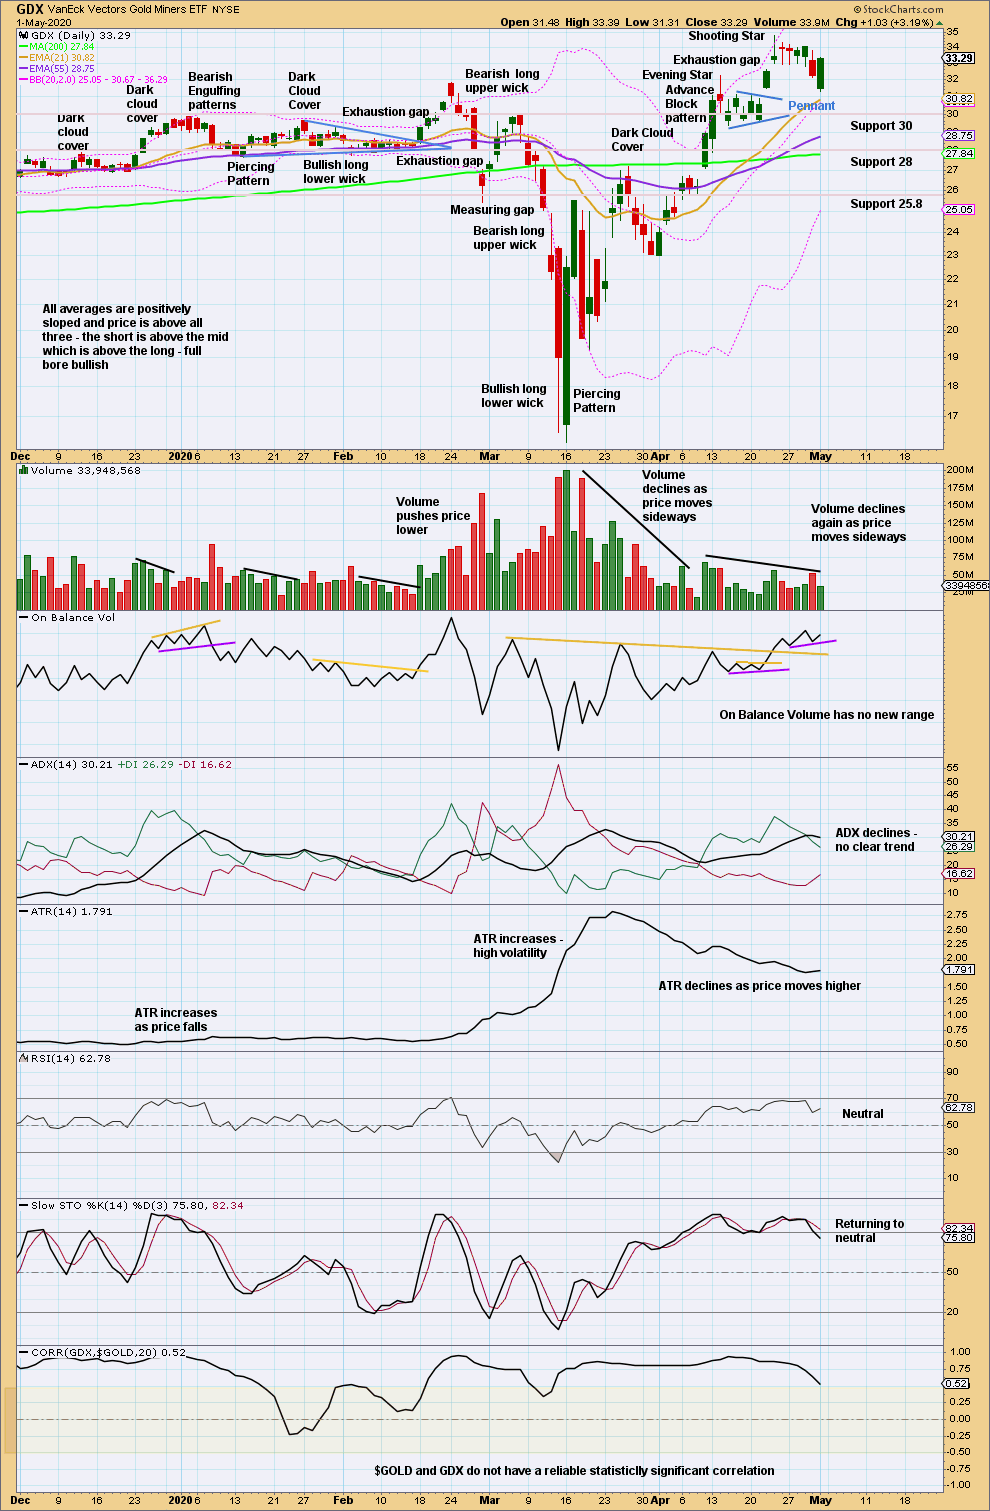
Click chart to enlarge. Chart courtesy of StockCharts.com.
Closure of the last gap indicates it is an exhaustion gap. A trend change is possible.
This last daily candlestick is not technically a Bullish Engulfing pattern because it does not come after a downwards trend (downwards movement is too brief and hesitant to be considered a trend). For a candlestick pattern to be read as a reversal pattern, there should be something to reverse.
US OIL
Last week’s analysis expected a sustainable low may have been found for US Oil. An upwards week was expected, which is how price has behaved so far.
Summary: Oil may have found a major sustainable low. Technical analysis supports this view. Confidence in this view may be had with a new high above 29.14.
If price does keep falling, then the target remains at 9.77.
MAIN ELLIOTT WAVE COUNT – BEARISH
MONTHLY CHART
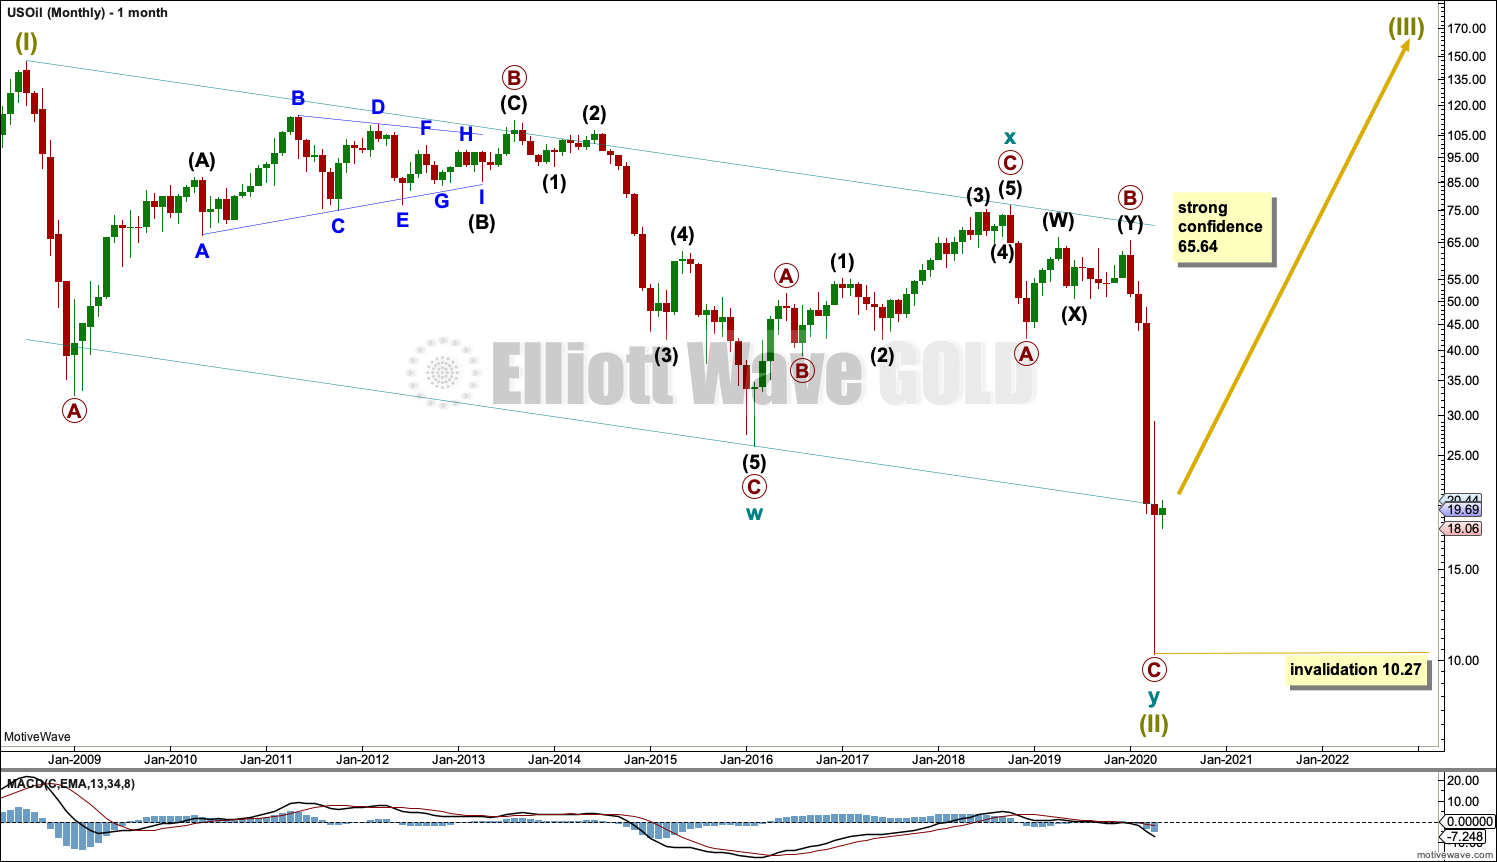
Click chart to enlarge.
The basic Elliott wave structure is five steps forward and three steps back. This Elliott wave count expects that US Oil has completed a three steps back pattern, which began in July 2008. The Elliott wave count expects that the bear market for US Oil may now be over.
This Elliott wave corrective structure is a double zigzag, which is a fairly common structure. The correction is labelled Super Cycle wave (II).
The first zigzag in the double is complete and labelled cycle wave w. The double is joined by a three in the opposite direction labelled cycle wave x, which subdivides as a zigzag. The second zigzag in the double is almost complete, labelled cycle wave y.
The purpose of a second zigzag in a double zigzag is to deepen the correction when the first zigzag does not move price deep enough. To achieve this purpose cycle wave y may be expected to move reasonably below the end of cycle wave w at 26.06. This purpose has now been achieved. The structure within primary wave C may now be complete.
A channel is drawn about Super Cycle wave (II): draw the first trend line from the start of cycle wave w to the end of cycle wave x, then place a parallel copy on the end of cycle wave w. Price has bounced up off the channel. This trend line is breached, which is a typical look for the end of a movement for a commodity.
Following five waves up and three steps back should be another five steps up. Super Cycle wave (III) may last a generation and must make a new high above the end of Super Cycle wave (I) at 146.73.
Super Cycle wave (III) may last a generation. It may only subdivide as a five wave impulse. New trends for Oil usually start out very slowly with short first waves and deep time consuming second wave corrections. Basing action over a few years may now begin.
WEEKLY CHART
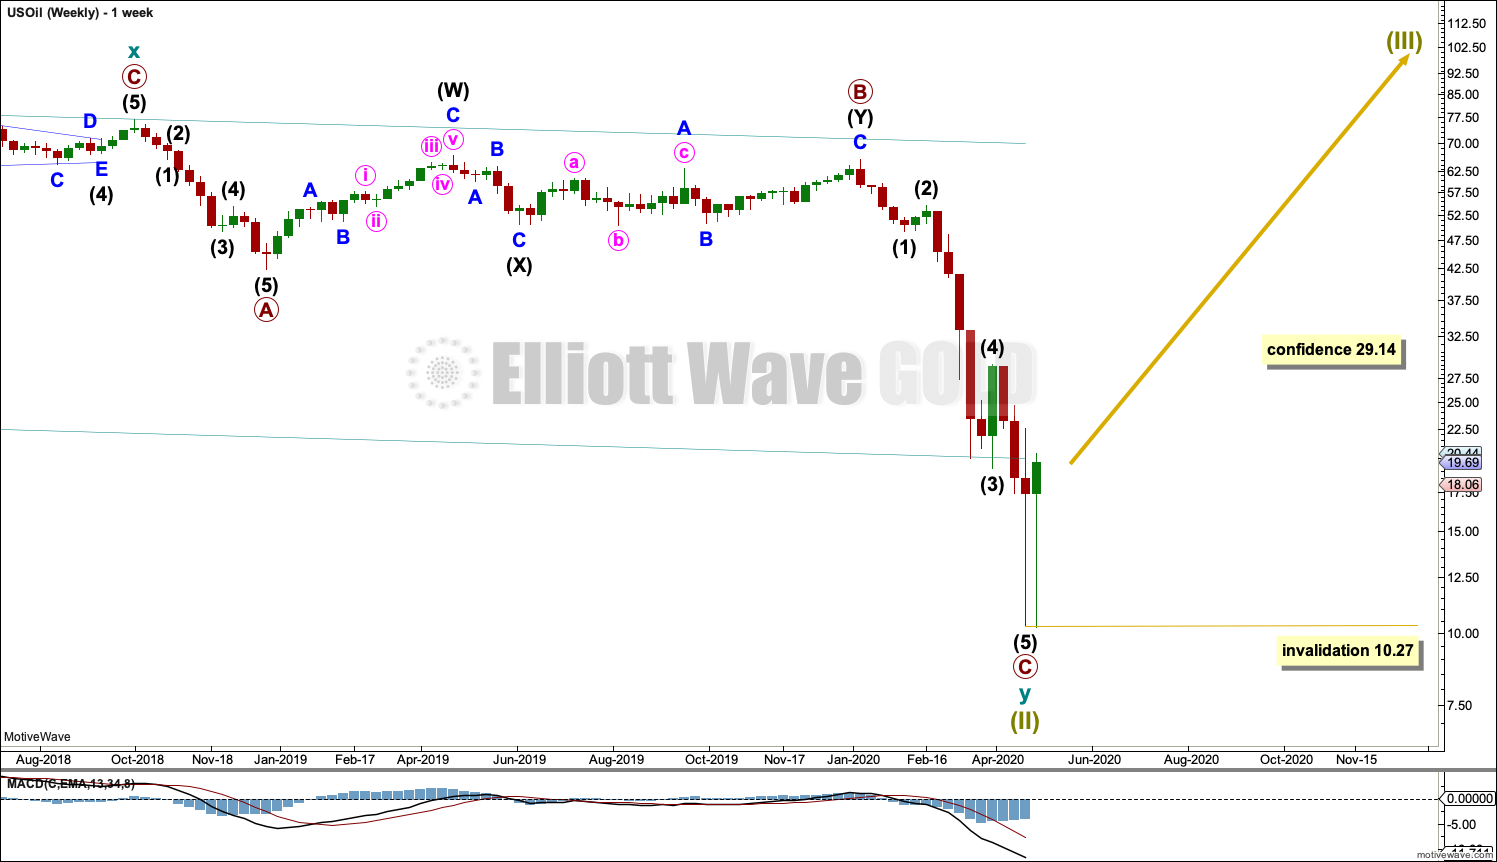
Click chart to enlarge.
This weekly chart shows all of cycle wave y.
Cycle wave y subdivides as a zigzag.
Primary wave C is now a complete five wave impulse.
Within Super Cycle wave (III): no second wave correction may move beyond the start of its first wave below 10.27.
DAILY CHART
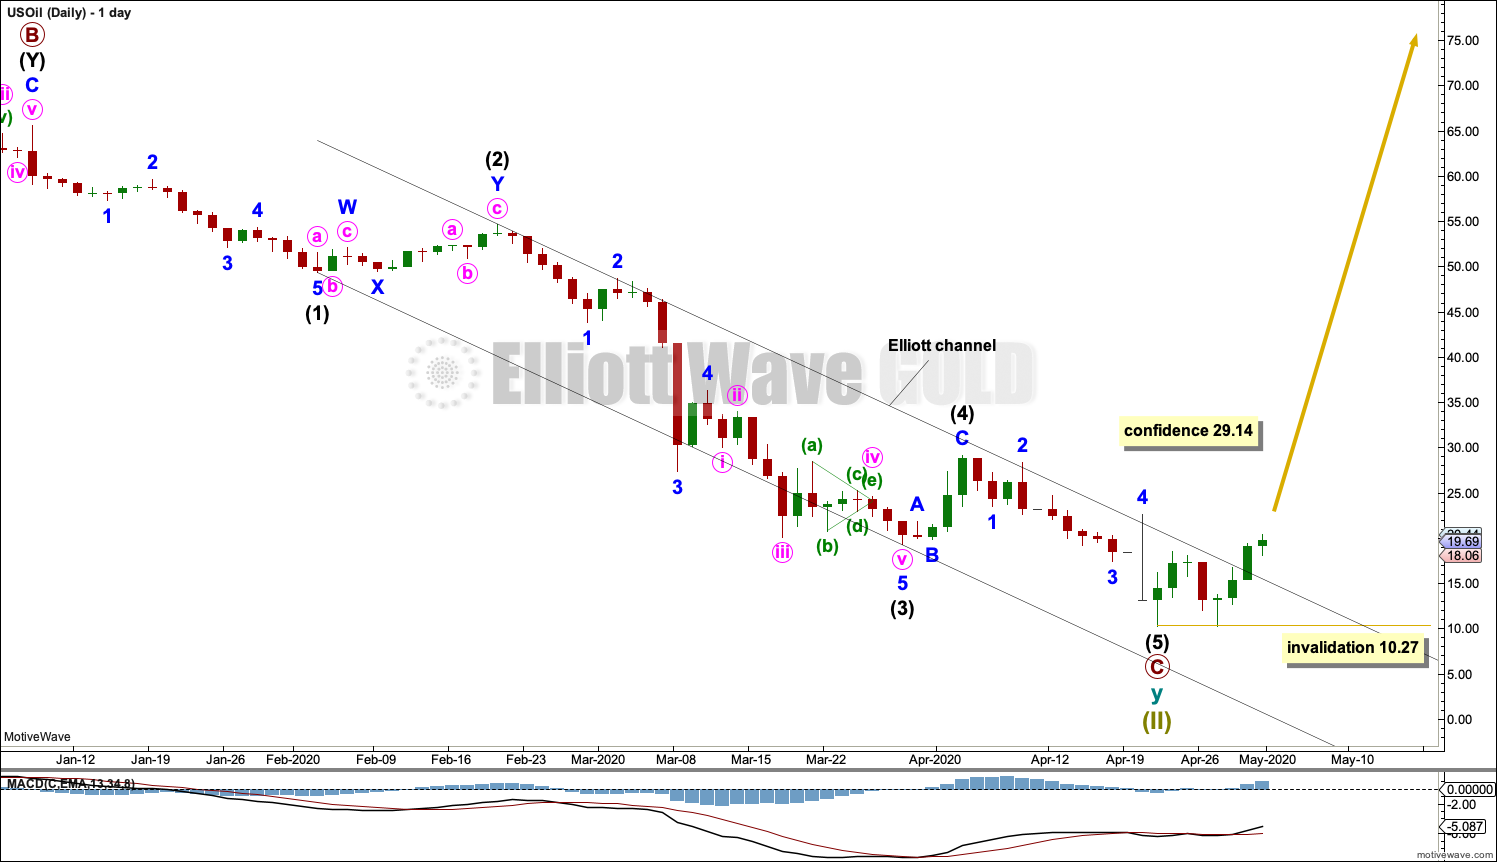
Click chart to enlarge.
Primary wave C may now be a complete five wave impulse.
Draw an Elliott channel about primary wave C. Draw the first trend line from the ends of intermediate waves (1) to (3), then place a parallel copy on the end of intermediate wave (2). A breach of this channel by upwards movement is now an early indication of a sustainable low.
Within a new trend: no second wave correction may move beyond the start of the trend, below 10.27.
ALTERNATE DAILY CHART
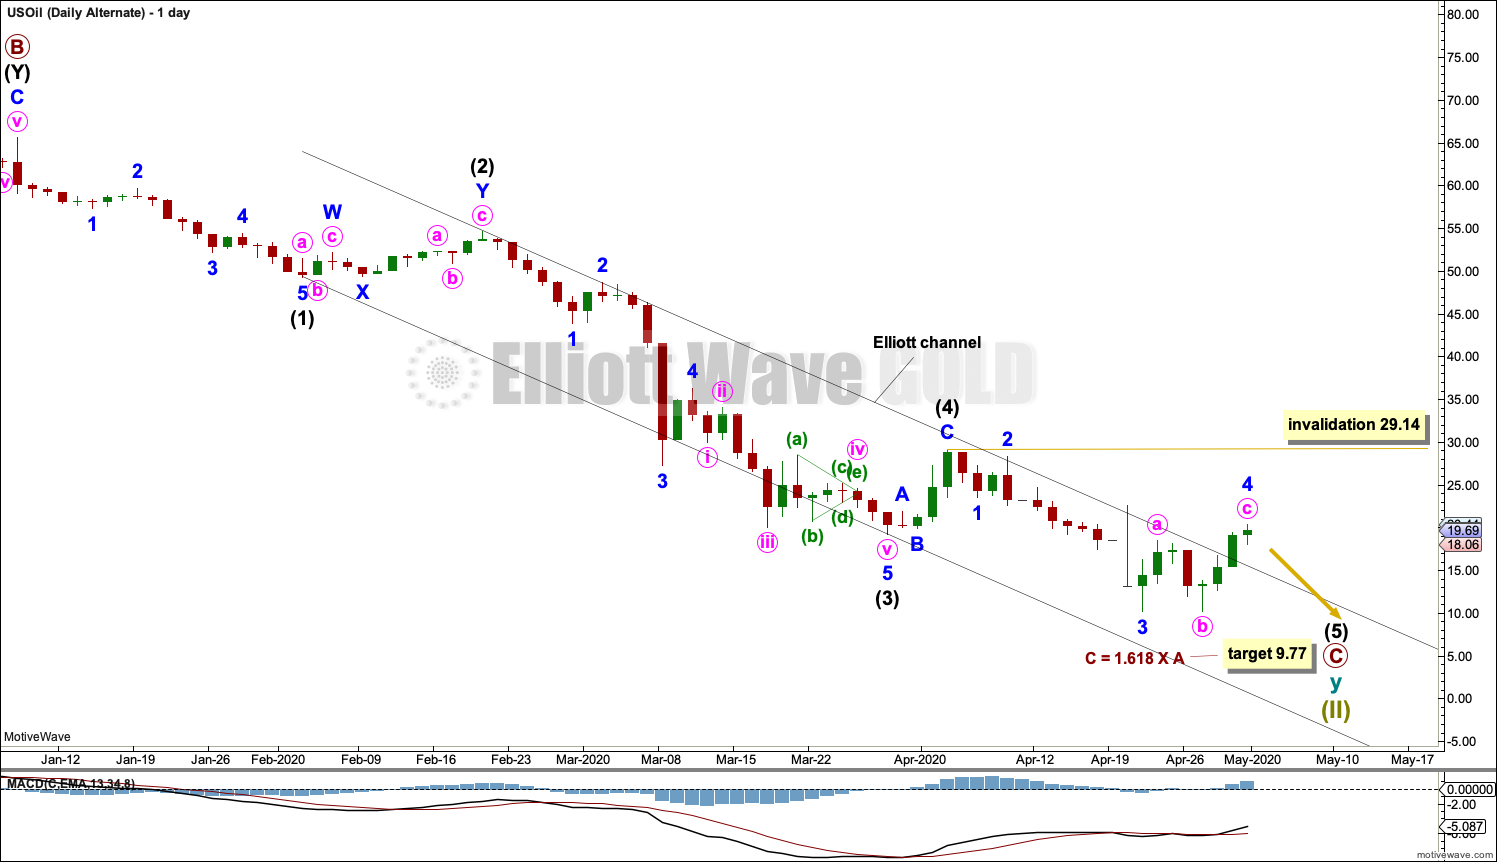
Click chart to enlarge.
It is still possible that primary wave C may be not quite complete. The target remains the same.
Within intermediate wave (5): no second wave correction may move beyond its start above 29.14. The invalidation point is moved up to this point to be more conservative.
A breach of the channel reduces the probability of this wave count this week, but it remains technically valid.
ALTERNATE ELLIOTT WAVE COUNT
MONTHLY CHART
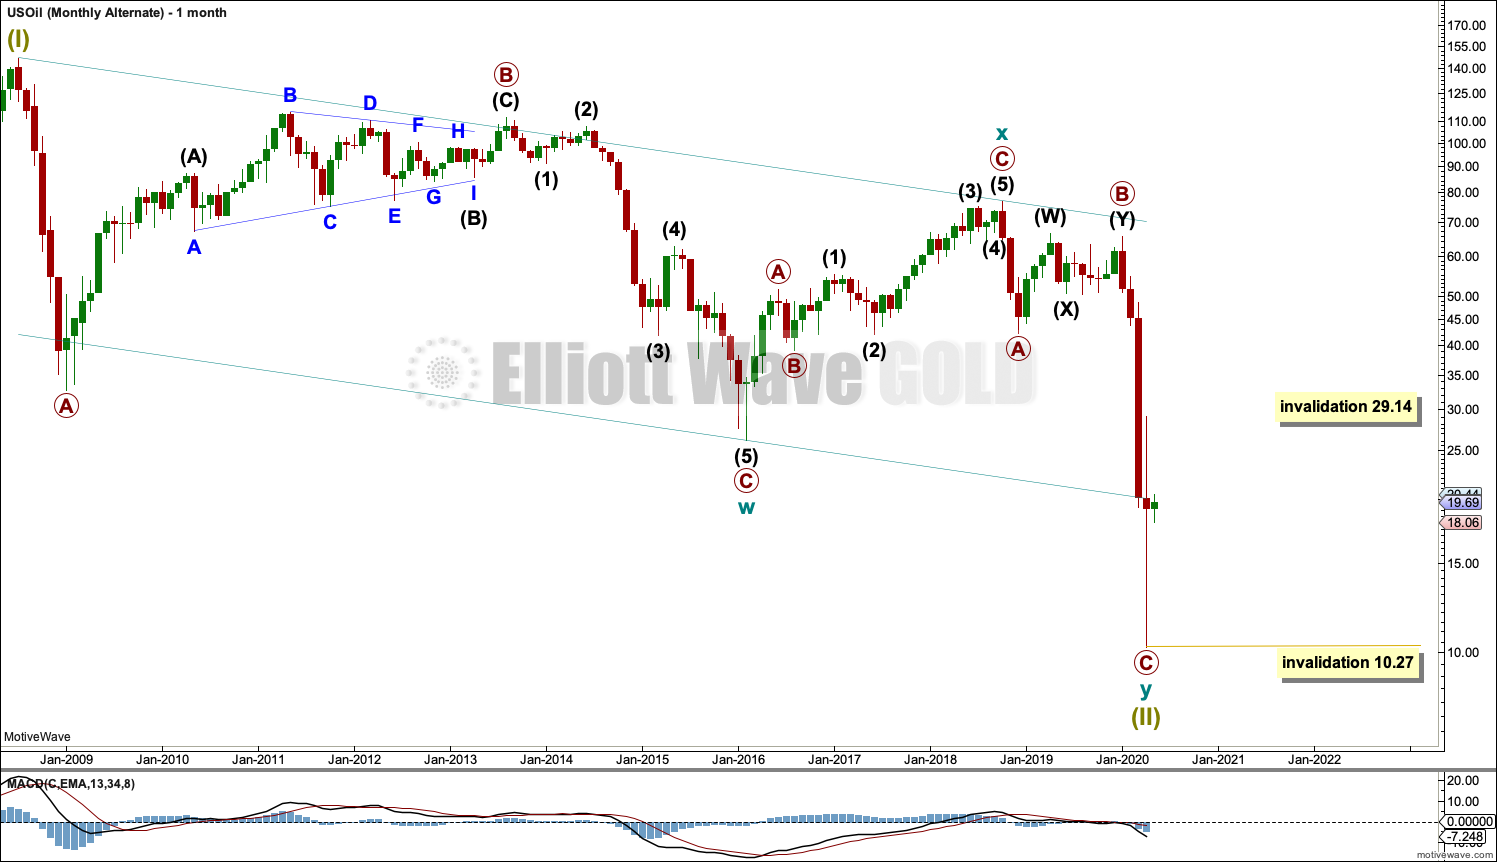
Click chart to enlarge.
This chart tries to illustrate another possibility, that it may be possible that the market for Oil could cease to exist. The difference between this alternate monthly chart and the main monthly chart is that this chart has no upwards (orange) arrow pointing to Super Cycle wave (III).
There is some historical precedent for this. Throughout history, occasionally, bubbles may form then burst and then the market may cease to exist. One of the most famous examples may be the price of tulips following the burst of the tulip bubble in 1637. Tulip prices never again recovered bubble heights.
From a fundamental point of view this concept may encompass new emerging technologies that may replace old oil reliant technologies.
TECHNICAL ANALYSIS
MONTHLY CHART
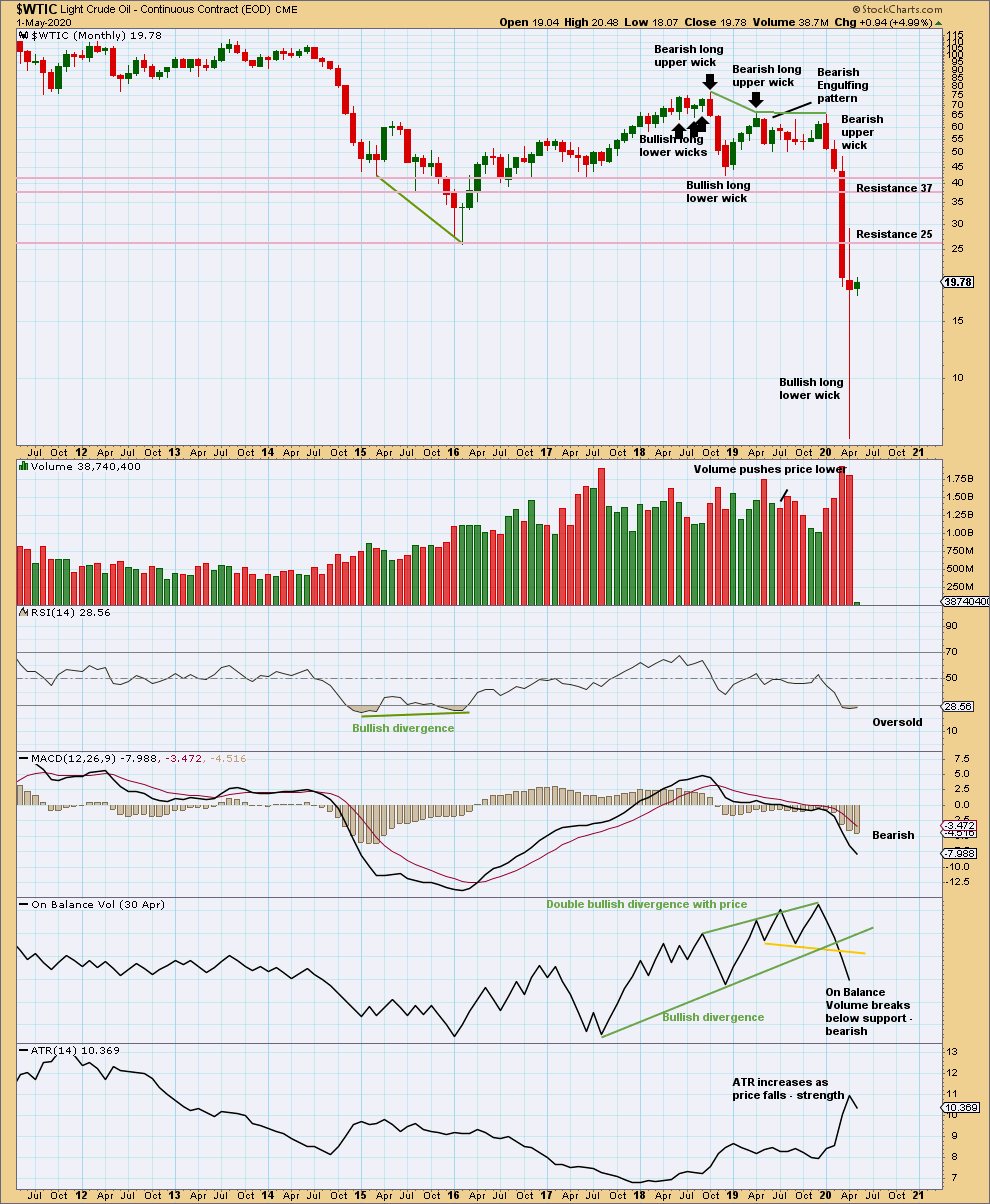
Click chart to enlarge. Chart courtesy of StockCharts.com.
April has closed with a very bullish long lower wick. With conditions oversold at lows, the probability of a trend change here is high.
WEEKLY CHART
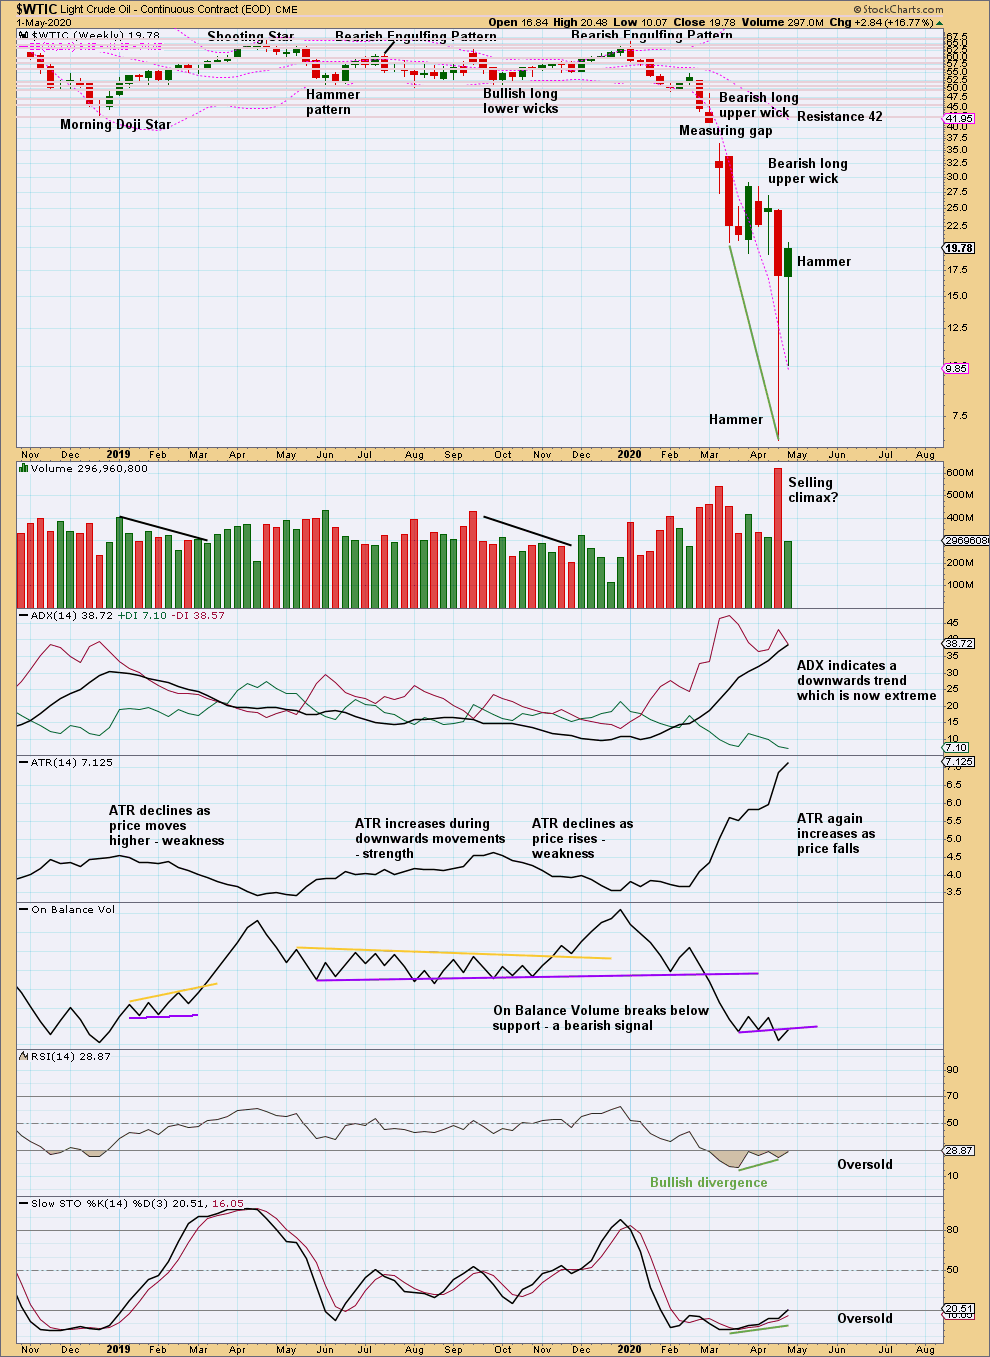
Click chart to enlarge. Chart courtesy of StockCharts.com.
Now two bullish reversal patterns with RSI reaching oversold and then exhibiting bullish divergence suggest a low may now be in place.
DAILY CHART
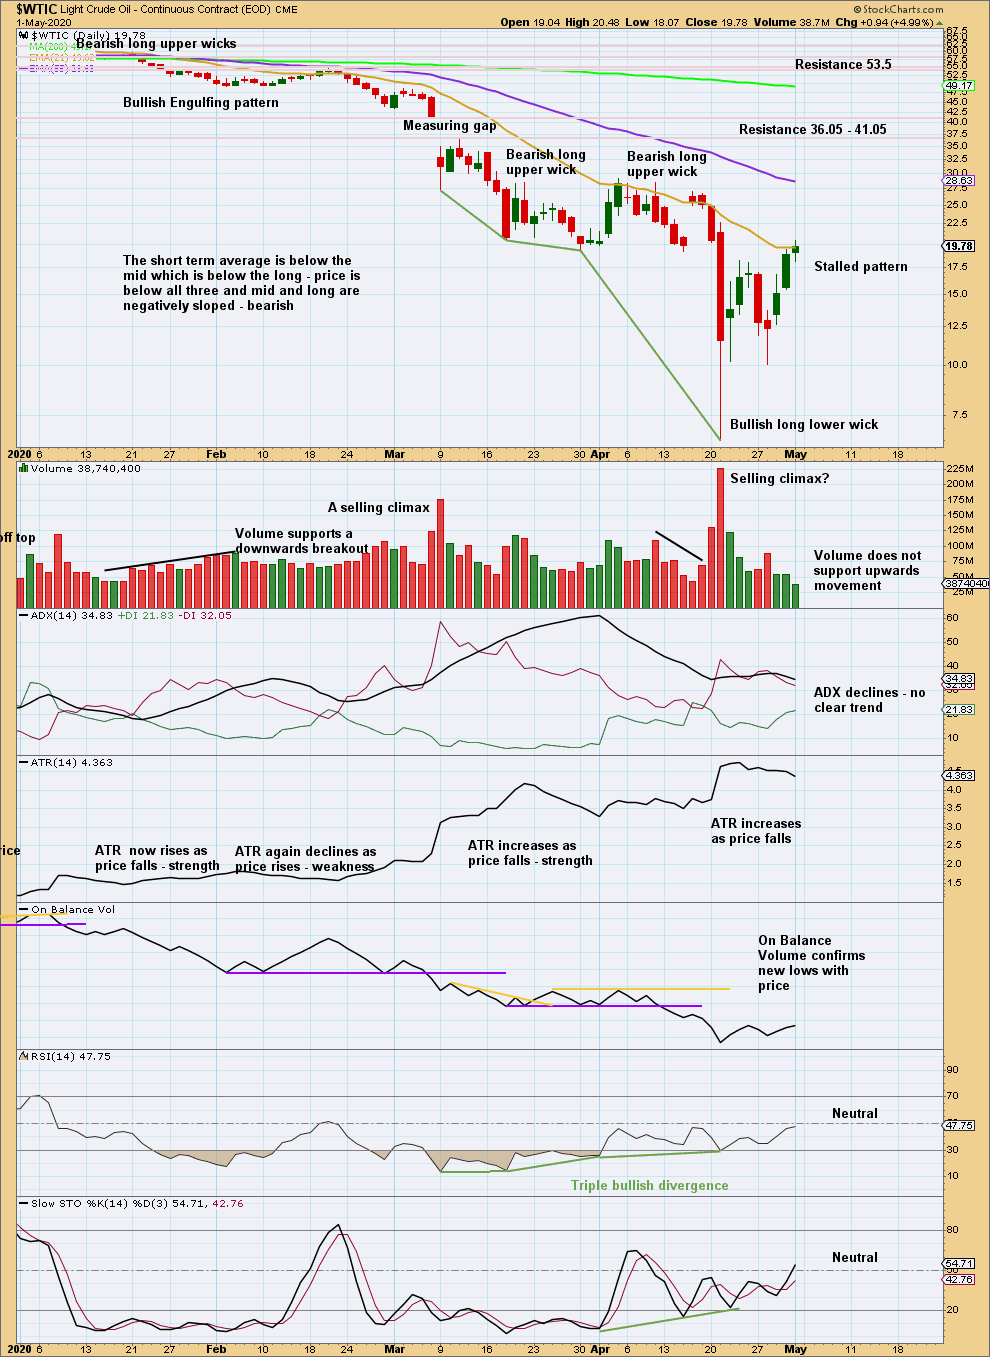
Click chart to enlarge. Chart courtesy of StockCharts.com.
Upwards movement is weak, so it is possible that the low may be tested. However, with conditions oversold and bullish long lower wicks, the low may reasonably be expected to be found very soon if it is not in yet.
—
Always practice good risk management as the most important aspect of trading. Always trade with stops and invest only 1-5% of equity on any one trade. Failure to manage risk is the most common mistake new traders make.