
Lara’s Weekly: Elliott Wave and Technical Analysis of S&P500 and Gold and US Oil | Charts – May 22, 2020

S&P 500
Price remains above identified support. The Elliott wave targets remain the same.
Summary: Targets remain at 3,058 or 3,238. Use the lower edge of the redrawn Elliott channel to indicate where support may be found on the way up.
In the short term, then the bounce may be over and the bear market may have resumed if the following are seen:
1. A bearish candlestick reversal pattern.
2. A breach of the black upwards sloping Elliott channel on the main daily chart.
3. A new low below 2,766.64.
This bounce that began on 23rd of March is still expected to be a counter trend bounce within an ongoing bear market. When the bounce is complete, then the bear market is expected to resume with strength.
The biggest picture, Grand Super Cycle analysis, is here.
Last monthly charts are here. Video is here. Members are encouraged to view all three monthly charts. The third is much more bearish than this main wave count and remains a valid possibility.
ELLIOTT WAVE COUNTS
WEEKLY CHART
Click chart to enlarge.
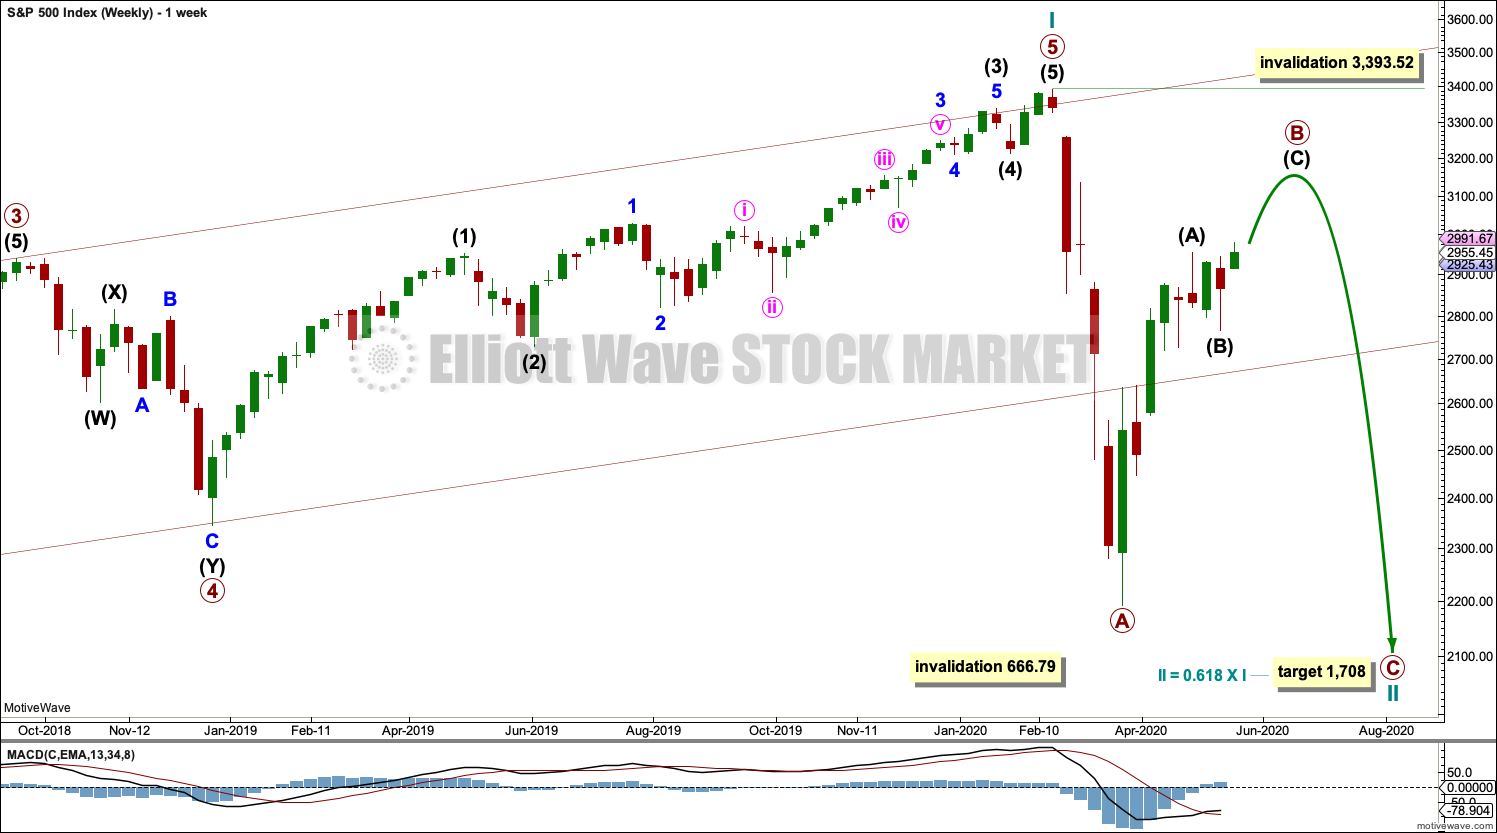
This main Elliott wave count expects that the bull market beginning in March 2009 was cycle wave I of Super Cycle wave (V). The trend change in February 2020 may have been only at cycle degree. Cycle wave II may last from one to a few years.
Cycle wave II would most likely subdivide as a zigzag; thus far that looks like what is unfolding. When primary waves A and B may both be complete, then the target may be calculated using a Fibonacci ratio between primary waves A and C. At that stage, the final target may change or widen to a zone.
Cycle wave II may not move beyond the start of cycle wave I below 666.79.
DAILY CHART
Click chart to enlarge.
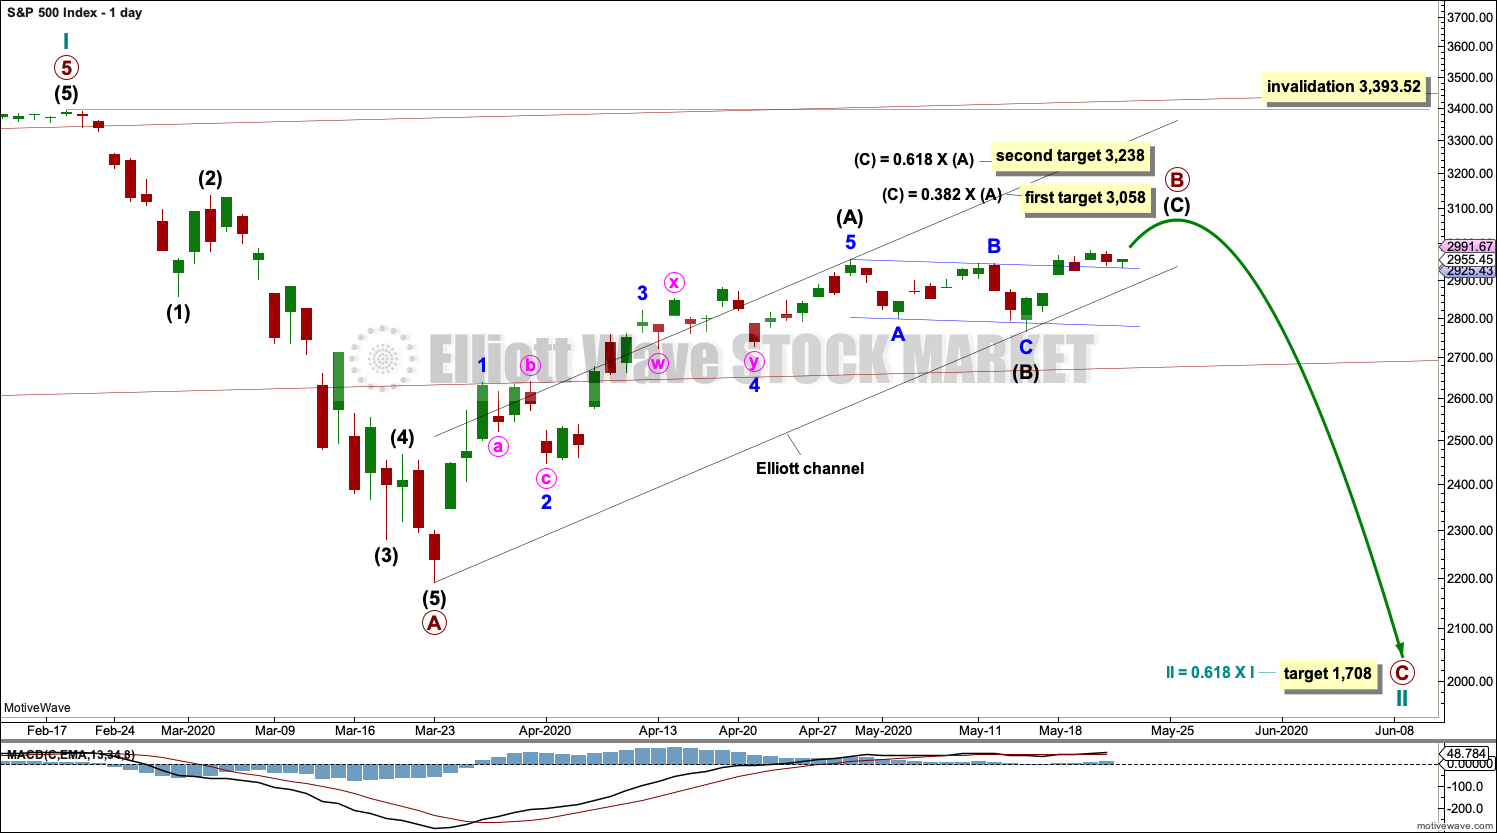
Draw the wide maroon trend channel carefully: draw the first trend line from the end of primary wave 1 at 2,093.55 (December 26, 2014), to the end of primary wave 3 at 2,940.91 (September 21, 2018), then place a parallel copy on the end of primary wave 2 at 1,810.10 (February 11, 2016). The channel is fully breached indicating a trend change from the multi-year bull trend to a new bear trend. Resistance at the lower edge has been overcome; price has closed above this trend line.
Cycle wave II may subdivide as any Elliott wave corrective structure except a triangle. It would most likely be a zigzag (zigzags subdivide 5-3-5). Primary wave A may be a complete five wave impulse downwards. Primary wave B may not move beyond the start of primary wave A above 3,393.52.
Draw a channel about primary wave B using Elliott’s technique for a correction. Draw the first trend line from the start of intermediate wave A to the end of intermediate wave B, then place a parallel copy on the end of intermediate wave A. Intermediate wave C may find resistance at the upper edge of the channel. While intermediate wave C unfolds higher, any smaller pullbacks within it may find support at the lower edge of this channel.
When this channel is breached by downwards movement, it would then indicate the bounce labelled primary wave B may be over and the next large downwards wave labelled primary wave C may then have begun.
ALTERNATE DAILY CHART
Click chart to enlarge.
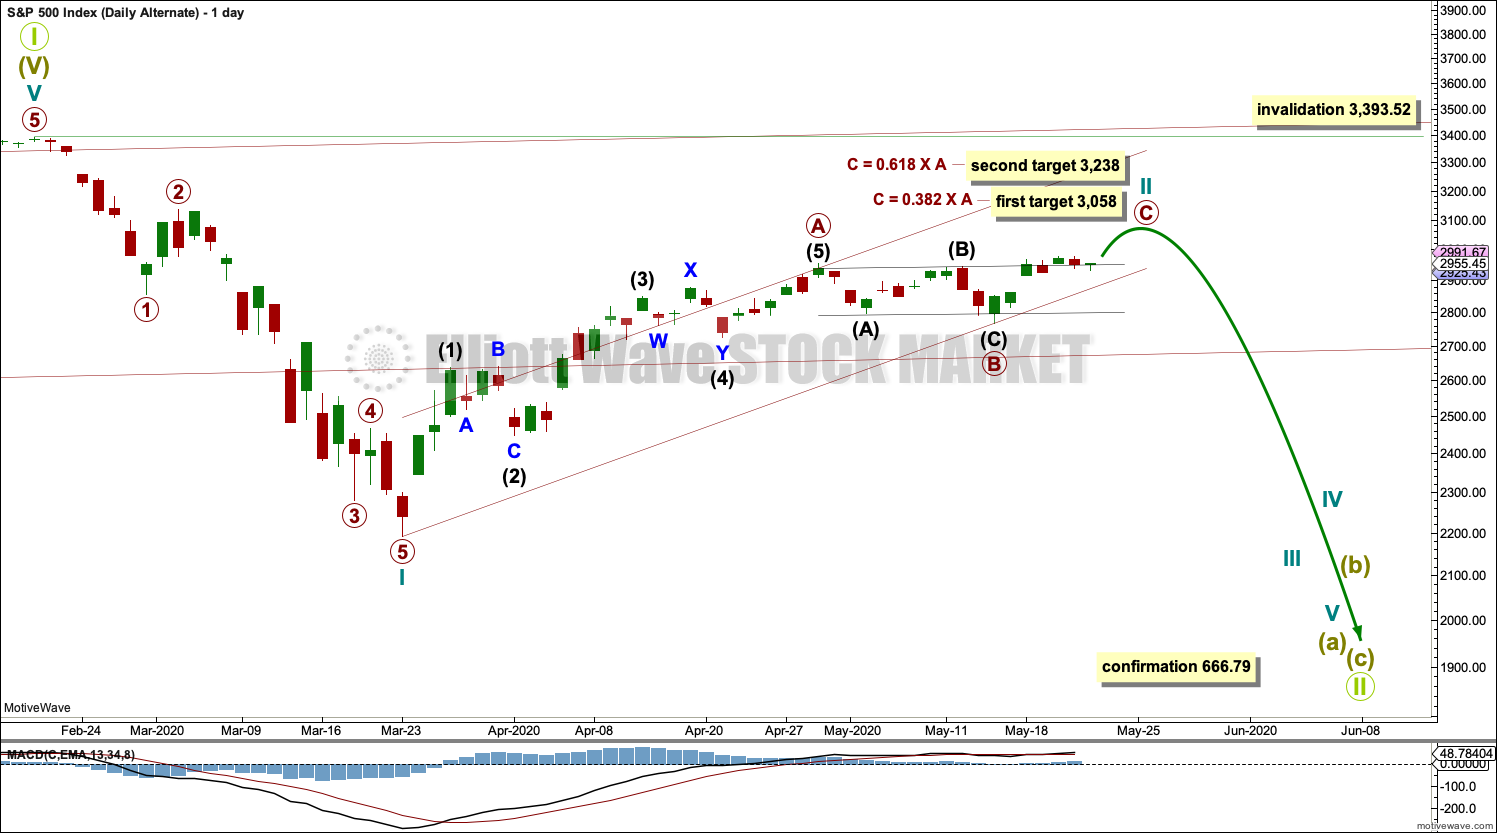
This alternate daily chart follows the Second Alternate Monthly chart published here. Video is here.
By simply moving the degree of labelling in the bull market beginning March 2009 up one degree, it is possible that a Grand Super Cycle trend change occurred on February 19, 2020. The bull market from March 2009 to February 2020 may have been a complete fifth wave labelled Super Cycle wave (V).
A bear market at Grand Super Cycle degree may be expected to last at least a decade, possibly longer. Corrections for this market tend to be much quicker than bullish moves, and so a fair amount of flexibility is required in expectations for duration of the different degrees.
Grand Super Cycle II would most likely subdivide as a zigzag, although it may be any corrective structure except a triangle. It should begin with a five down at the weekly chart time frame, which would be incomplete.
The first wave down on the daily chart is labelled cycle wave I. If this degree of labelling is wrong, it may be too high; it may need to be moved down one degree.
Following cycle wave I, cycle wave II may be continuing higher as a zigzag. Cycle wave II may not move beyond the start of cycle wave I above 3,393.52.
When cycle wave II may again be complete, then a target for cycle wave III may be calculated.
TECHNICAL ANALYSIS
WEEKLY CHART
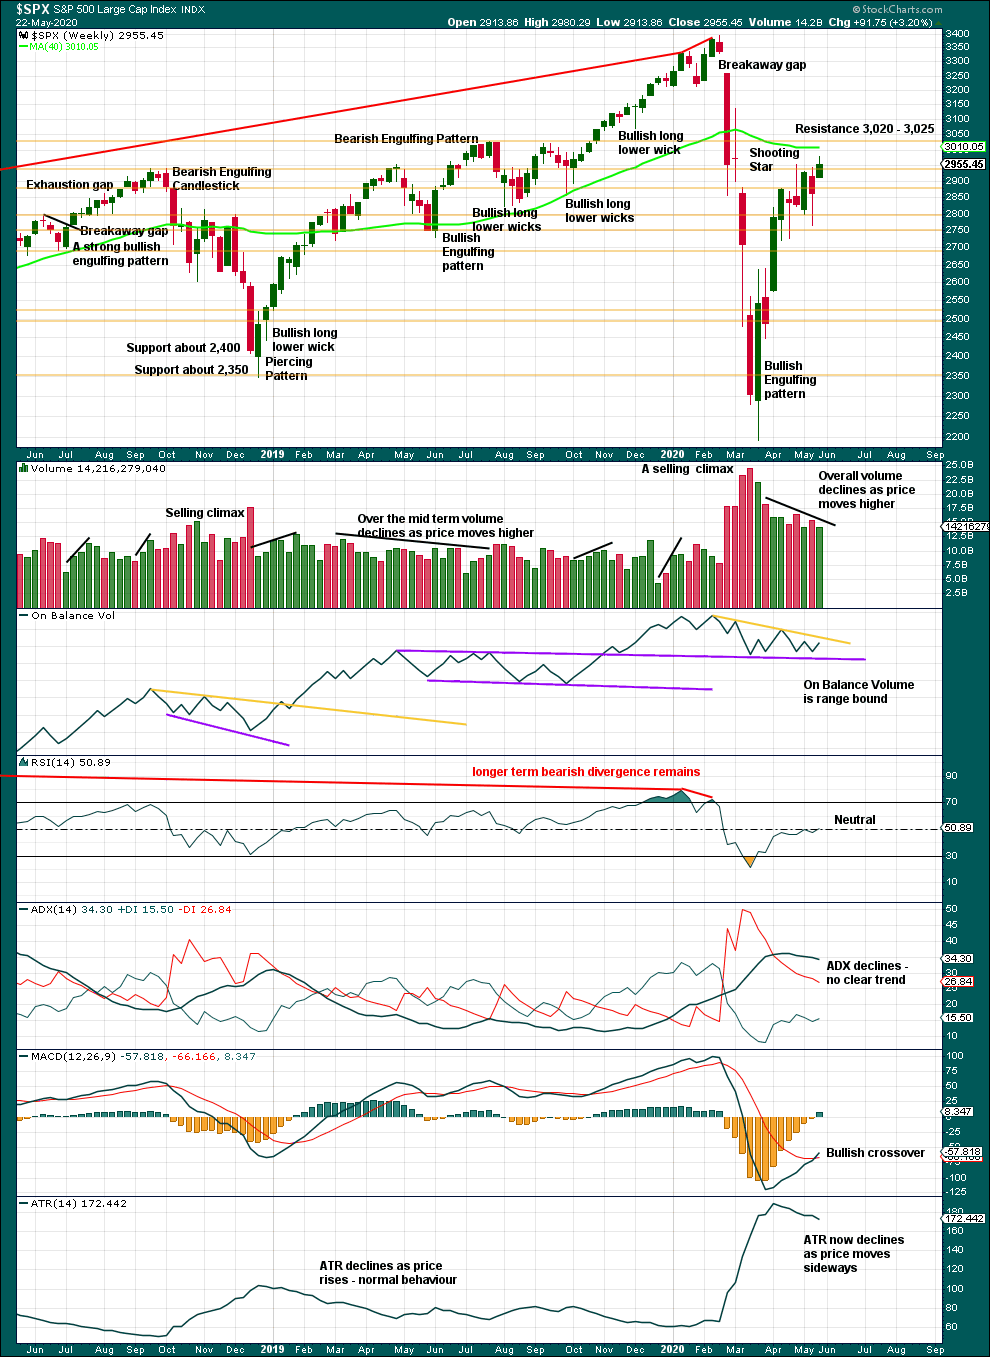
Click chart to enlarge. Chart courtesy of StockCharts.com.
Both price and On Balance Volume have resistance just above. Upwards movement may be limited. The bounce has both declining volume and range, exhibiting weakness. This supports the Elliott wave count.
DAILY CHART
Click chart to enlarge. Chart courtesy of StockCharts.com.
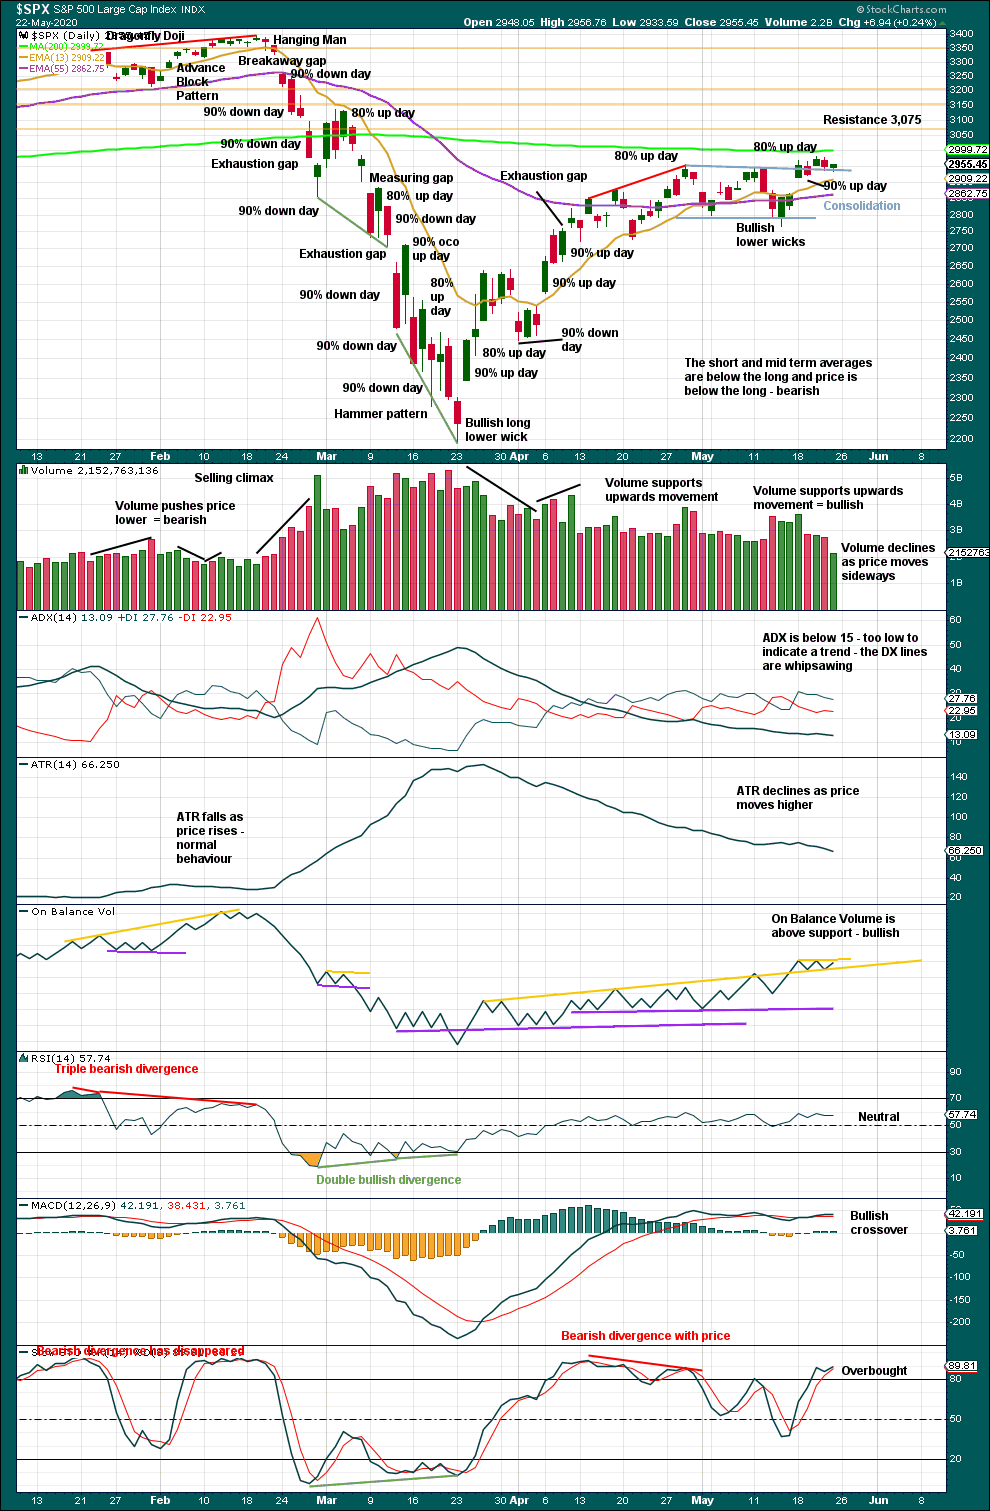
In the bear market from October 2000 to March 2009, the first multi-day bounce retraced 0.73 of the first wave down. In the bear market from March 2000 to October 2002, the first multi-day bounce retraced 0.89 of the first wave down. So far this current bounce has retraced 0.66 of the first wave down, so it seems reasonable that it could continue higher. However, it is now very near a normal level for the first big retracement. Resistance just above from the 200 day moving average and 3,075 may halt a rise in price.
To see what signals may be looked for to identify a high, the two previous large bear markets were analysed in end of week analysis. The DotCom crash was analysed here with video here. The Global Financial Crisis was also analysed here with video here.
In recent days there has been one 90% up day and now an 80% up day. There is enough strength in upwards movement to expect it to continue at least for the short term.
BREADTH – AD LINE
WEEKLY CHART
Click chart to enlarge. Chart courtesy of StockCharts.com. So that colour blind members are included, bearish signals will be noted with blue and bullish signals with yellow.
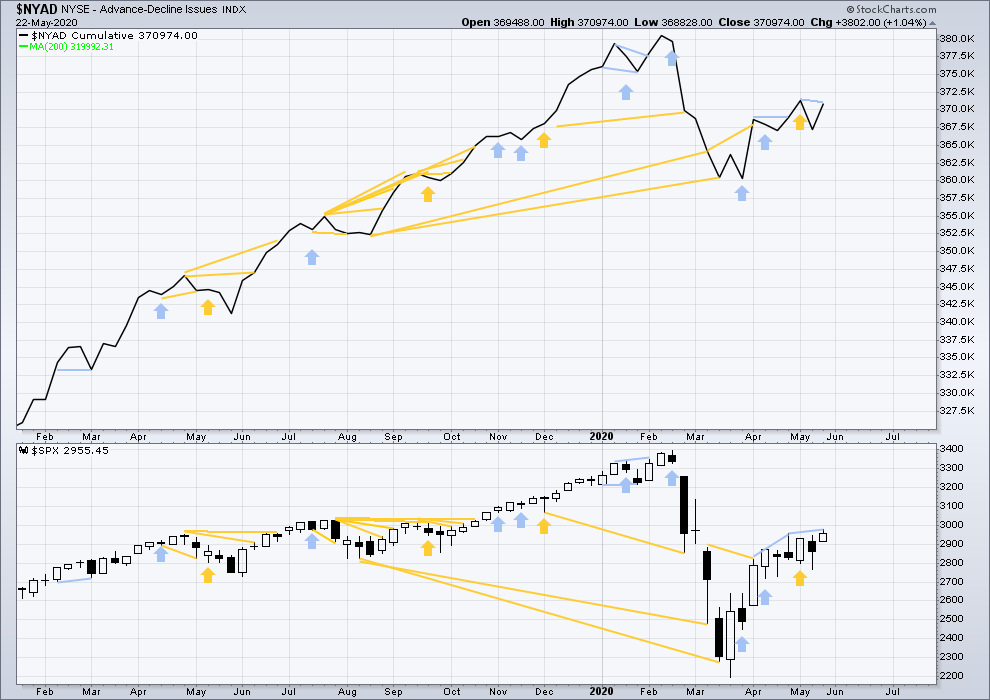
Breadth should be read as a leading indicator.
This week price has made a slight new high above the prior swing high of 2-3 weeks ago, but the AD line has not. Upwards movement lacks support from a corresponding rise in market breadth. This divergence is bearish.
Large caps all time high: 3,393.52 on 19th February 2020.
Mid caps all time high: 2,109.43 on 20th February 2020.
Small caps all time high: 1,100.58 on 27th August 2018.
DAILY CHART
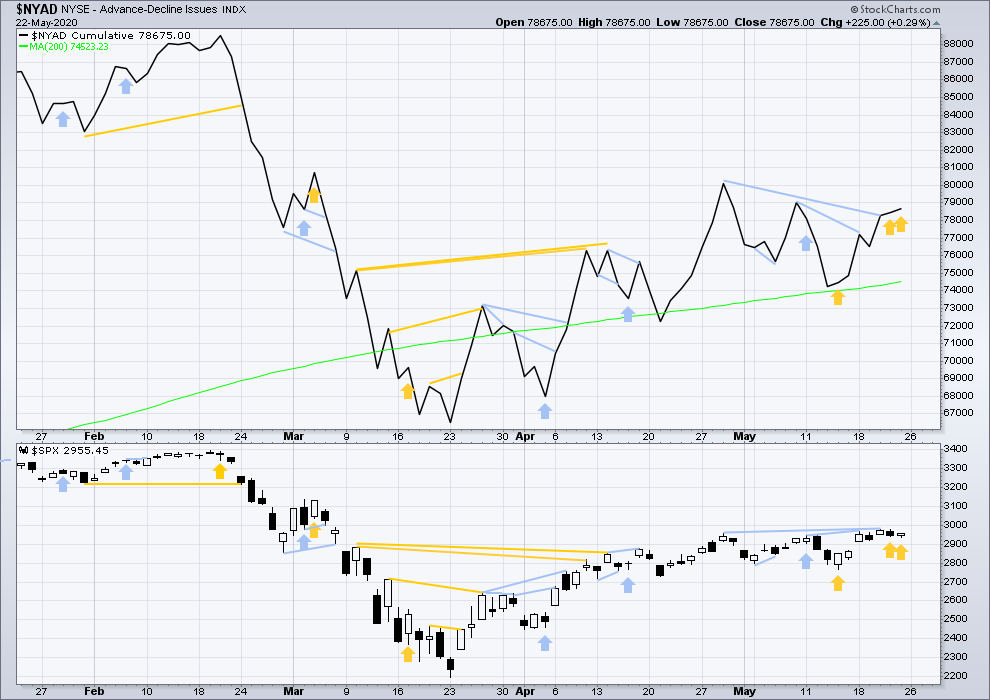
Click chart to enlarge. Chart courtesy of StockCharts.com. So that colour blind members are included, bearish signals will be noted with blue and bullish signals with yellow.
Price has moved lower, but the AD line has moved higher. This bullish divergence suggests more upwards movement early next week.
VOLATILITY – INVERTED VIX CHART
WEEKLY CHART
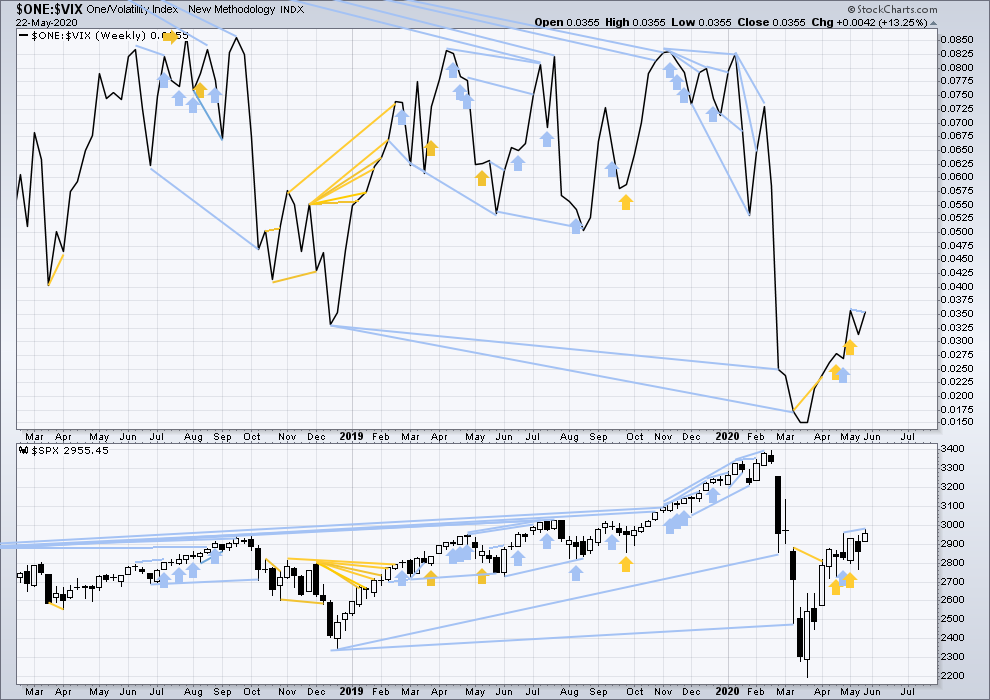
Click chart to enlarge. Chart courtesy of StockCharts.com. So that colour blind members are included, bearish signals will be noted with blue and bullish signals with yellow.
This week price has made a slight new high above the prior very short-term swing high 2-3 weeks ago, but inverted VIX has not. This divergence is bearish. It is short term and weak.
DAILY CHART
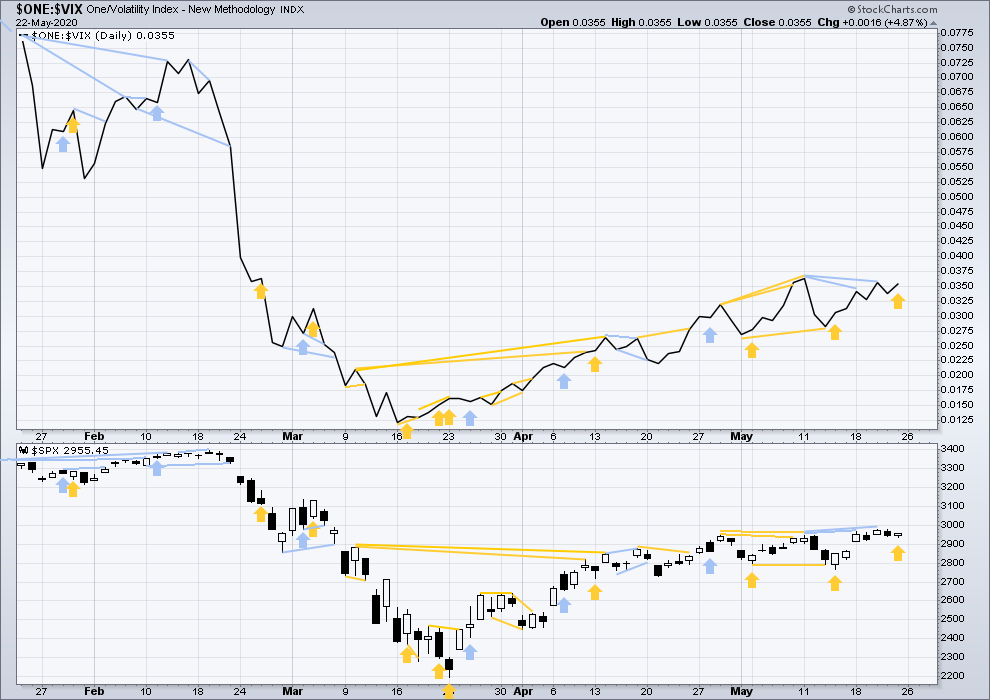
Click chart to enlarge. Chart courtesy of StockCharts.com. So that colour blind members are included, bearish signals will be noted with blue and bullish signals with yellow.
On Friday price has moved slightly lower, but inverted VIX has moved higher. This divergence is bullish and very short term.
DOW THEORY
Dow Theory has confirmed a bear market with the following lows made on a closing basis:
DJIA: 21,712.53 – a close below this point has been made on the March 12, 2020.
DJT: 8,636.79 – a close below this point has been made on March 9, 2020.
Adding in the S&P and Nasdaq for an extended Dow Theory, a bear market has now been confirmed:
S&P500: 2,346.58 – a close below this point has now been made on March 20, 2020.
Nasdaq: 7,292.22 – a close below this point was made on the March 12, 2020.
GOLD
A small range inside day leaves all three Elliott wave counts valid.
Summary: The target is at 1,980. This target is valid only while price remains above 1,693.39.
If price breaks below 1,693.39, then expect continuing downwards movement to at least 1,362.
Grand SuperCycle analysis is here.
Monthly charts were last updated here.
MAIN BEARISH ELLIOTT WAVE COUNT
WEEKLY CHART
Click chart to enlarge.
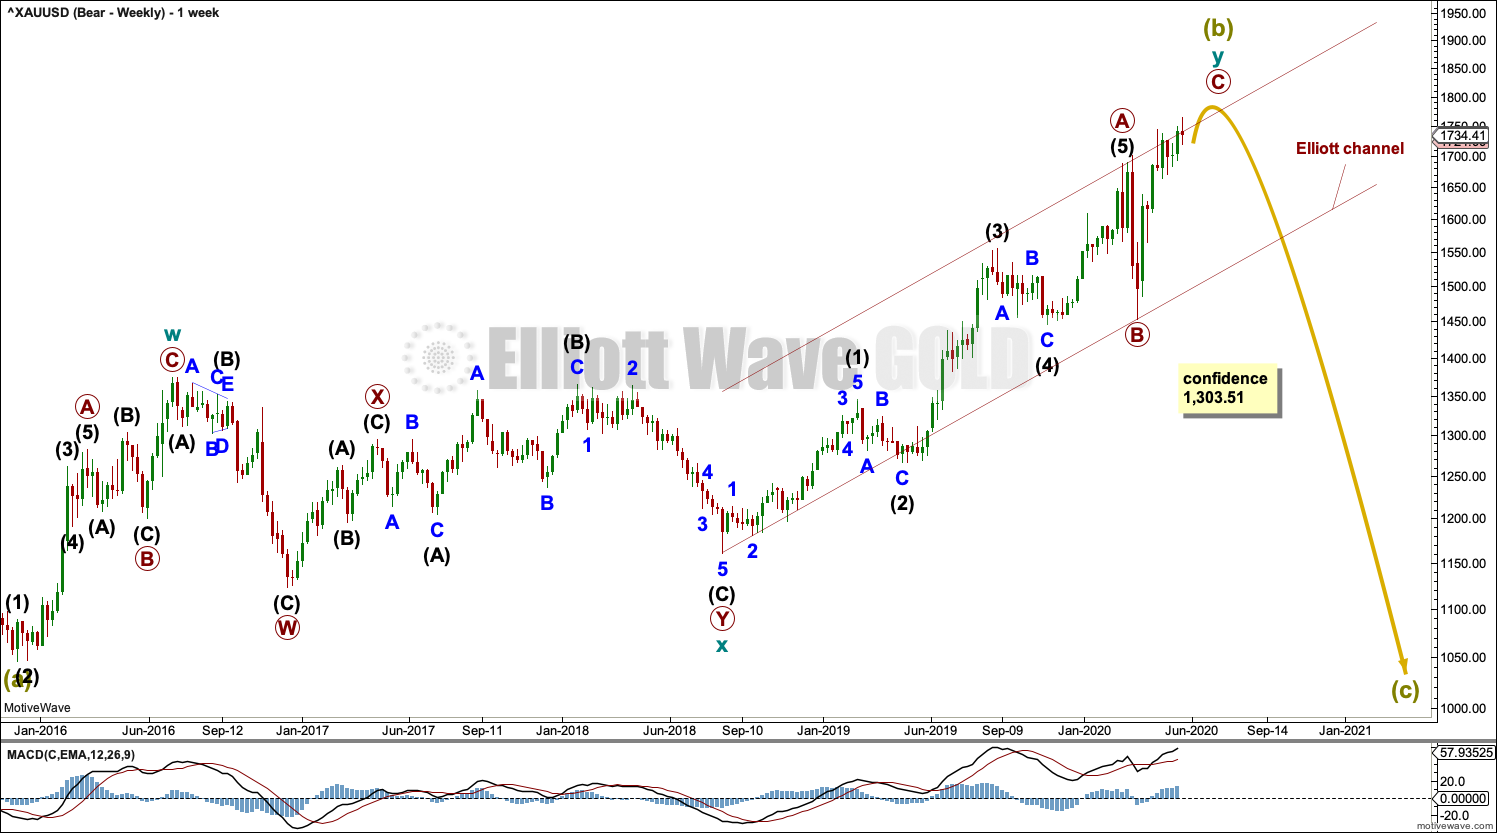
The bigger picture for this main bearish Elliott wave count sees Gold as still within a bear market, in a three steps back pattern that is labelled Grand Super Cycle wave IV on monthly charts.
Super Cycle wave (b) within Grand Super Cycle wave IV may be an incomplete double zigzag.
The first zigzag in the double is labelled cycle wave w. The double is joined by a three in the opposite direction, a combination labelled cycle wave x. The second zigzag in the double is labelled cycle wave y.
The purpose of the second zigzag in a double is to deepen the correction. Cycle wave y has achieved this purpose.
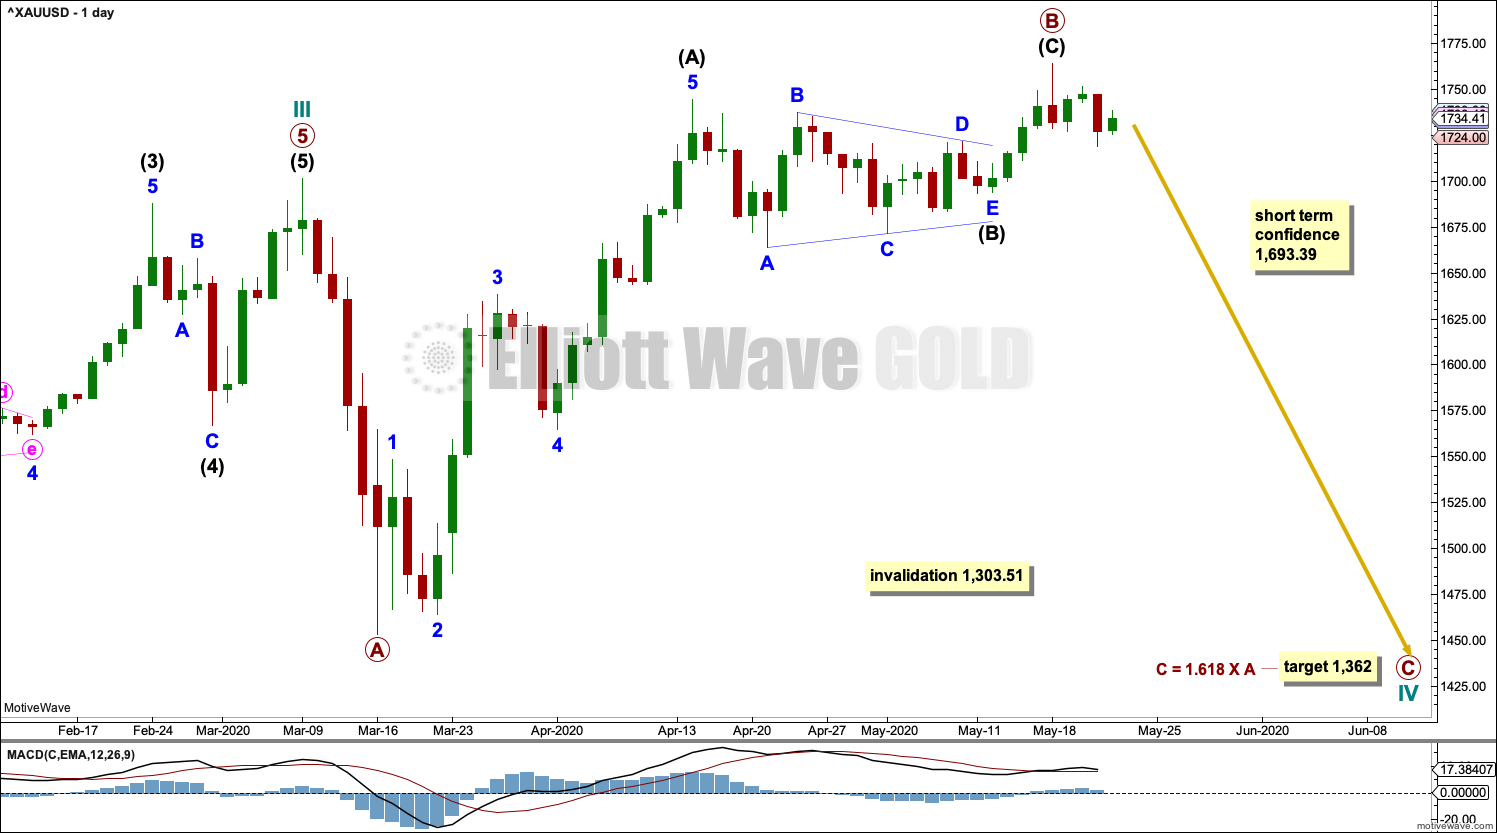
DAILY CHART
Click chart to enlarge.
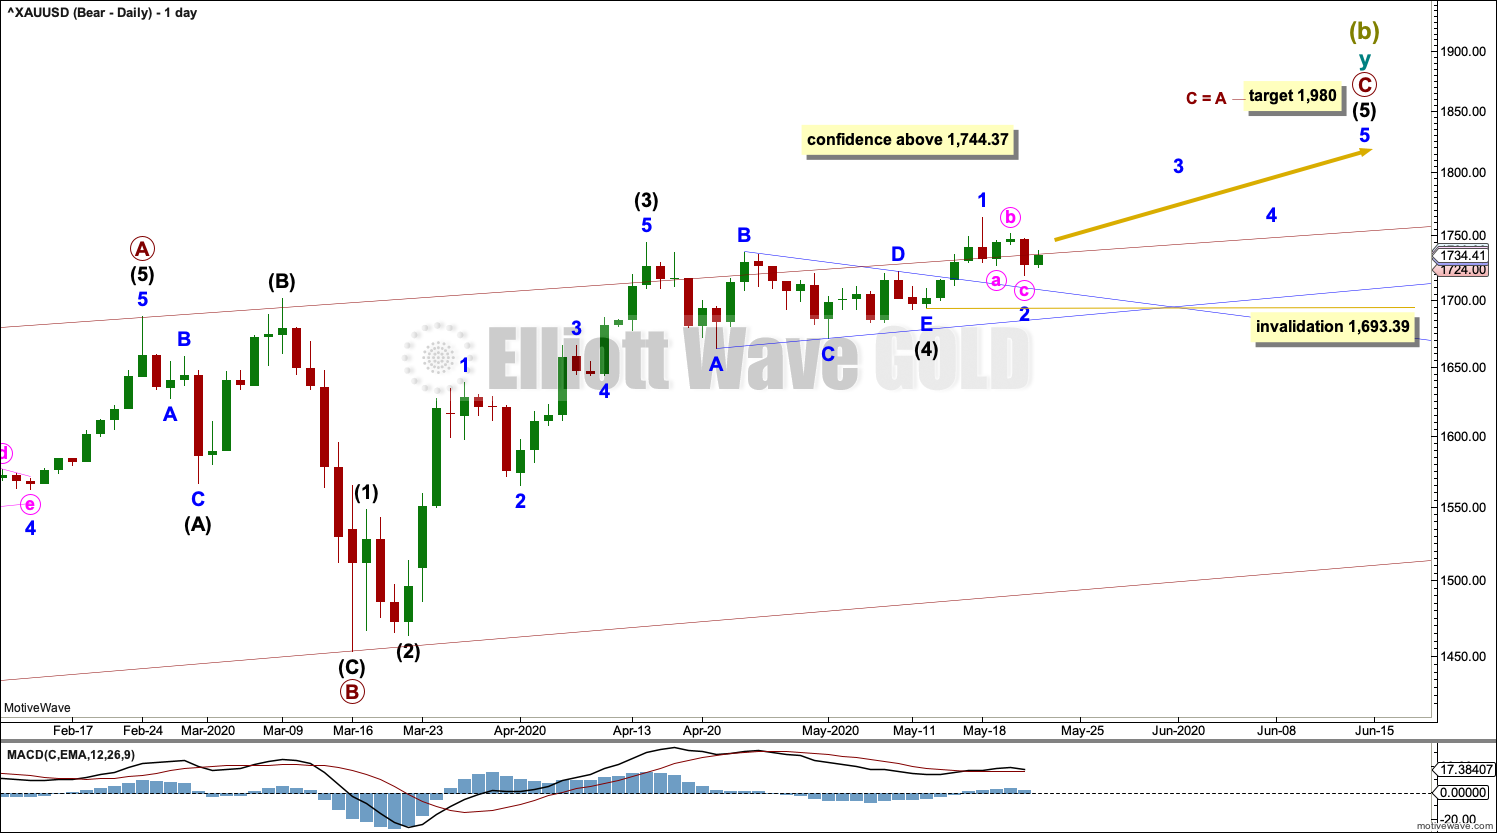
Primary wave C within cycle wave y may be an incomplete five wave impulse. Intermediate waves (1) through to (4) within primary wave C may be complete.
The point in time at which an Elliott wave triangles trend lines cross over is sometimes when a trend change occurs. Extend the triangle trend lines from intermediate wave (4) outwards. A trend change may occur on this date to either down or sideways.
Intermediate wave (5) must subdivide as a five wave structure upwards. Minor wave 1 within intermediate wave (5) may be complete. Minor wave 2 may not move beyond the start of minor wave 1 below 1,693.39.
ALTERNATE BULLISH ELLIOTT WAVE COUNT
WEEKLY CHART
Click chart to enlarge.
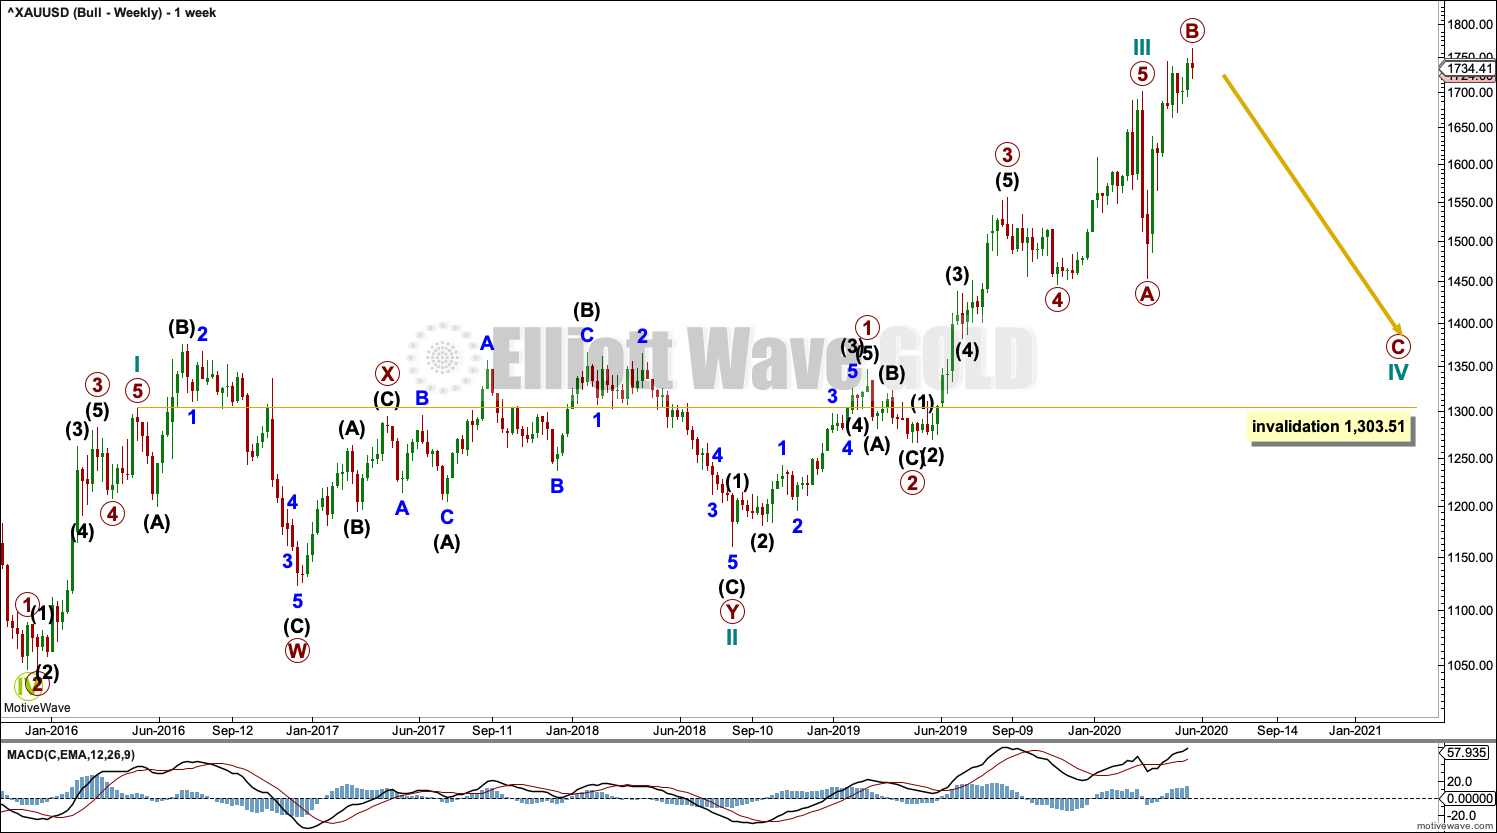
This wave count sees the the bear market complete at the last major low for Gold on 3 December 2015.
If Gold is in a new bull market, then it should begin with a five wave structure upwards on the weekly chart.
Cycle wave I fits as a five wave impulse with reasonably proportionate corrections for primary waves 2 and 4.
Cycle wave II fits as a double flat. However, within the first flat correction labelled primary wave W, this wave count needs to ignore what looks like an obvious triangle from July to September 2016 (this can be seen labelled as a triangle on the bear wave count above). This movement must be labelled as a series of overlapping first and second waves. Ignoring this triangle reduces the probability of this wave count in Elliott wave terms.
Within the first flat correction labelled primary wave W of the double flat of cycle wave II, intermediate wave (B) is 1.69 the length of intermediate wave (A). This is longer than the common range of up to 1.38, but within an allowable guideline of up to 2. The length of intermediate wave (B) reduces the probability of this wave count.
Cycle wave III may be complete. Cycle wave IV may not move into cycle wave I price territory below 1,303.51.
DAILY CHART
Click chart to enlarge.
Cycle wave IV may be an incomplete expanded flat correction. Primary wave A within the flat correction may have subdivided as a zigzag. Primary wave B may now be a complete zigzag. Primary wave B would be a 1.25 length of primary wave A. This is within the normal range for primary wave B within a flat from 1 to 1.38 times the length of primary wave A.
A target is calculated for primary wave C to end based upon the most common Fibonacci ratio to primary wave A within an expanded flat. Primary wave C must subdivide as a five wave motive structure.
TECHNICAL ANALYSIS
WEEKLY CHART
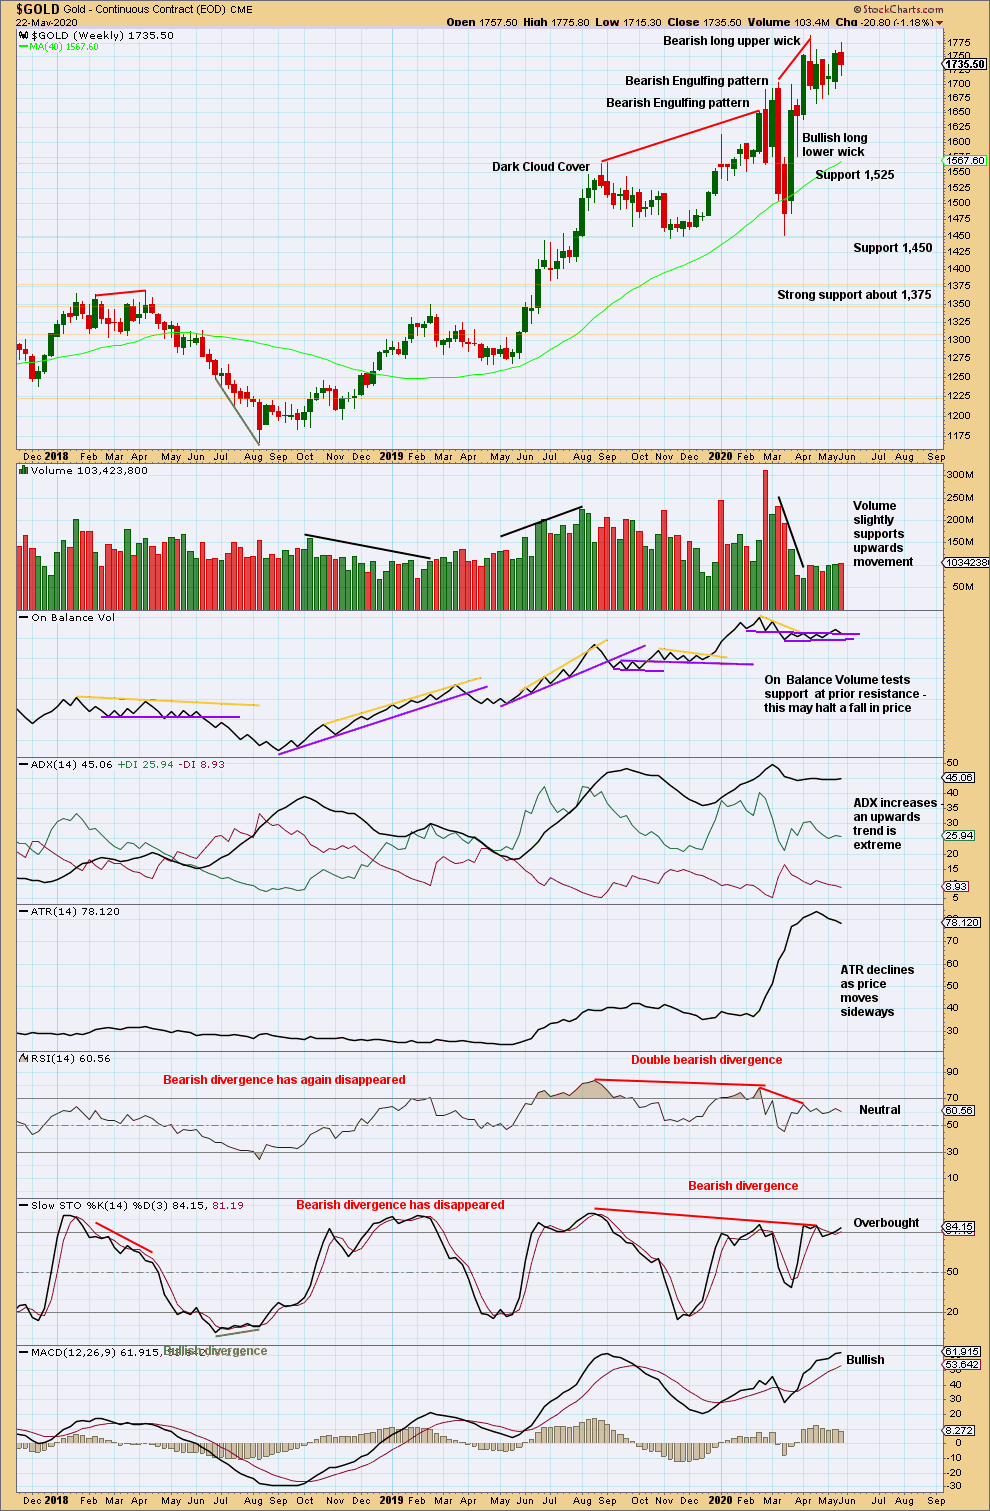
Click chart to enlarge. Chart courtesy of StockCharts.com.
The upwards trend remains extreme. RSI is not yet overbought; there is room for an upwards trend to continue.
DAILY CHART
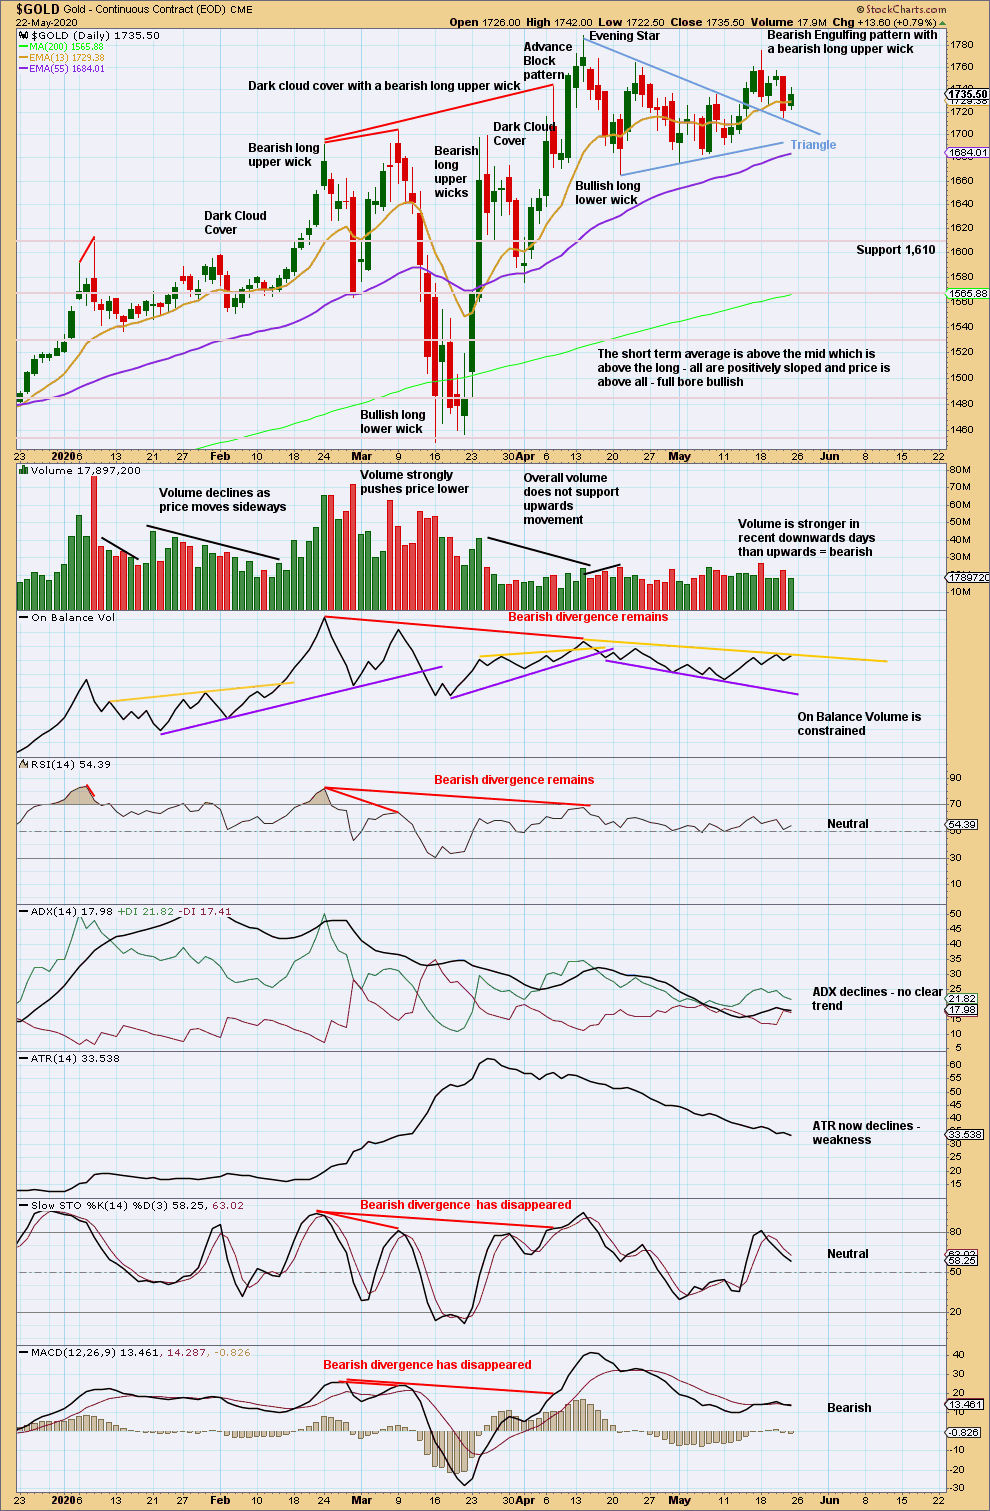
Click chart to enlarge. Chart courtesy of StockCharts.com.
Price has closed above the upper edge of a triangle pattern. A target is at 1,849. However, a lack of support from volume for upwards movement indicates this market may currently be vulnerable to pullbacks. Extra caution regarding risk management is advised at this time.
Now a strong bearish reversal pattern with support from volume increases the warning that this market is vulnerable to a trend change.
The short-term volume profile is bearish.
Price has found support at the upper triangle trend line. This may be a typical back test of support. A breach of this line would be a bearish signal, but in the first instance expect price to most likely bounce up off support here.
GDX WEEKLY CHART
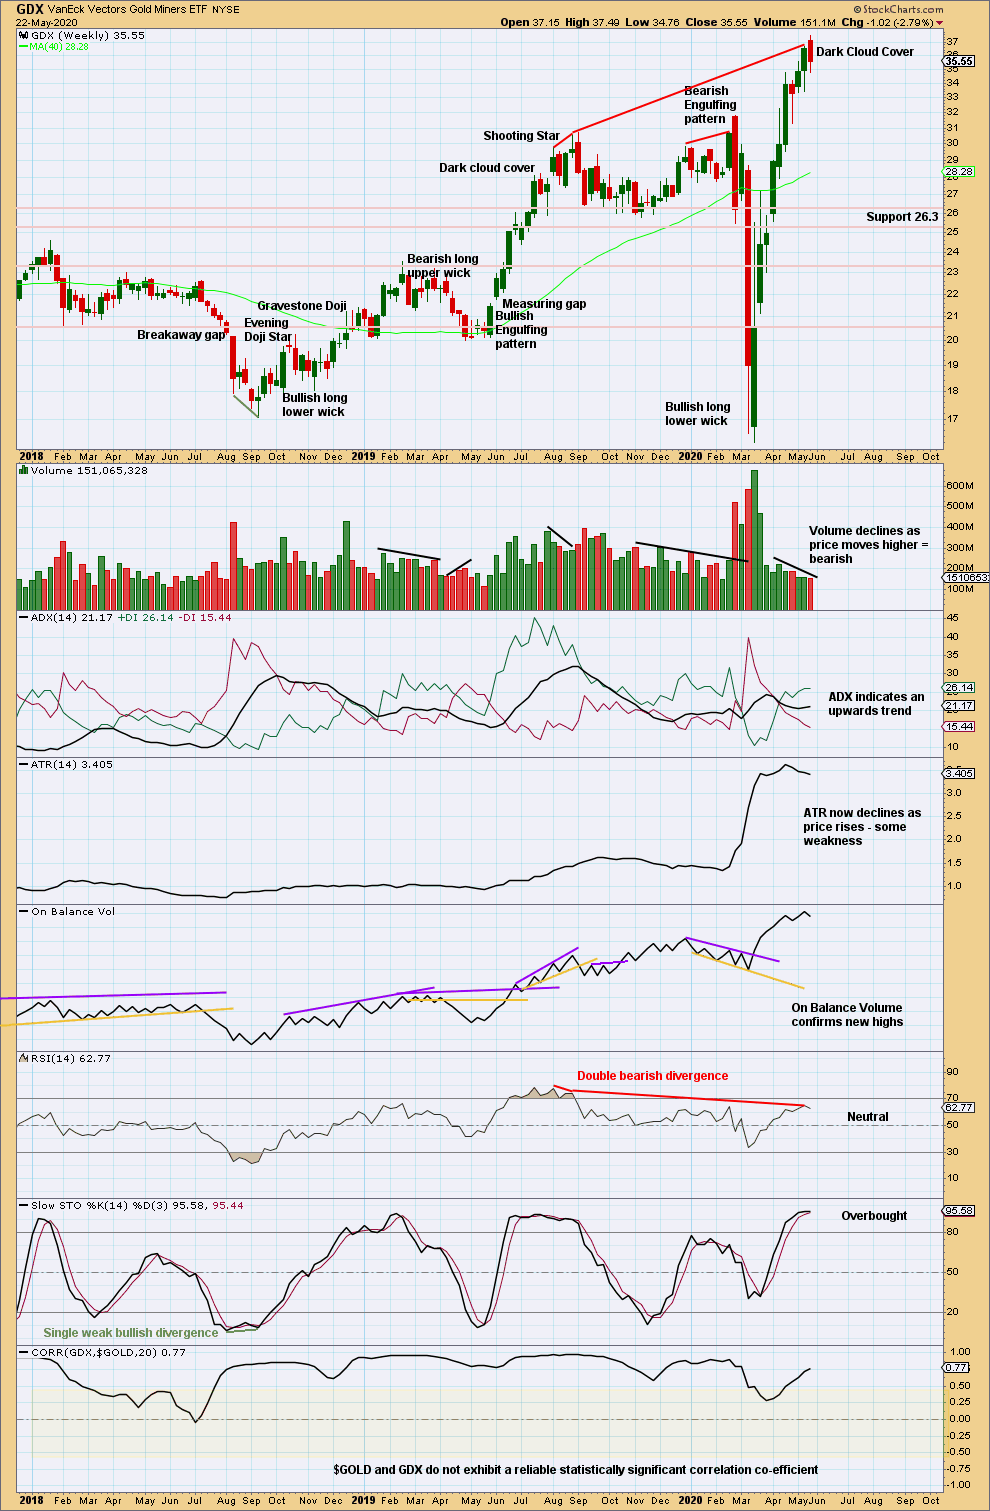
Click chart to enlarge. Chart courtesy of StockCharts.com.
Weak volume and now a bearish candlestick pattern indicate the risk of a trend change here to either down or sideways is high.
GDX DAILY CHART
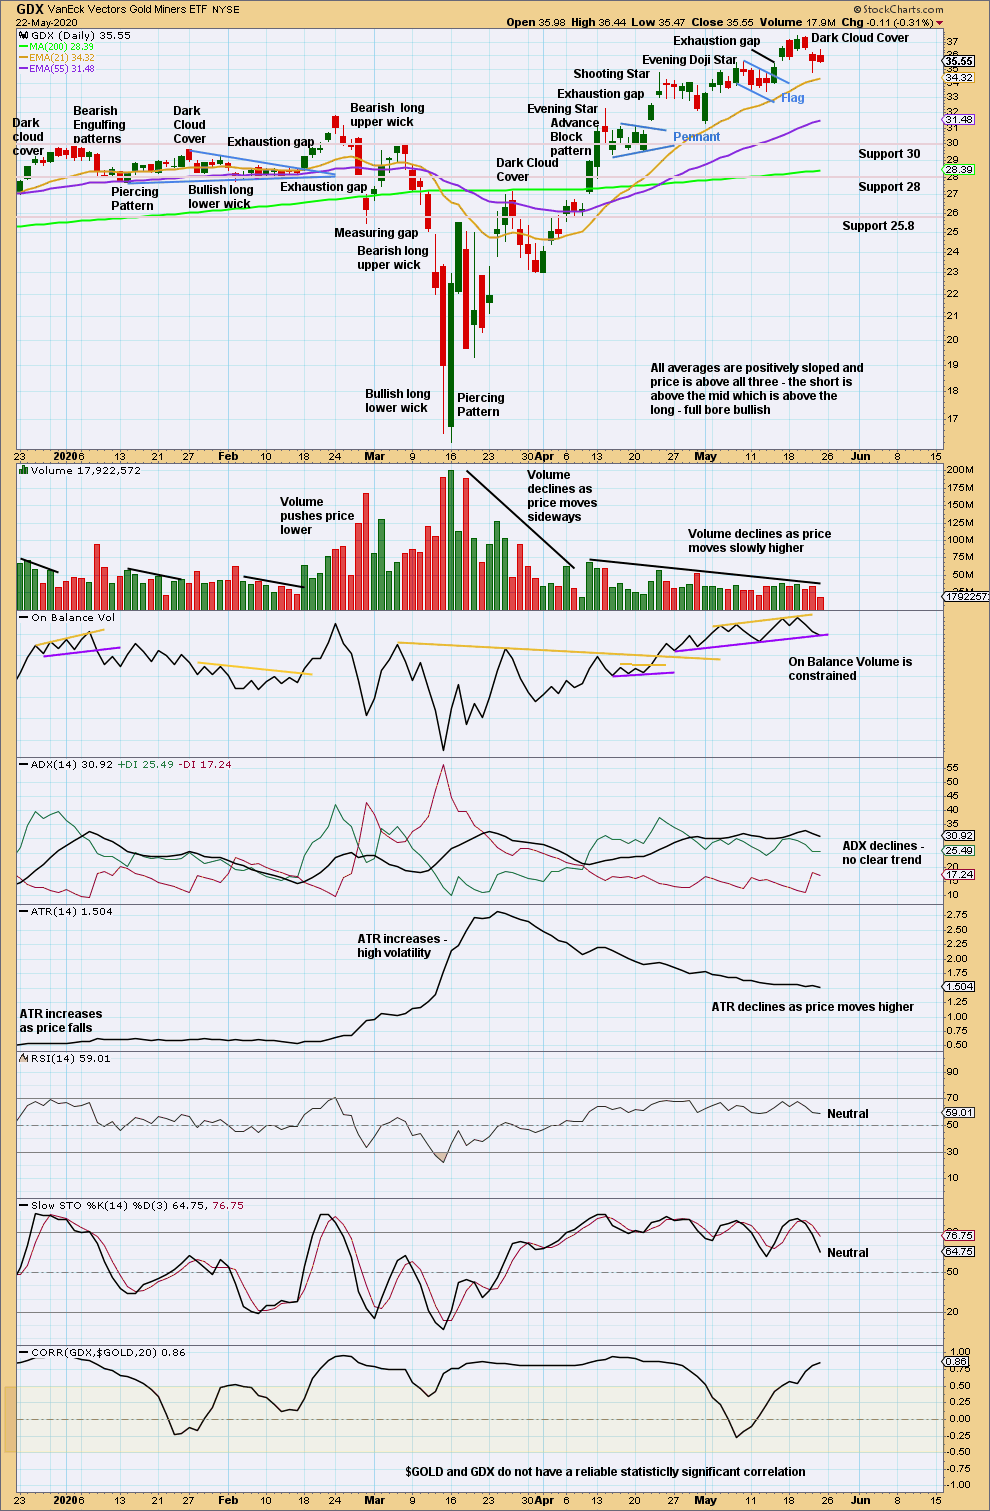
Click chart to enlarge. Chart courtesy of StockCharts.com.
Another bearish candlestick reversal pattern appears in the context of an extreme upwards trend that exhibits weakness in declining ATR. It should be taken as reasonable warning there may be a trend change here to either downwards or sideways.
The last gap down at 36.45 remains open today just by 0.01. It may be a breakaway gap, which may not be closed. If it is closed, then that would be a bullish signal.
US OIL
Again, upwards movement continues as expected. A first wave up is nearing completion and should be followed by a multi-week pullback for a second wave.
Summary: Oil may have found a major sustainable low. For the short term, use the channel on the daily Elliott wave count. Assume upwards movement continues while price remains within or above the channel. If price breaks below the channel, then assume a deep multi-week pullback may have begun.
ELLIOTT WAVE COUNT
MONTHLY CHART
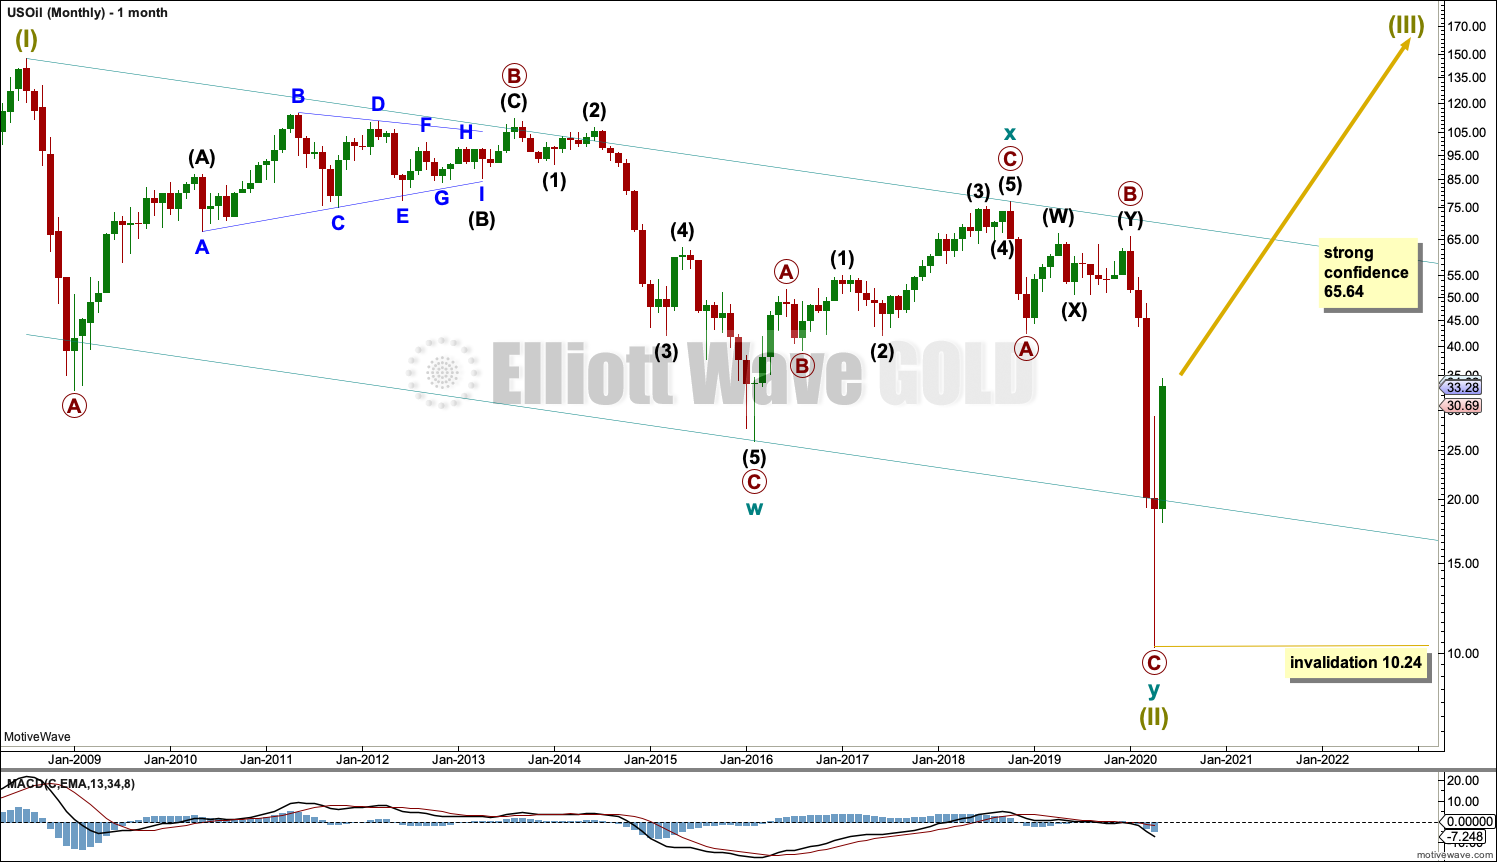
Click chart to enlarge.
The basic Elliott wave structure is five steps forward and three steps back. This Elliott wave count expects that US Oil has completed a three steps back pattern, which began in July 2008. The Elliott wave count expects that the bear market for US Oil may now be over.
A channel is drawn about Super Cycle wave (II): draw the first trend line from the start of cycle wave w to the end of cycle wave x, then place a parallel copy on the end of cycle wave w. Price has bounced up off the channel. This trend line is breached, which is a typical look for the end of a movement for a commodity.
The upper edge of the channel may provide resistance.
Following five waves up and three steps back should be another five steps up; this is labelled Super Cycle wave (III), which may only have just begun. Super Cycle wave (III) may last a generation and must make a new high above the end of Super Cycle wave (I) at 146.73.
Super Cycle wave (III) may only subdivide as a five wave impulse. New trends for Oil usually start out very slowly with short first waves and deep time consuming second wave corrections. Basing action over a few years may now have begun.
WEEKLY CHART
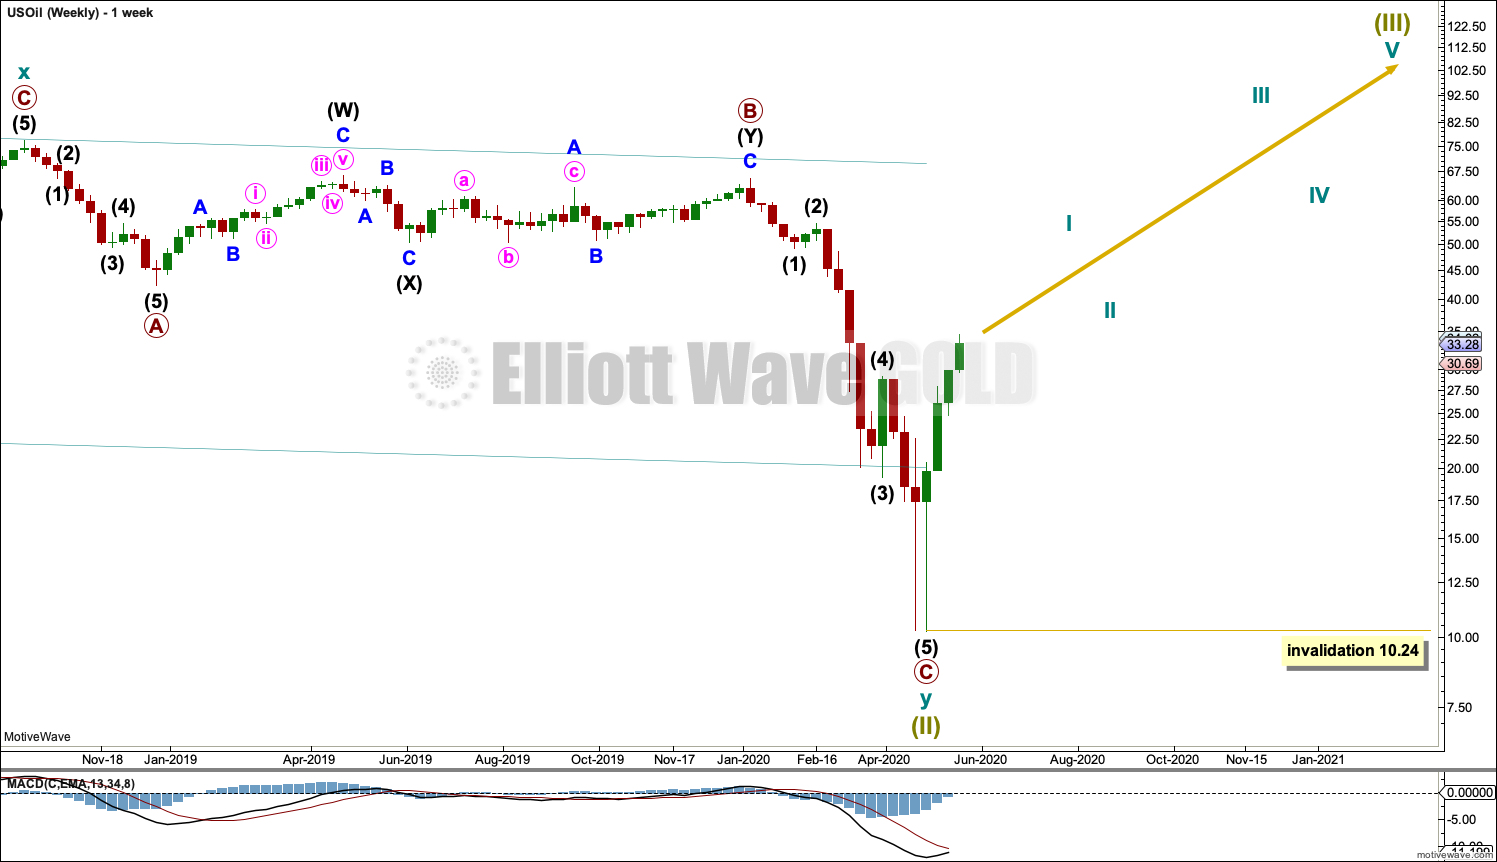
Click chart to enlarge.
Super Cycle wave (III) must subdivide as an impulse. Cycle wave I within the impulse may now be unfolding higher. Cycle wave II may not move beyond the start of cycle wave I below 10.24.
DAILY CHART
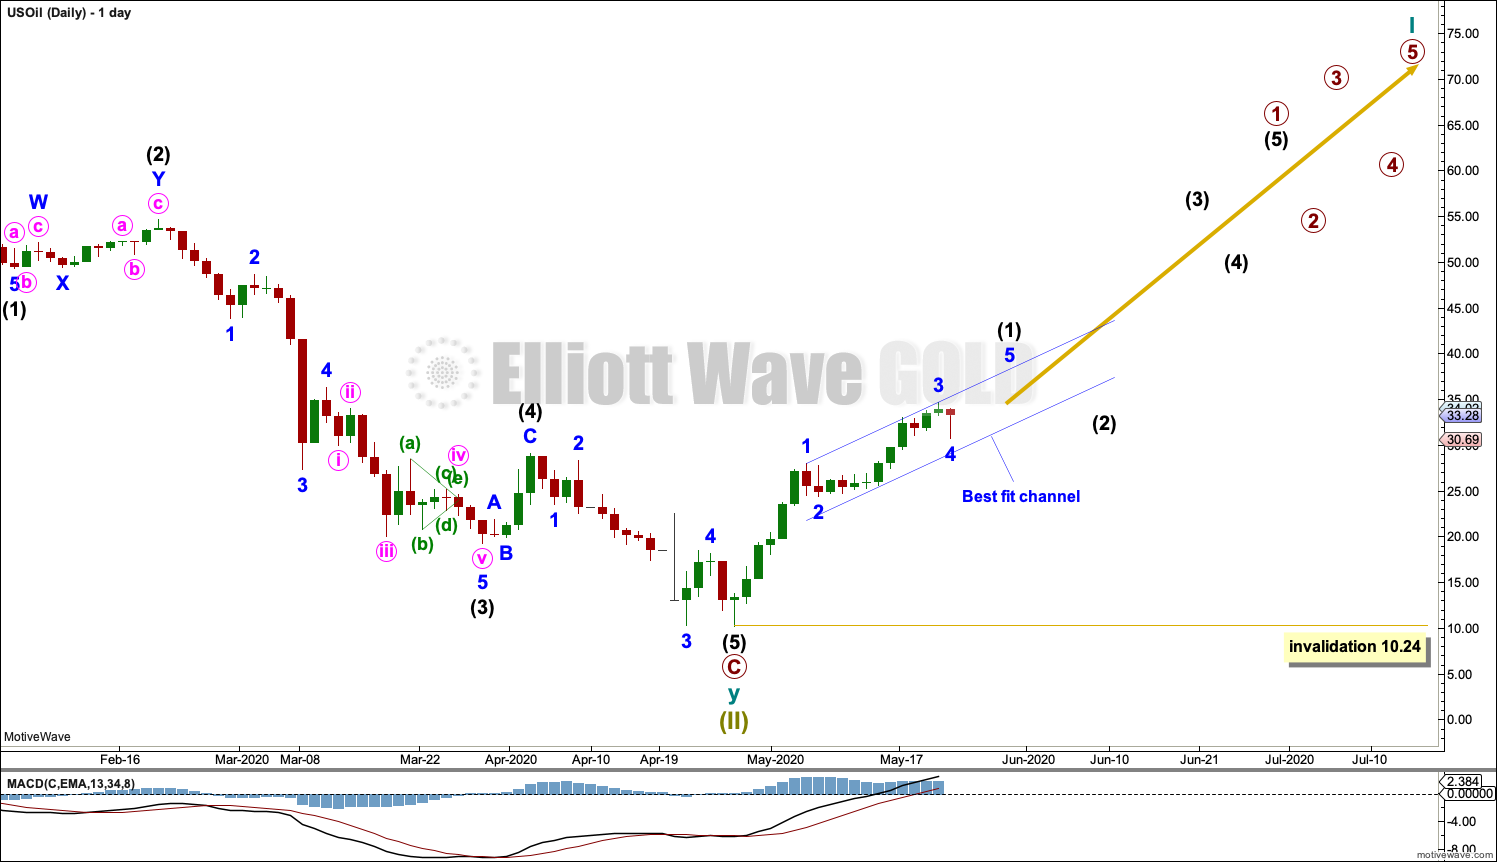
Click chart to enlarge.
Labels are added for cycle wave I. Although the numbers are placed along the direction arrow, this does not mean that it is expected that Super Cycle wave (III) will move in a straight line. Markets do not move in straight lines; there are counter trend movements along the way.
Intermediate wave (2) and primary wave 2 within cycle wave I may be deep and time consuming. It is normal for Oil for counter trend movements early on in a new developing trend to be deep and time consuming as price forms basing action. This may take several months to possibly even years for Oil.
A small channel is drawn about intermediate wave (1). Assume intermediate wave (1) is continuing while price remains within or above this channel. If the channel is breached by downwards movement, then that may be taken as an early indication that intermediate wave (1) may be over and intermediate wave (2) may have begun.
Intermediate wave (2) may not move beyond the start of intermediate wave (1) below 10.24.
TECHNICAL ANALYSIS
WEEKLY CHART
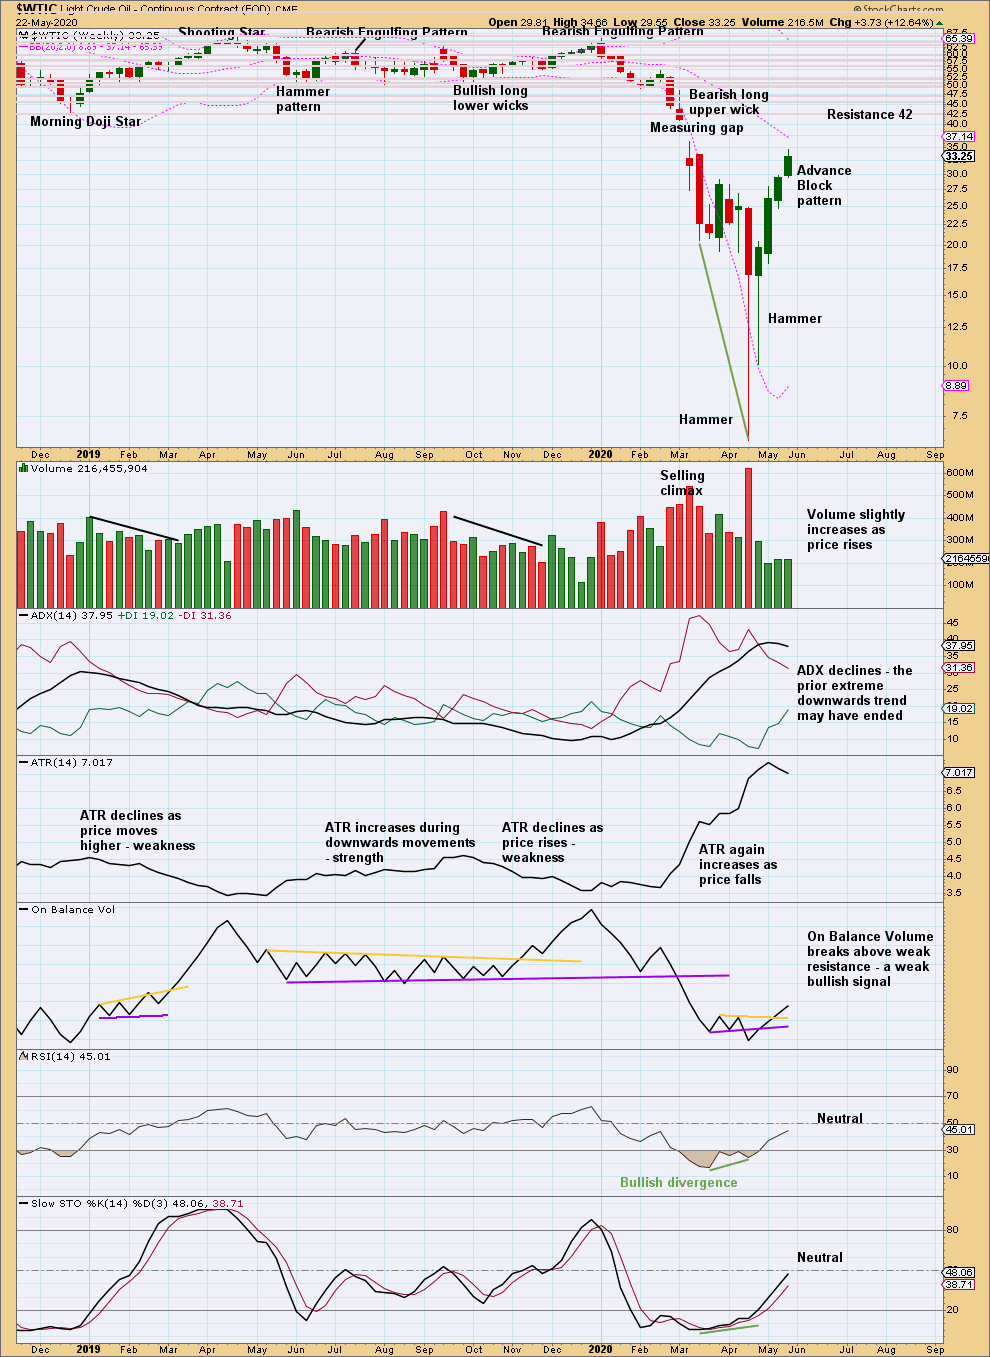
Click chart to enlarge. Chart courtesy of StockCharts.com.
Now two bullish reversal patterns with RSI reaching oversold and then exhibiting bullish divergence suggest a low may now be in place.
The last three completed weekly candlesticks now form an Advance Block pattern. This warns that the upwards movement here is weakening and the market is at a higher risk of a pullback developing.
DAILY CHART
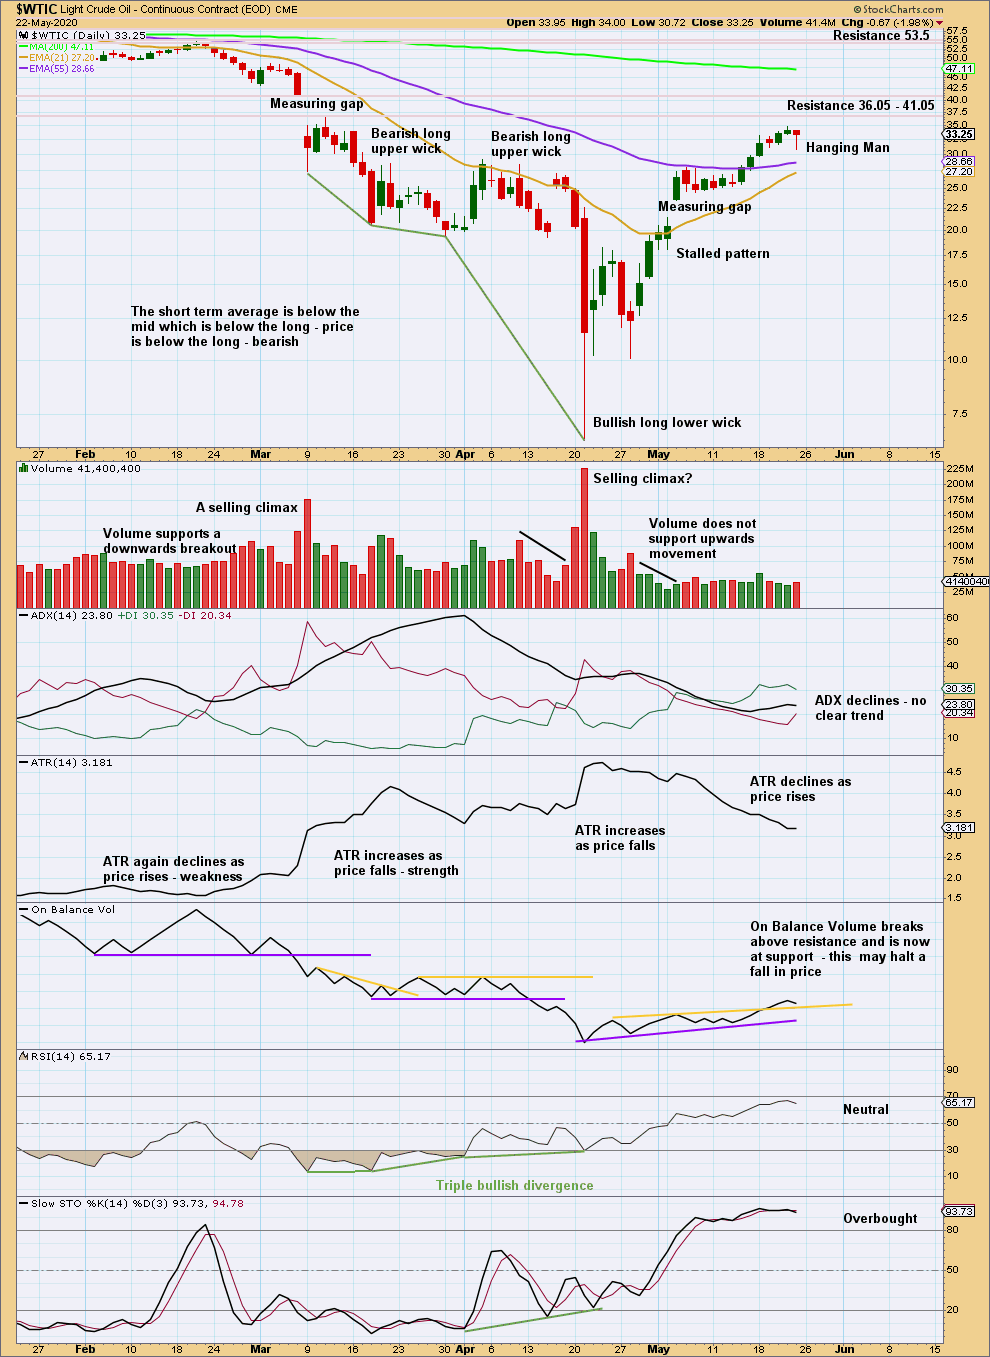
Click chart to enlarge. Chart courtesy of StockCharts.com.
The upwards shorter term trend may have ended. The Hanging Man candlestick, which has support from volume, is a bearish reversal pattern. However, the bullish implication of the long lower wick on the Hanging Man means it requires bearish confirmation in the following candlestick, making a Hanging Man essentially a two candlestick reversal pattern.
—
Always practice good risk management as the most important aspect of trading. Always trade with stops and invest only 1-5% of equity on any one trade. Failure to manage risk is the most common mistake new traders make.