
Lara’s Weekly: S&P500 Elliott Wave and Technical Analysis | Charts – March 20, 2020 and March 27, 2020
Example of analysis of the S&P500, included in Lara’s Weekly, for two weeks that cover the important low found on March 23, 2020.
1. Published week ending March 20, 2020:
Summary: It may be safest to assume the downwards trend remains intact while price remains below 2,466.97. The short-term target remains at 2,173.
However, at the last low there is a Hammer reversal pattern that comes while RSI exhibits triple bullish divergence, On Balance Volume has not confirmed new lows, and ADX is now very extreme. Conditions are now set for a strong bounce. Be aware this market is vulnerable to large whipsaws.
A breach of the downwards sloping channel on the daily chart would strongly indicate a multi-day to multi-week bounce may have arrived. A new high above 2,466.97 would provide further confidence.
ELLIOTT WAVE COUNTS
MAIN WAVE COUNT
MONTHLY CHART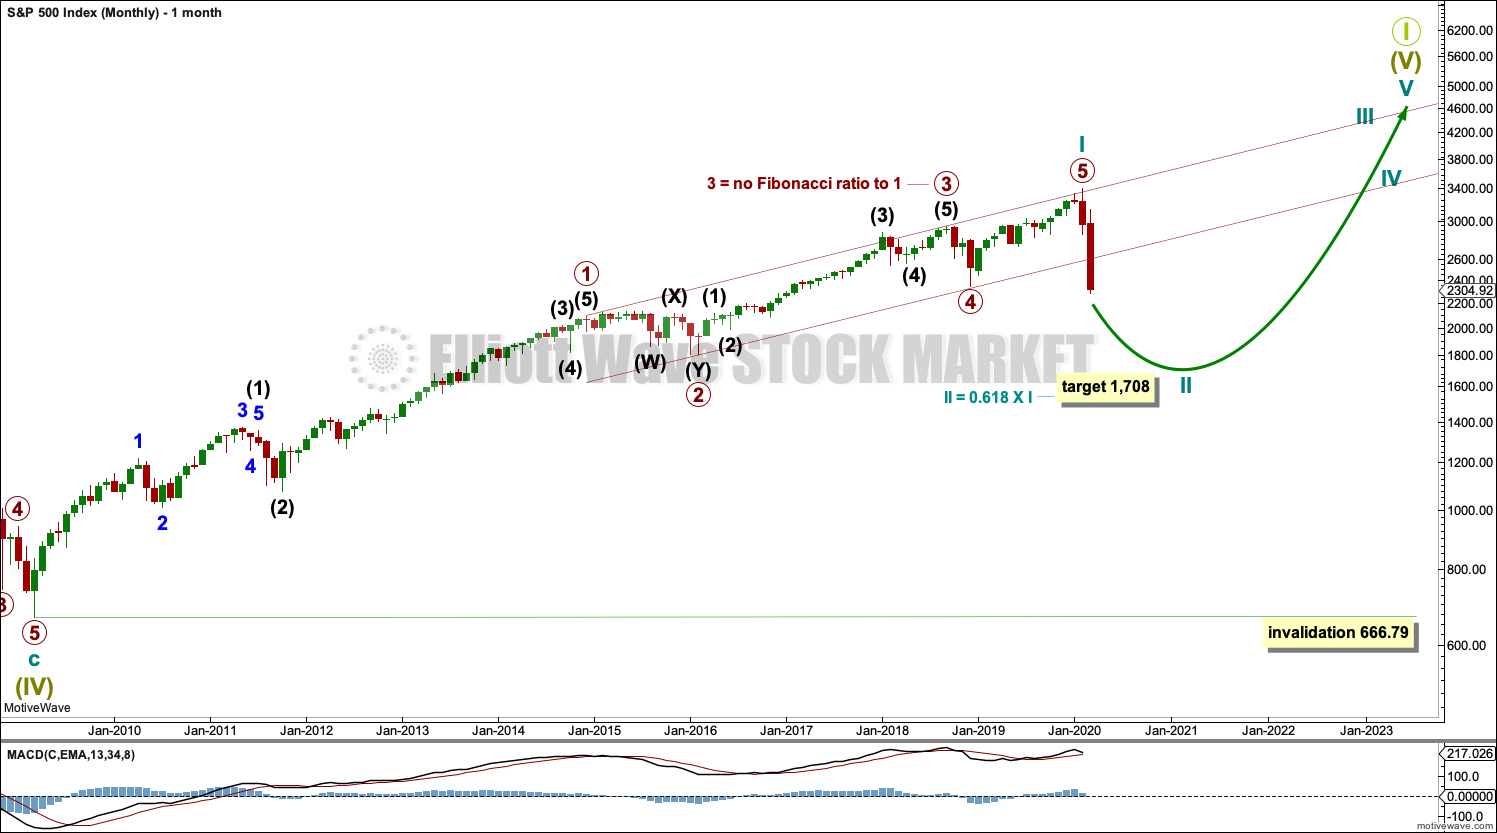
Click chart to enlarge.
The 0.236 and now also 0.382 Fibonacci ratios of cycle wave I have both been passed. The next Fibonnacci ratio in the sequence is used for the next target for cycle wave II to end.
The channel drawn about cycle wave I is drawn using Elliott’s first technique. This channel looks text book perfect. The channel is now strongly breached confirming an end to the bull market, which began in 2009, and confirming a new bear market to follow.
Cycle wave II may not move beyond the start of cycle wave I below 666.79.
Cycle wave II may last about one to two years in total. In the middle should be a B wave bounce or consolidation that may last some months.
WEEKLY CHART
Click chart to enlarge.
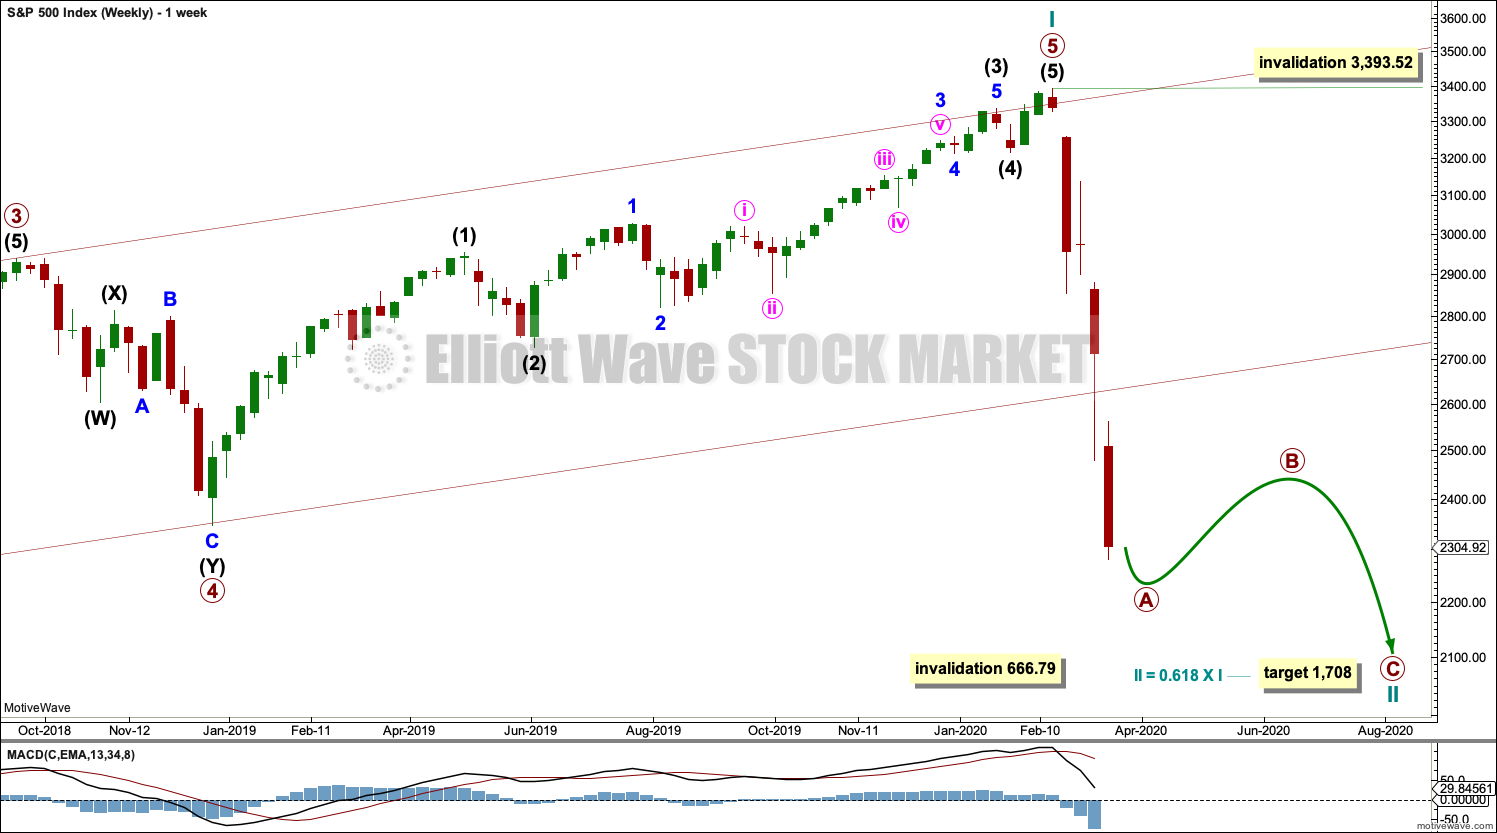
The channel is now breached by a full weekly candlestick below and not touching the lower edge. Further confidence in this wave count may be had.
Price is now below the 0.382 Fibonacci ratio of cycle wave I at 2,352. The structure of cycle wave II may need further to go to complete. The next Fibonacci ratio at 0.618 is now a preferred target for cycle wave II to end.
It is possible now that cycle wave II could be complete. This alternate idea may require one or more of the following conditions to be met for confidence in it:
– A 90% up day or two back to back 80% up days within three sessions from today.
– A 6 point rise in Lowry’s short-term index.
– A new high by the AD line.
– A new high above 3,393.52.
– A bullish candlestick reversal pattern with support from volume at the daily, weekly or monthly chart level.
Cycle wave II may not move beyond the start of cycle wave I below 666.79.
DAILY CHART
Click chart to enlarge.
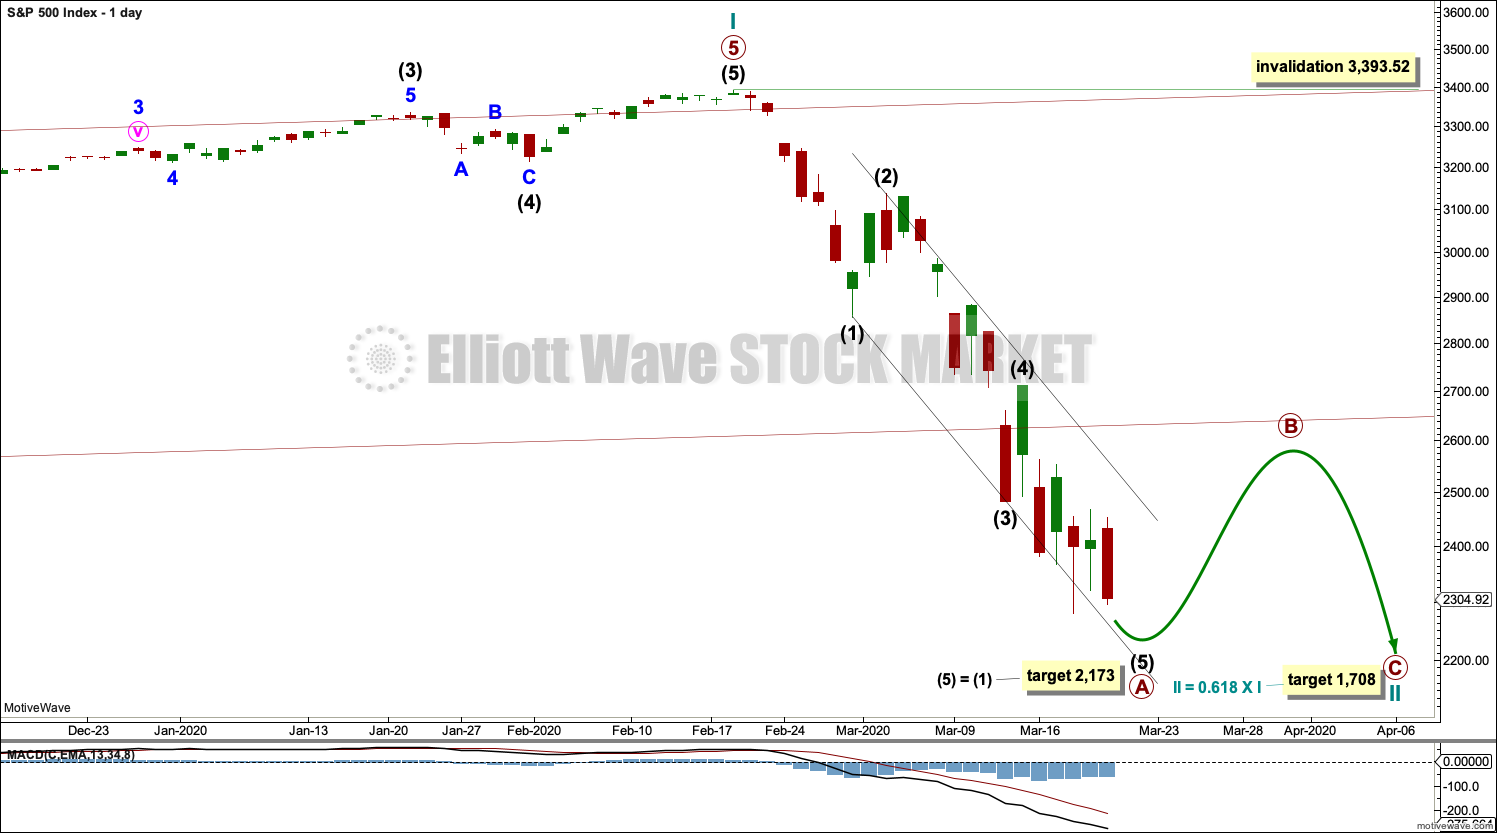
Redraw the wide maroon trend channel carefully: draw the first trend line from the end of primary wave 1 at 2,093.55 (December 26, 2014), to the end of primary wave 3 at 2,940.91 (September 21, 2018), then place a parallel copy on the end of primary wave 2 at 1,810.10 (February 11, 2016). The channel is fully breached indicating a trend change from the multi-year bull trend to a new bear trend.
Cycle wave II may subdivide as any Elliott wave corrective structure except a triangle. It would most likely be a zigzag. Primary wave A may be an incomplete five wave impulse. Primary wave B may not move beyond the start of primary wave A above 3,393.52.
Within primary wave A, there is no Fibonacci ratio between intermediate waves (1) and (3). This makes it more likely that intermediate wave (5) may exhibit a Fibonacci ratio to either of intermediate waves (1) or (3). The most common Fibonacci ratio for a fifth wave is equality in length with its counterpart first wave.
FIRST ALTERNATE MONTHLY CHART
Click chart to enlarge.
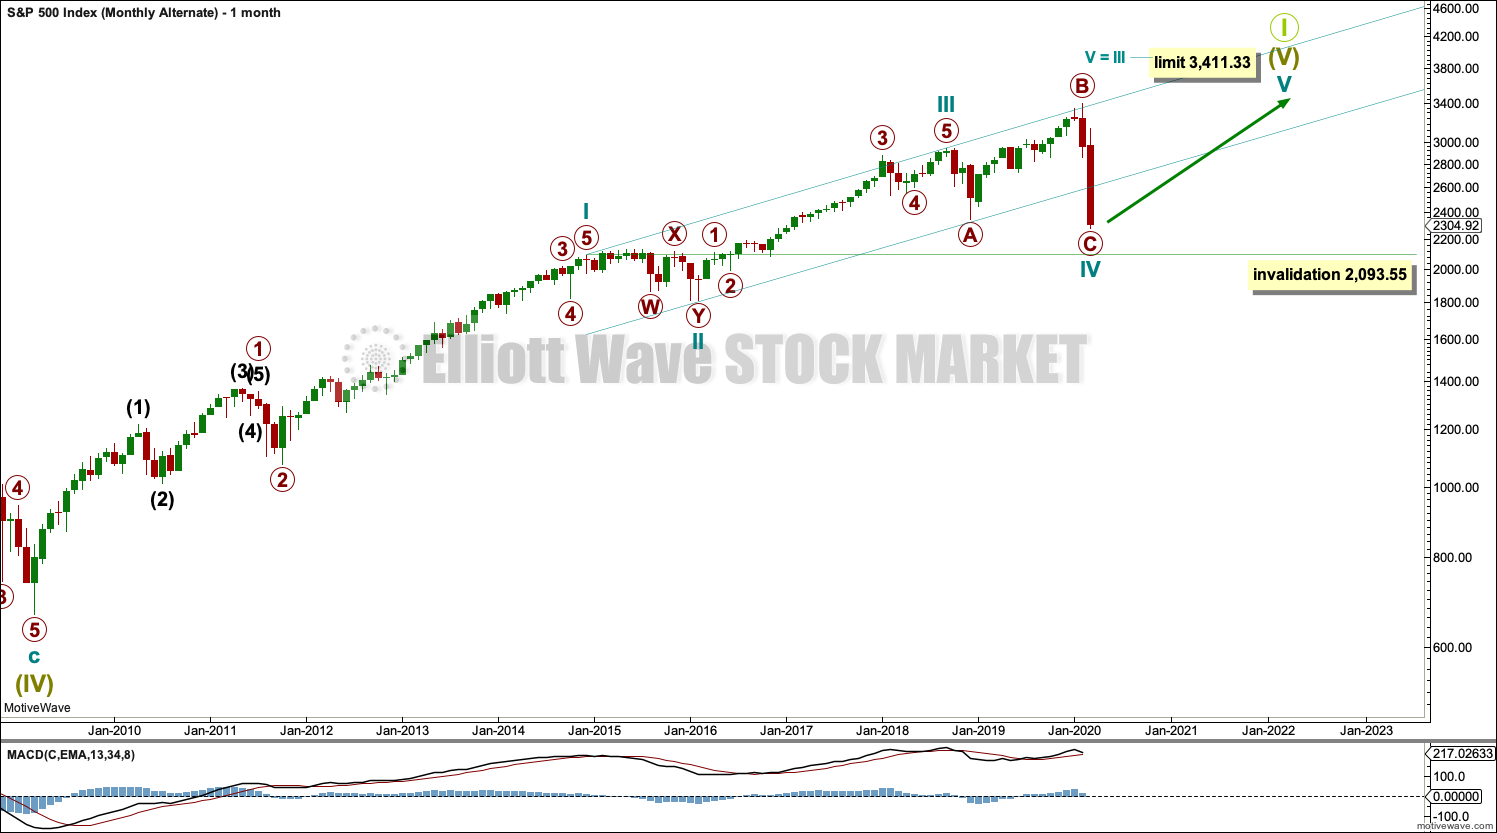
It is also possible that an impulse higher is incomplete and the sharp fall of the last few weeks is wave C of an expanded flat correction for cycle wave IV.
Cycle wave IV may not move into cycle wave I price territory below 2,093.55.
Cycle wave III would be shorter than cycle wave I. This limits cycle wave V to no longer than equality in length with cycle wave III. If cycle wave IV moves lower, then this limit must also move correspondingly lower.
This wave count is possible.
SECOND ALTERNATE MONTHLY CHART
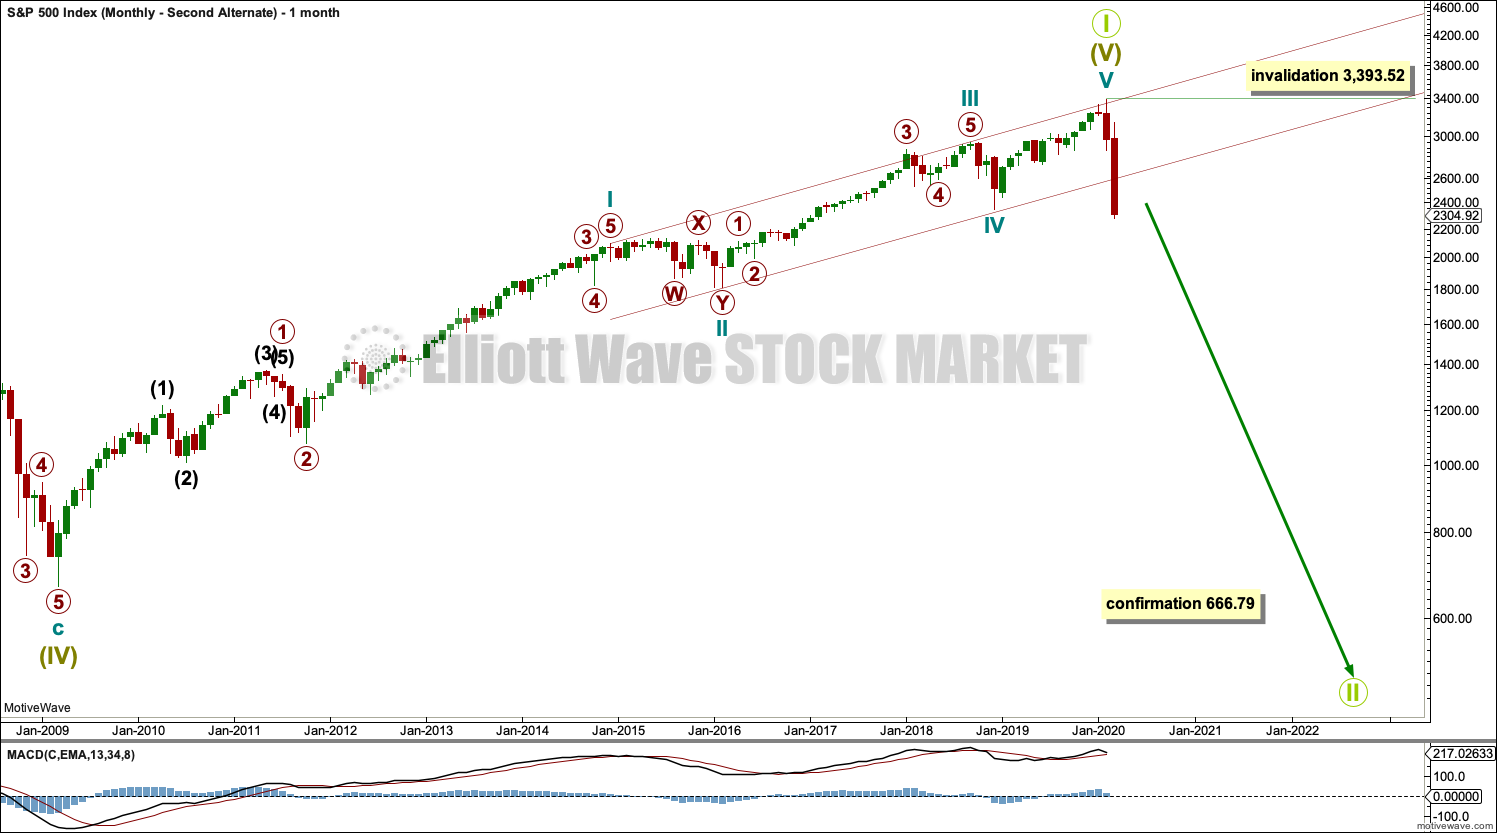
Click chart to enlarge.
This wave count is the same as the first monthly chart, but the degree of labelling is moved down one degree. It is possible that the all time high was the end of a Grand Super Cycle first wave, and a huge market crash to historic lows may have just begun.
However, at this time with the data in hand this wave count does not have good support from classic technical analysis: There was non divergence between price and market breadth at the high, and there is currently bullish divergence between both of price and On Balance Volume and the AD line. While this data could change, analysis may only be performed on data in hand at this time.
TECHNICAL ANALYSIS
WEEKLY CHART

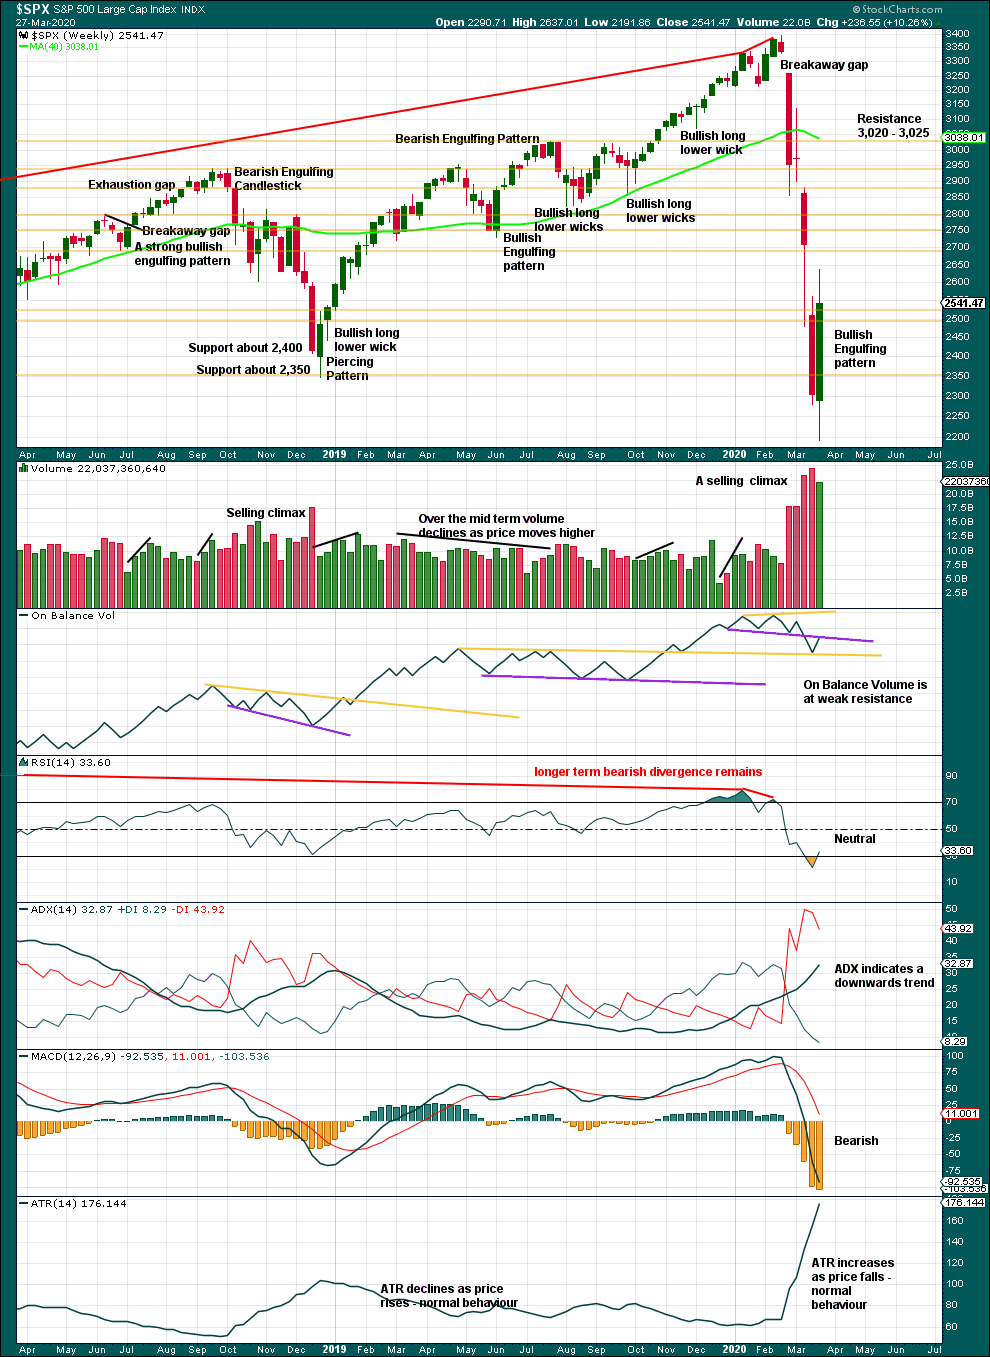
Click chart to enlarge. Chart courtesy of StockCharts.com.
A 32.8% drop in price (high to low) no longer has precedent within the larger bull market.
At the weekly chart level, conditions are now oversold; it is now more possible that a bounce or consolidation may arrive.
DAILY CHART
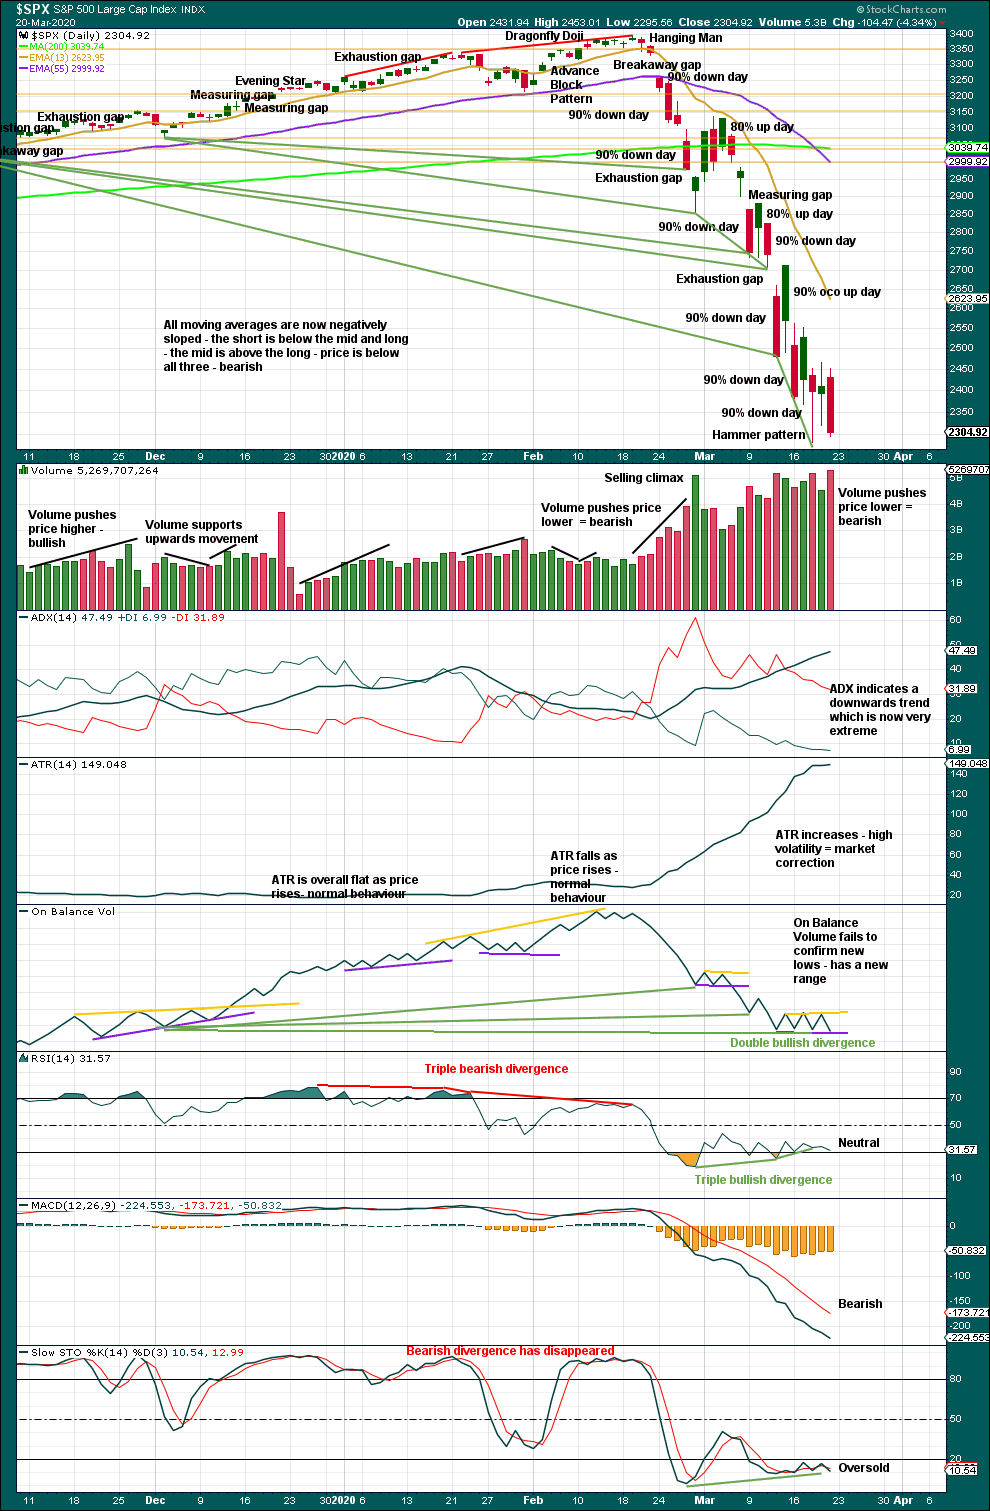
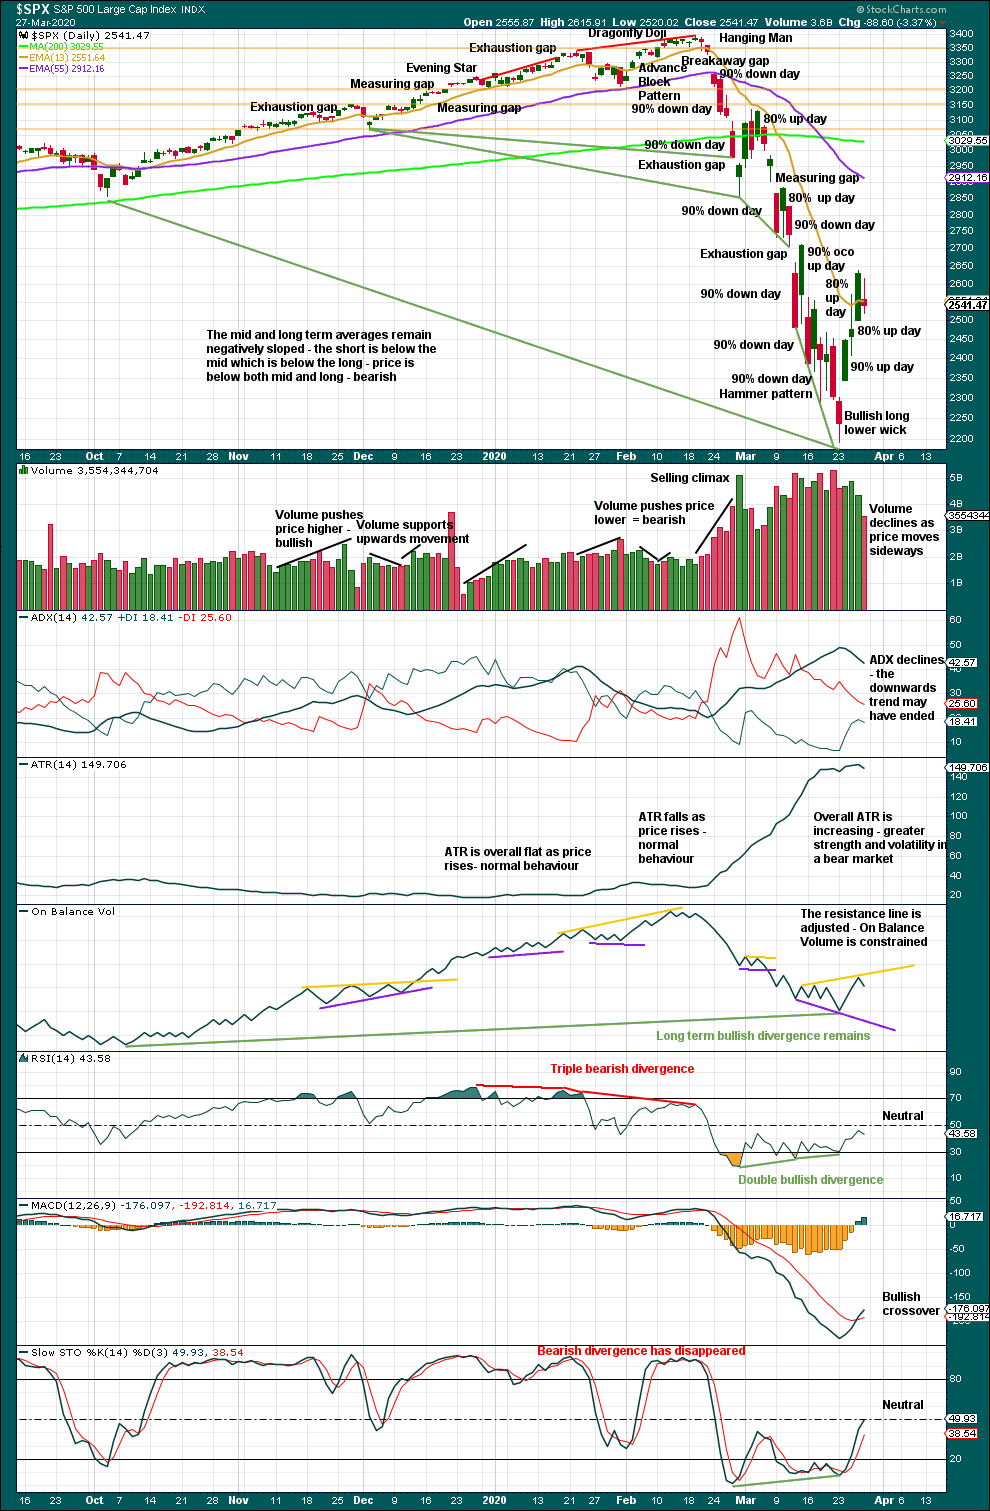
Click chart to enlarge. Chart courtesy of StockCharts.com.
There are now eight 90% downwards days in this strong downwards movement.
The following indicators still suggest a low may be in place soon:
– RSI reached deeply oversold and now exhibits short-term triple bullish divergence with price.
– Stochastics reached oversold and now exhibits short-term bullish divergence with price.
– On Balance Volume continues to exhibit double bullish divergence with price. On Balance Volume has failed to confirm the last three days’ lows.
If price bounces here, then it would most likely be a correction within an ongoing bear market and not necessarily the end of the bear market.
At this stage, there is not any evidence of a sustainable low in place.
BREADTH – AD LINE
WEEKLY CHART
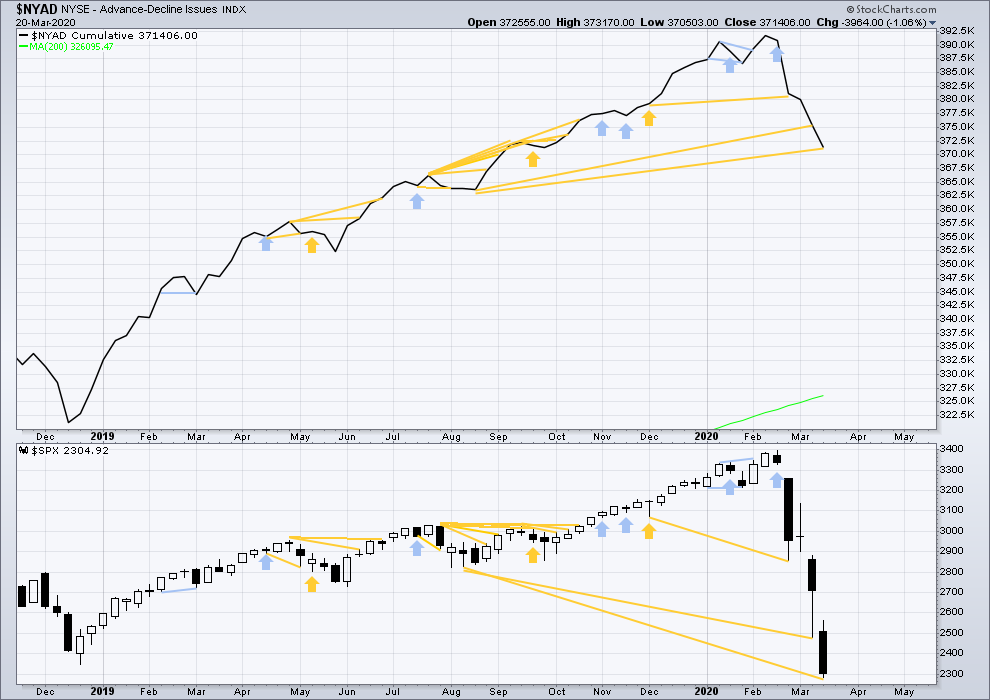
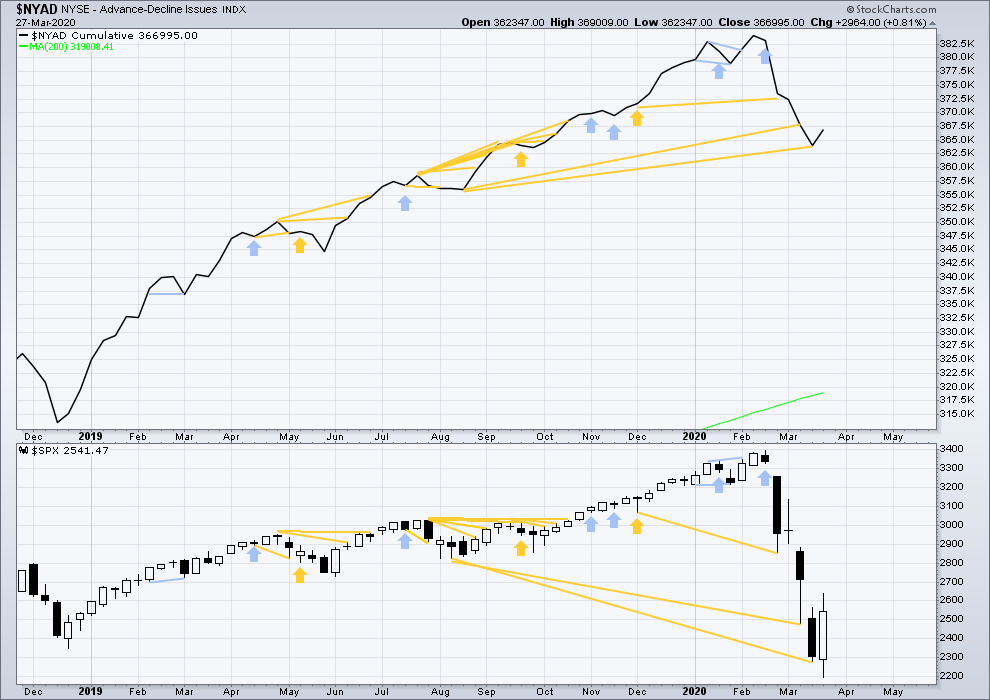
Click chart to enlarge. Chart courtesy of StockCharts.com. So that colour blind members are included, bearish signals will be noted with blue and bullish signals with yellow.
Bear markets from the Great Depression and onwards have been preceded by an average minimum of 4 months divergence between price and the AD line with only two exceptions in 1946 and 1976. With no divergence between the AD line and price at the last all time high, this current bear market now makes a third exception.
In all bear markets in the last 90 years there is some positive correlation (0.6022) between the length of bearish divergence and the depth of the following bear market. No to little divergence is correlated with more shallow bear markets. Longer divergence is correlated with deeper bear markets.
This bear market comes after no bearish divergence. It would more likely be shallow, but this is a statement of probability and not certainty. So far it is slightly more than the 0.382 Fibonacci ratio of the bull market it is correcting (beginning March 2009).
Again this week price made new lows below prior lows of August 2019, but the AD line has not. This fall in price does not have support from a corresponding decline in market breadth. This divergence is bullish and supports the view that this bear market may more likely be shallow.
Large caps all time high: 3,393.52 on 19th February 2020.
Mid caps all time high: 2,109.43 on 20th February 2020.
Small caps all time high: 1,100.58 on 27th August 2018.
DAILY CHART
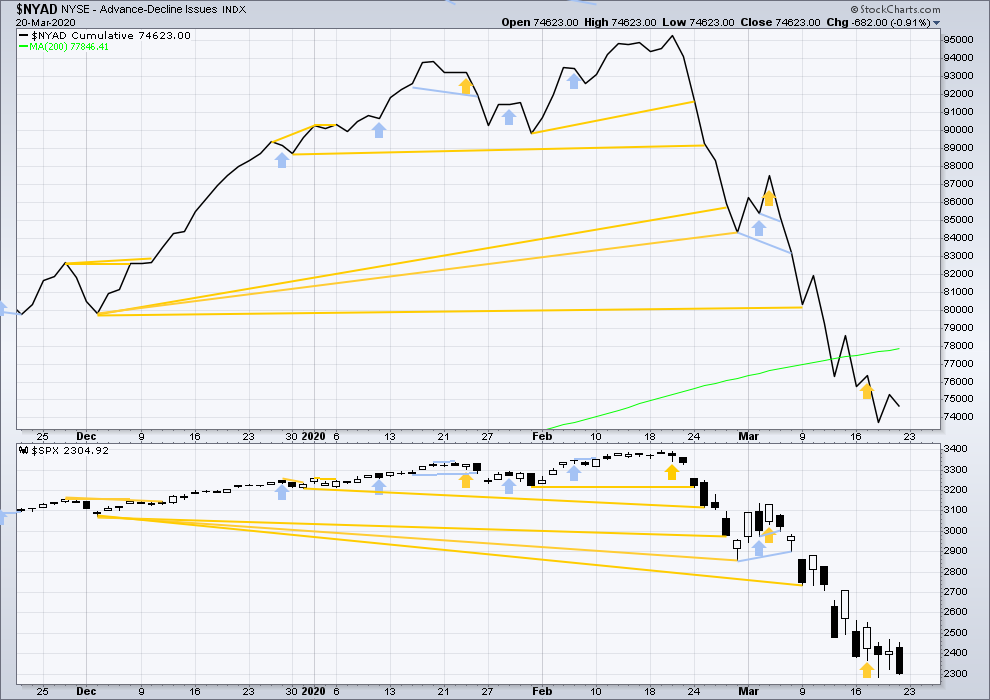
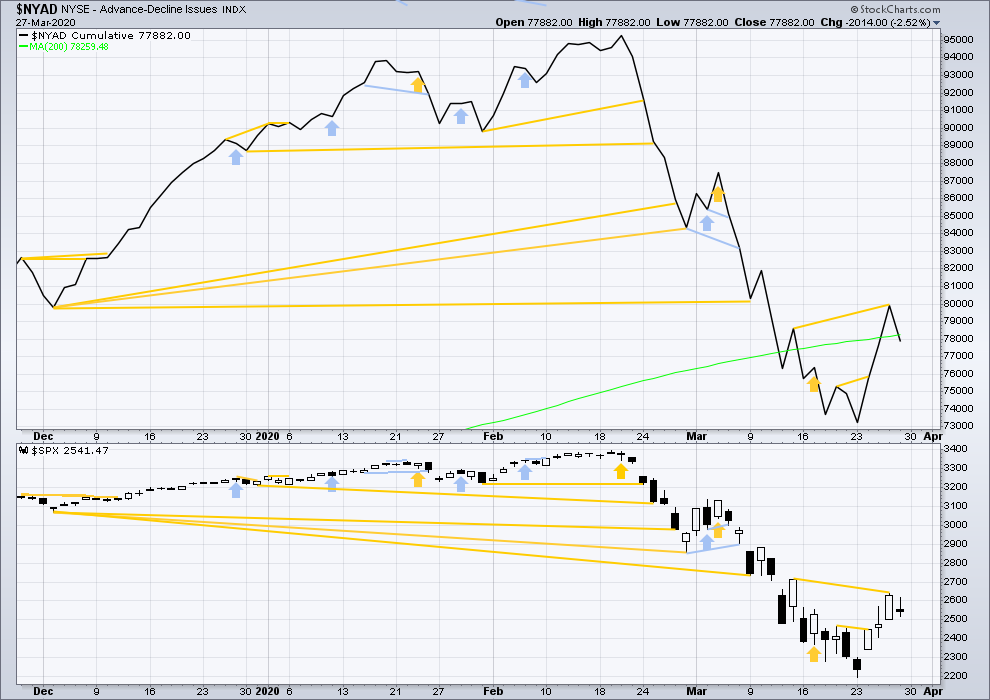
Click chart to enlarge. Chart courtesy of StockCharts.com. So that colour blind members are included, bearish signals will be noted with blue and bullish signals with yellow.
Breadth should be read as a leading indicator.
Both price and breadth have moved lower on Friday. Neither made new lows. There is no new short-term divergence.
VOLATILITY – INVERTED VIX CHART
WEEKLY CHART
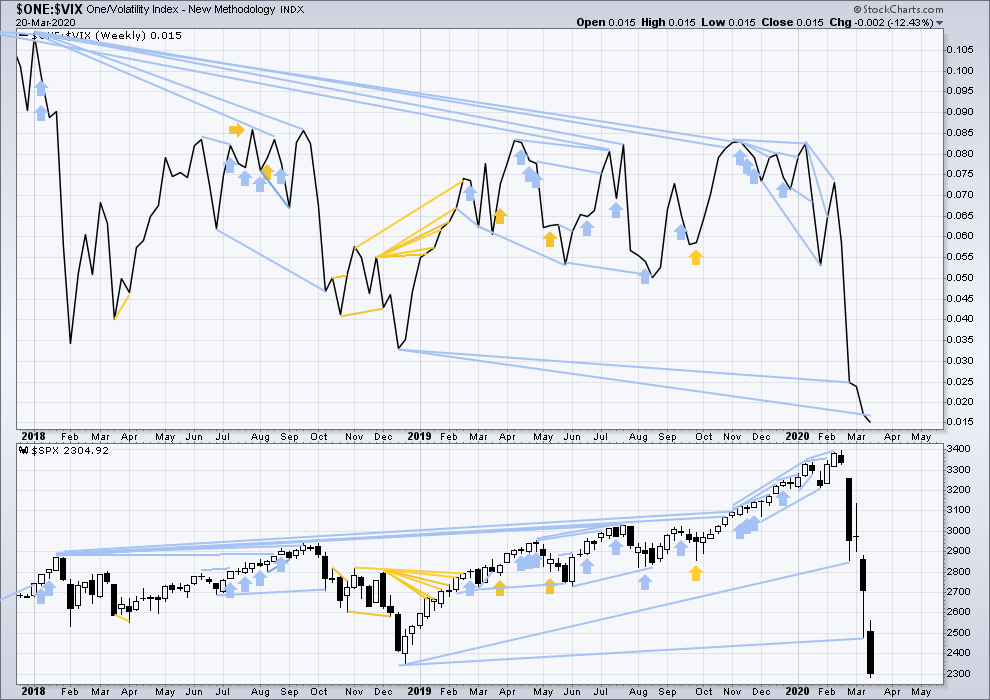
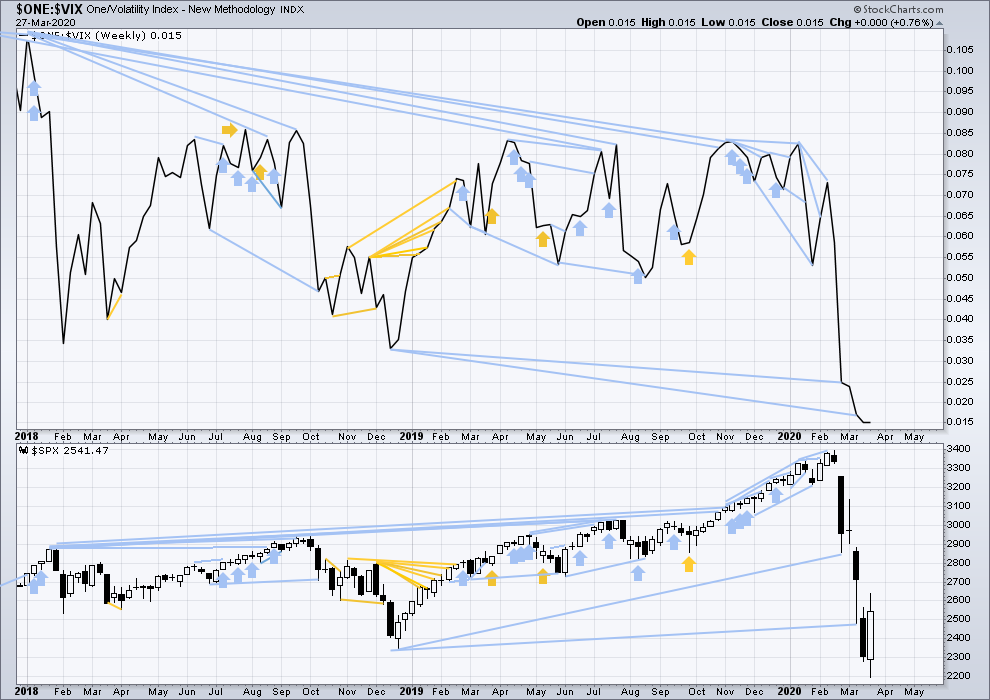
Click chart to enlarge. Chart courtesy of StockCharts.com. So that colour blind members are included, bearish signals will be noted with blue and bullish signals with yellow.
The all time high for inverted VIX was on 30th October 2017. There is now over two years of bearish divergence between price and inverted VIX.
The rise in price is not coming with a normal corresponding decline in VIX; VIX remains elevated. This long-term divergence is bearish. It may now be resolved by this last fall in price, which meets the technical definition of a bear market.
This week both price and inverted VIX moved lower to new lows. There is no new divergence.
DAILY CHART
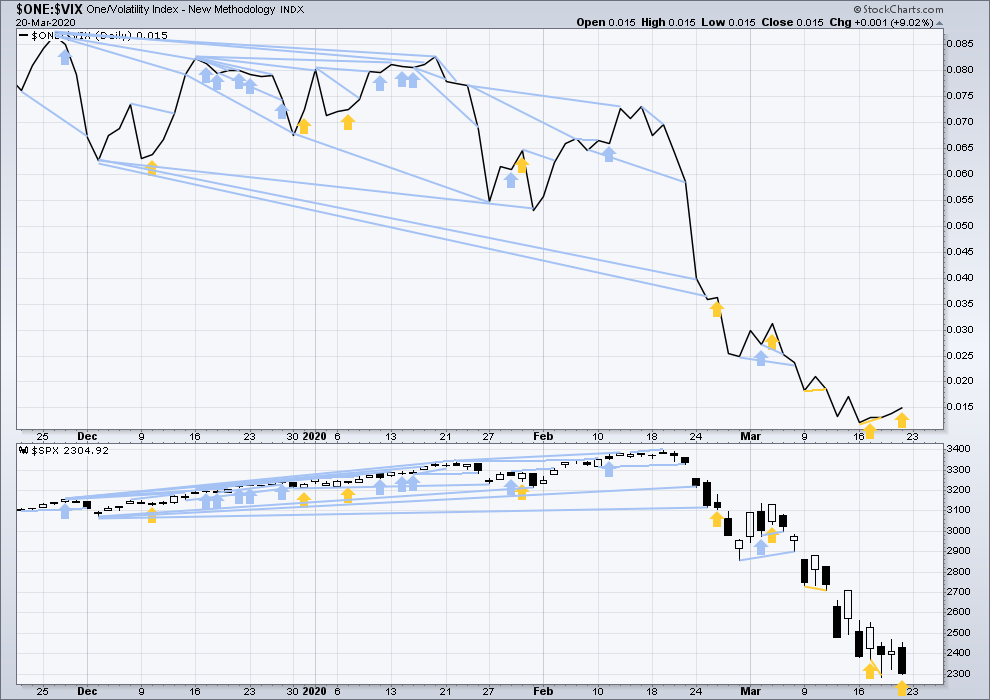
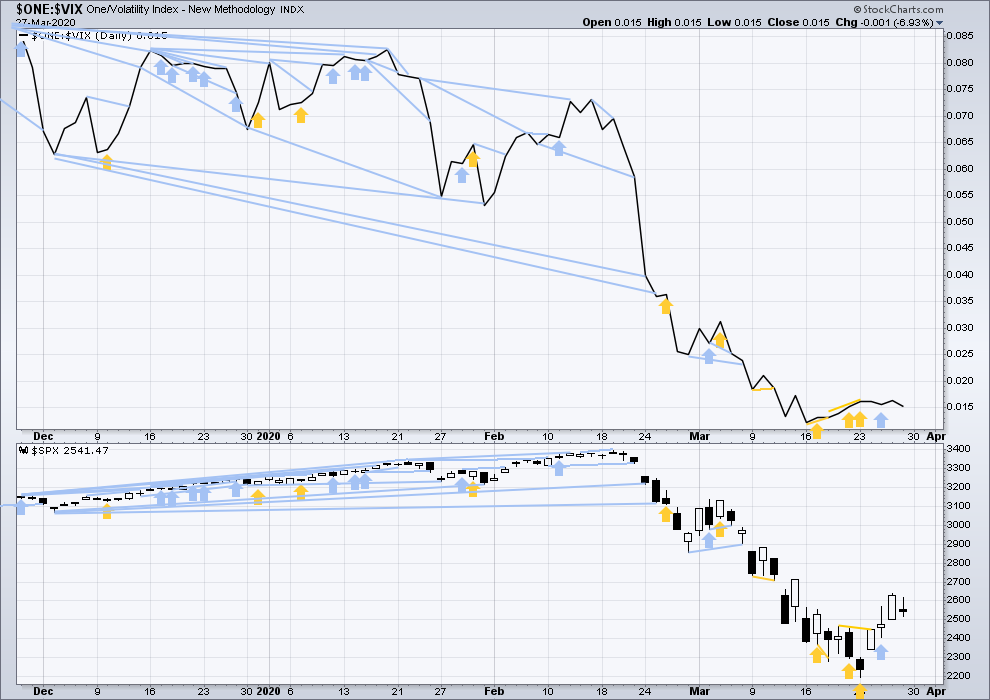
Click chart to enlarge. Chart courtesy of StockCharts.com. So that colour blind members are included, bearish signals will be noted with blue and bullish signals with yellow.
On Friday price has moved lower, but inverted VIX has moved higher. This divergence is bullish.
DOW THEORY
Dow Theory has confirmed a bear market with the following lows made on a closing basis:
DJIA: 21,712.53 – a close below this point has been made on the March 12, 2020.
DJT: 8,636.79 – a close below this point has been made on March 9, 2020.
Adding in the S&P and Nasdaq for an extended Dow Theory, a bear market has now been confirmed:
S&P500: 2,346.58 – a close below this point has now been made on March 20, 2020.
Nasdaq: 7,292.22 – a close below this point was made on the March 12, 2020.
2. Published week ending March 27, 2020:
Summary: Primary wave B may have begun. It may be either a quick sharp bounce or a long lasting sideways consolidation, which will be labelled primary wave B. Targets are 2,651 or 2,934.
Next week expect downwards or sideways movement as intermediate (B) within primary wave B unfolds. Thereafter, expect the bounce to continue to targets.
The biggest picture, Grand Super Cycle analysis, is here.
Last monthly charts are here. Video is here. Members are encouraged to view all three monthly charts. The third is much more bearish than this main wave count and remains a valid possibility.
ELLIOTT WAVE COUNTS
WEEKLY CHART
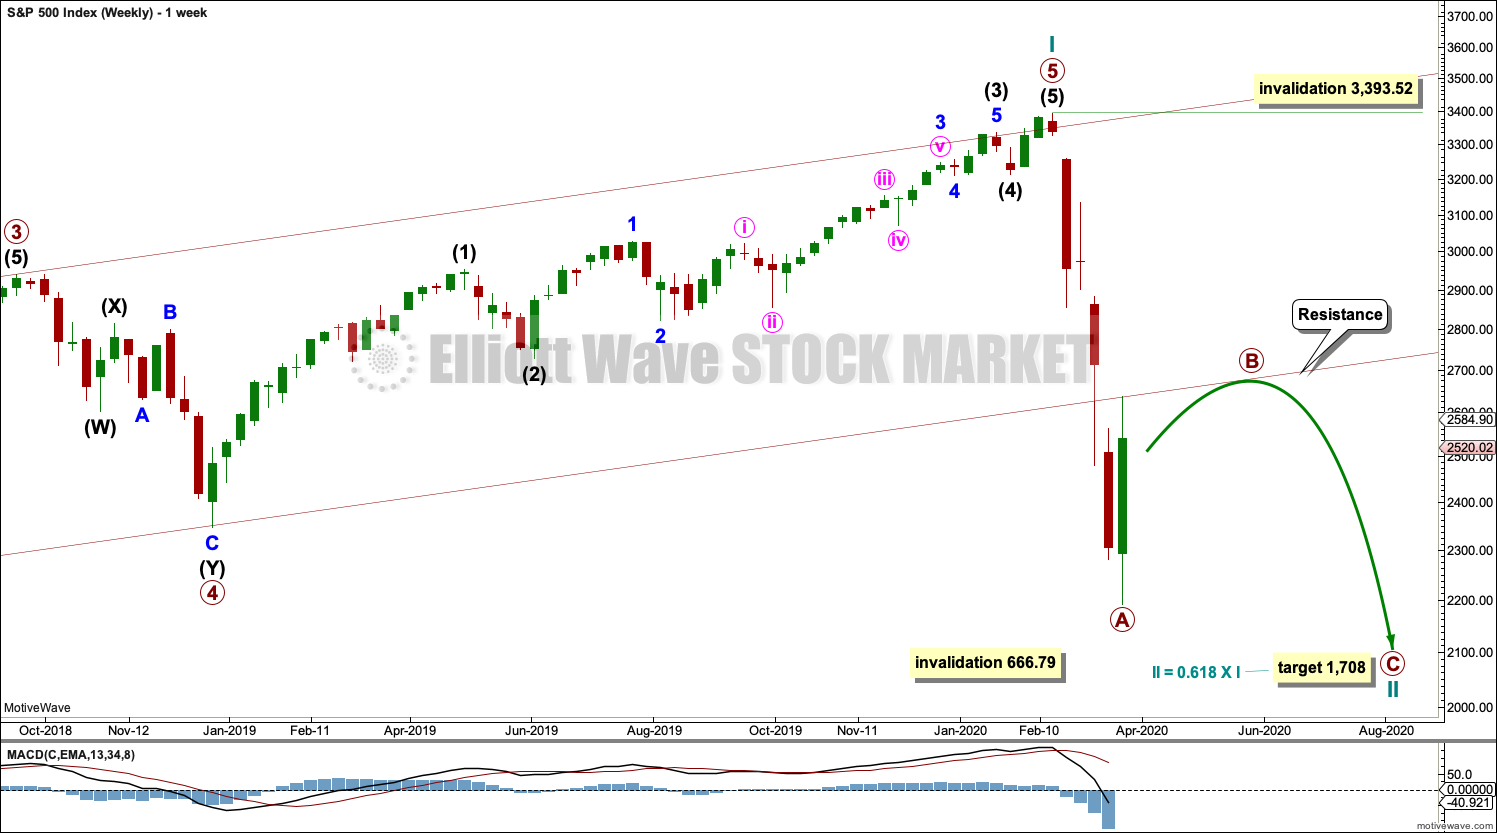
Click chart to enlarge.
The channel is now breached by a full weekly candlestick below and not touching the lower edge. Further confidence in this wave count may be had. The lower edge of this channel is this week providing resistance. It may continue to do so.
Price is now below the 0.382 Fibonacci ratio of cycle wave I at 2,352. The structure of cycle wave II may need further to go to complete. The next Fibonacci ratio at 0.618 is now a preferred target for cycle wave II to end.
Cycle wave II would most likely subdivide as a zigzag; thus far that looks like what it is unfolding. When primary waves A and B may both be complete, then the target may be calculated using a Fibonacci ratio between primary waves A and C. At that stage, the final target may change or widen to a zone.
Cycle wave II may not move beyond the start of cycle wave I below 666.79.
DAILY CHART
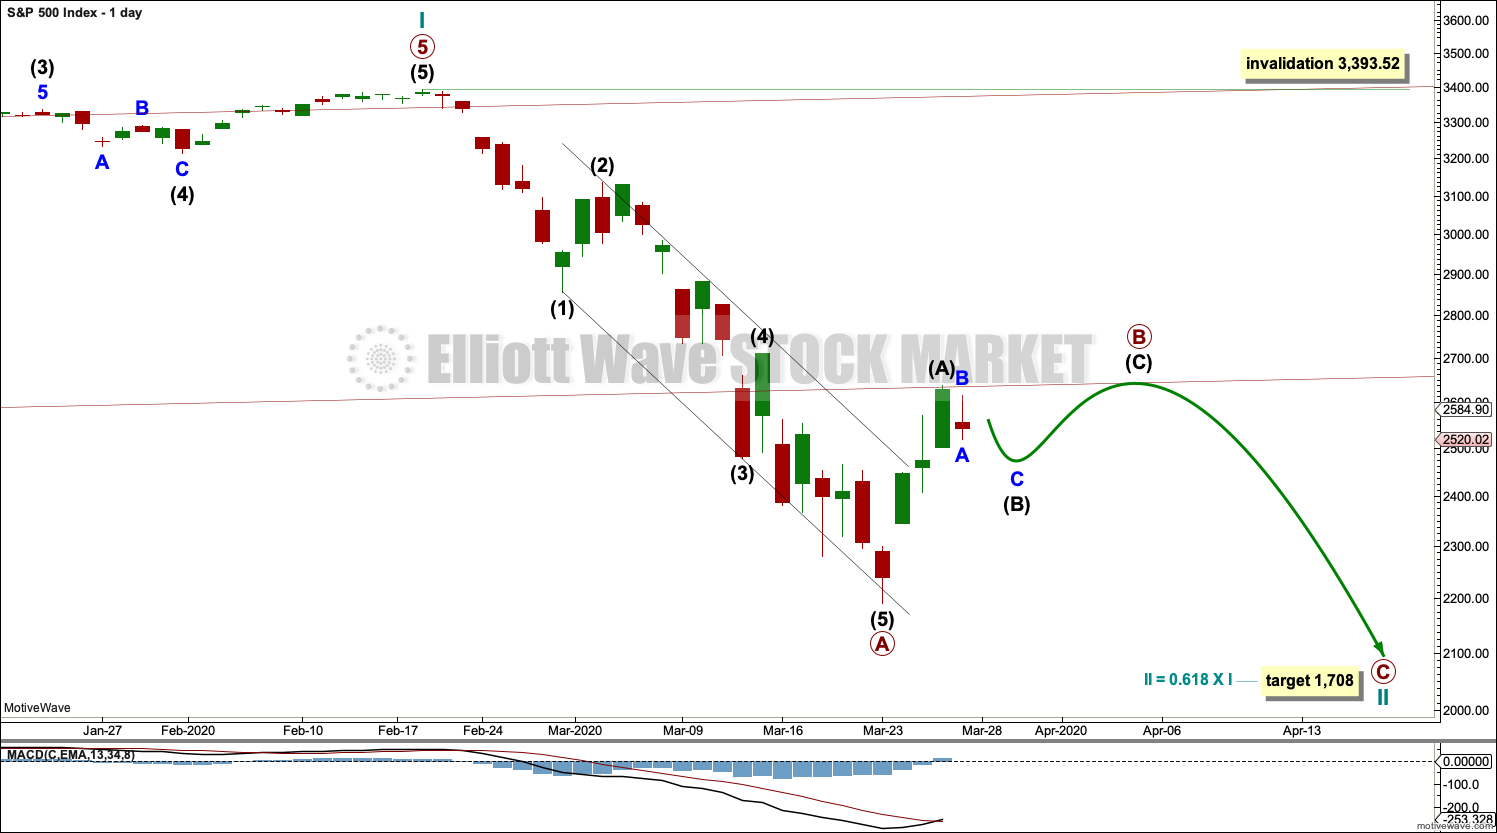
Click chart to enlarge.
Redraw the wide maroon trend channel carefully: draw the first trend line from the end of primary wave 1 at 2,093.55 (December 26, 2014), to the end of primary wave 3 at 2,940.91 (September 21, 2018), then place a parallel copy on the end of primary wave 2 at 1,810.10 (February 11, 2016). The channel is fully breached indicating a trend change from the multi-year bull trend to a new bear trend. The lower edge may now be an important line of resistance.
Cycle wave II may subdivide as any Elliott wave corrective structure except a triangle. It would most likely be a zigzag. Primary wave A may be a complete five wave impulse. Primary wave B may not move beyond the start of primary wave A above 3,393.52.
TECHNICAL ANALYSIS
WEEKLY CHART
Click chart to enlarge. Chart courtesy of StockCharts.com.
A bounce has arrived within the bear market. It may continue further.
DAILY CHART
Click chart to enlarge. Chart courtesy of StockCharts.com.
There are now eight 90% downwards days in this strong downwards movement.
At the last low:
– RSI reached deeply oversold and now exhibits short-term double bullish divergence with price.
– Stochastics reached oversold and now exhibits short-term bullish divergence with price.
– On Balance Volume exhibited bullish divergence with price, although short-term bullish divergence disappeared.
Now a 90% upwards day and two back to back 80% upwards days give strong confidence that a low is in place. It may not be the end of the bear market though; the Elliott wave structure may not be complete.
A correction within the bear market looks to have arrived. It would be reasonable to expect choppy overlapping movement for at least a week or so, possibly over a month. To see what signals may be looked for to identify a high, the two previous large bear markets will be analysed below.
BREADTH – AD LINE
WEEKLY CHART
Click chart to enlarge. Chart courtesy of StockCharts.com. So that colour blind members are included, bearish signals will be noted with blue and bullish signals with yellow.
Bear markets from the Great Depression and onwards have been preceded by an average minimum of 4 months divergence between price and the AD line with only two exceptions in 1946 and 1976. With no divergence between the AD line and price at the last all time high, this current bear market now makes a third exception.
In all bear markets in the last 90 years there is some positive correlation (0.6022) between the length of bearish divergence and the depth of the following bear market. No to little divergence is correlated with more shallow bear markets. Longer divergence is correlated with deeper bear markets.
This bear market comes after no bearish divergence. It would more likely be shallow, but this is a statement of probability and not certainty. So far it is slightly more than the 0.382 Fibonacci ratio of the bull market it is correcting (beginning March 2009).
This week an outside week closes green and the AD line supports upwards movement within the week. There is no new divergence.
Large caps all time high: 3,393.52 on 19th February 2020.
Mid caps all time high: 2,109.43 on 20th February 2020.
Small caps all time high: 1,100.58 on 27th August 2018.
DAILY CHART
Click chart to enlarge. Chart courtesy of StockCharts.com. So that colour blind members are included, bearish signals will be noted with blue and bullish signals with yellow.
Breadth should be read as a leading indicator.
To end the week both price and the AD line moved overall lower during Friday. There is no new short-term divergence.
VOLATILITY – INVERTED VIX CHART
WEEKLY CHART
Click chart to enlarge. Chart courtesy of StockCharts.com. So that colour blind members are included, bearish signals will be noted with blue and bullish signals with yellow.
This week completes an outside week, which has closed green, and inverted VIX is overall flat. There is no new short-term divergence.
DAILY CHART
Click chart to enlarge. Chart courtesy of StockCharts.com. So that colour blind members are included, bearish signals will be noted with blue and bullish signals with yellow.
On Friday price moved overall lower and inverted VIX has slightly declined. There is no new divergence.
DOW THEORY
Dow Theory has confirmed a bear market with the following lows made on a closing basis:
DJIA: 21,712.53 – a close below this point has been made on the March 12, 2020.
DJT: 8,636.79 – a close below this point has been made on March 9, 2020.
Adding in the S&P and Nasdaq for an extended Dow Theory, a bear market has now been confirmed:
S&P500: 2,346.58 – a close below this point has now been made on March 20, 2020.
Nasdaq: 7,292.22 – a close below this point was made on the March 12, 2020.
—
Careful risk management protects your trading account(s).
Follow my two Golden Rules:
1. Always trade with stops.
2. Risk only 1-5% of equity on any one trade.