
Lara’s Weekly: US OIL Elliott Wave and Technical Analysis | Charts – November 20, 2018 and March 13, 2020
1. Published November 20, 2018: In November 2018 the main Elliott wave count at that time expected new lows to eventually be made below 26.06:
Summary: Oil is in a downwards trend. A new low now below 51.67 would be another very strong bearish signal. If that happens, then the probability that Oil may continue to move reasonably below 26.06 would increase.
Classic analysis still favours a bearish Oil wave count.
MAIN ELLIOTT WAVE COUNT
MONTHLY CHART
Click chart to enlarge.
Classic technical analysis favours a bearish wave count for Oil at this time.
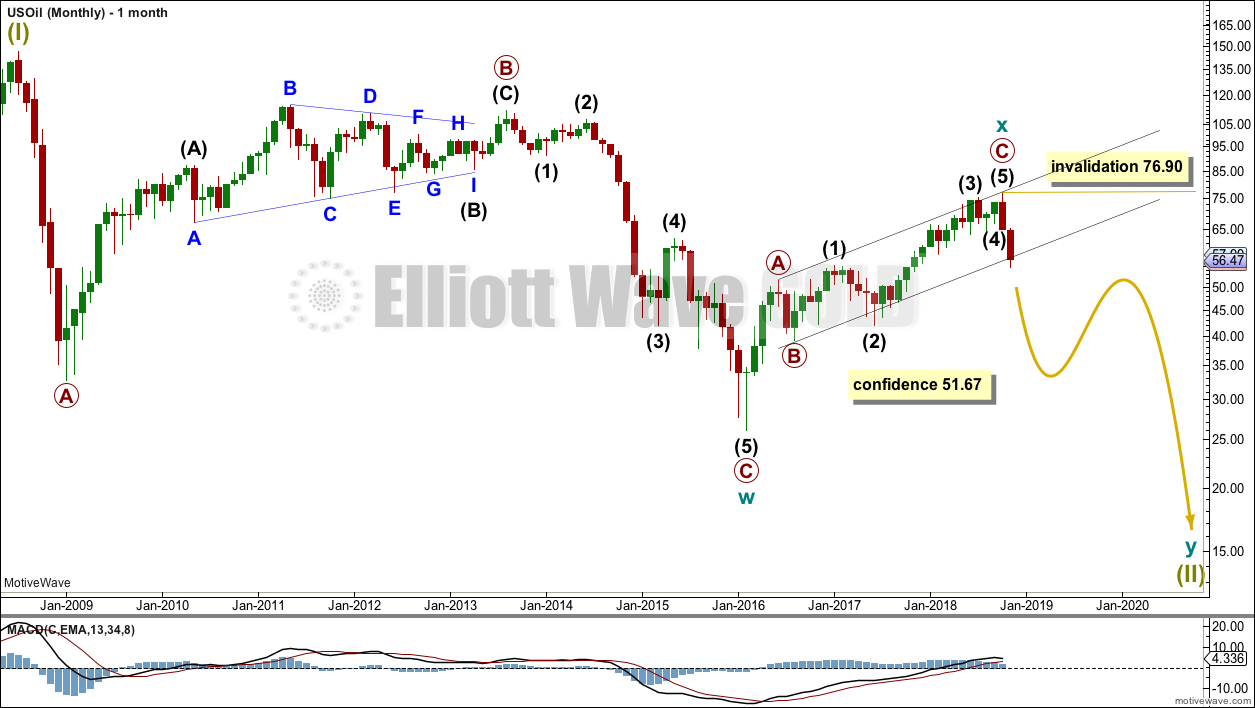
The large fall in price from the high in June 2008 to February 2016 is seen as a complete three wave structure. This large zigzag may have been only the first zigzag in a deeper double zigzag.
The first zigzag down is labelled cycle wave w. The double is joined by a now complete three in the opposite direction, a zigzag labelled cycle wave x.
The purpose of a second zigzag in a double is to deepen the correction when the first zigzag does not move price deep enough. Cycle wave y would be expected to move reasonably below the end of cycle wave w to deepen the correction. Were cycle wave y to reach equality with cycle wave w that takes Oil into negative price territory, which is not possible. Cycle wave y would reach 0.618 the length of cycle wave w at $2.33.
A better target calculation would be using the Fibonacci ratios between primary waves A and C within cycle wave y. This cannot be done until both primary waves A and B are complete.
Within cycle wave y, no second wave correction nor B wave may move beyond its start above 76.90.
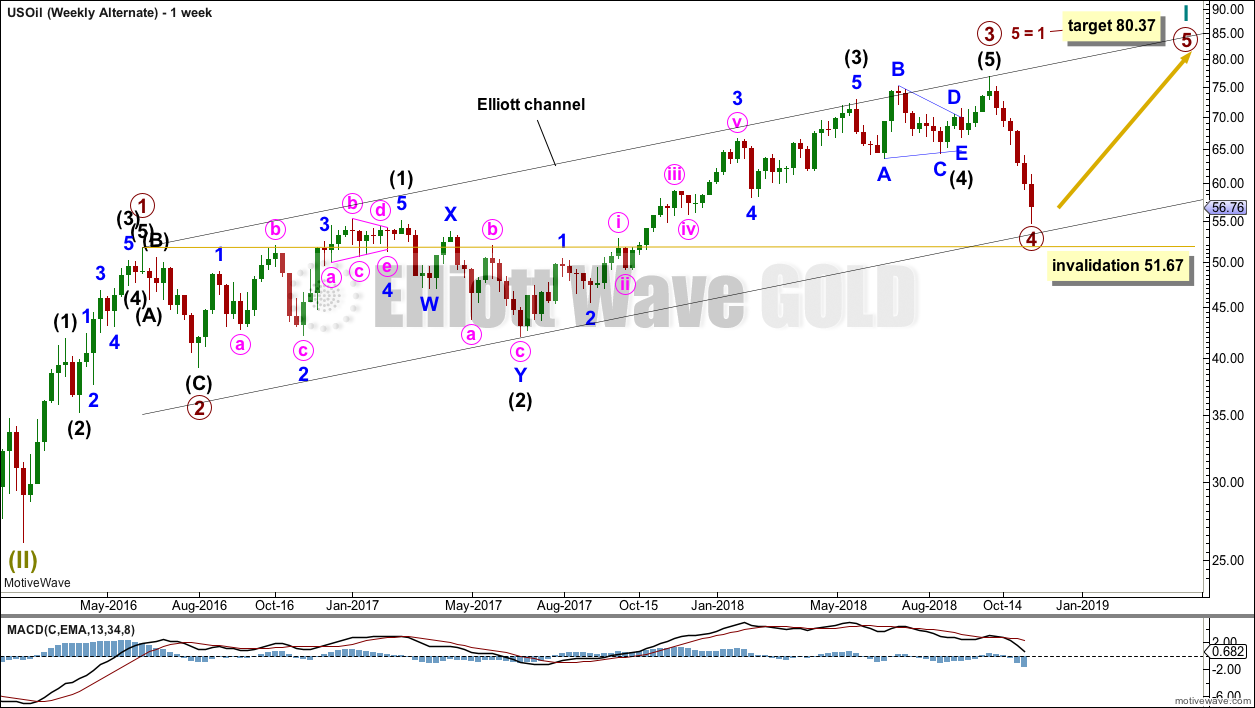
WEEKLY CHART
Click chart to enlarge.
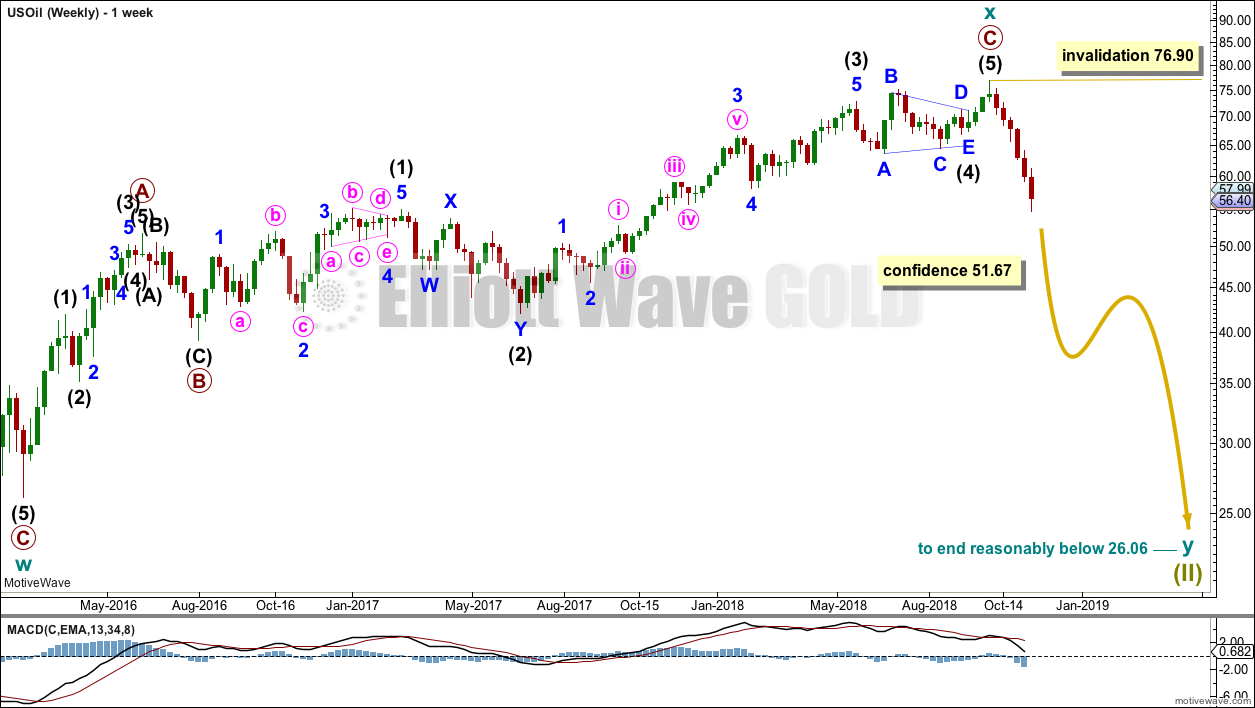
Cycle wave x is seen as a complete zigzag. Within the zigzag, primary wave C is a five wave impulse and within it intermediate wave 4 is a triangle.
A new low below 51.67 would add confidence in this bearish wave count. At that stage, the bullish alternate below would be invalidated.
DAILY CHART
Click chart to enlarge.
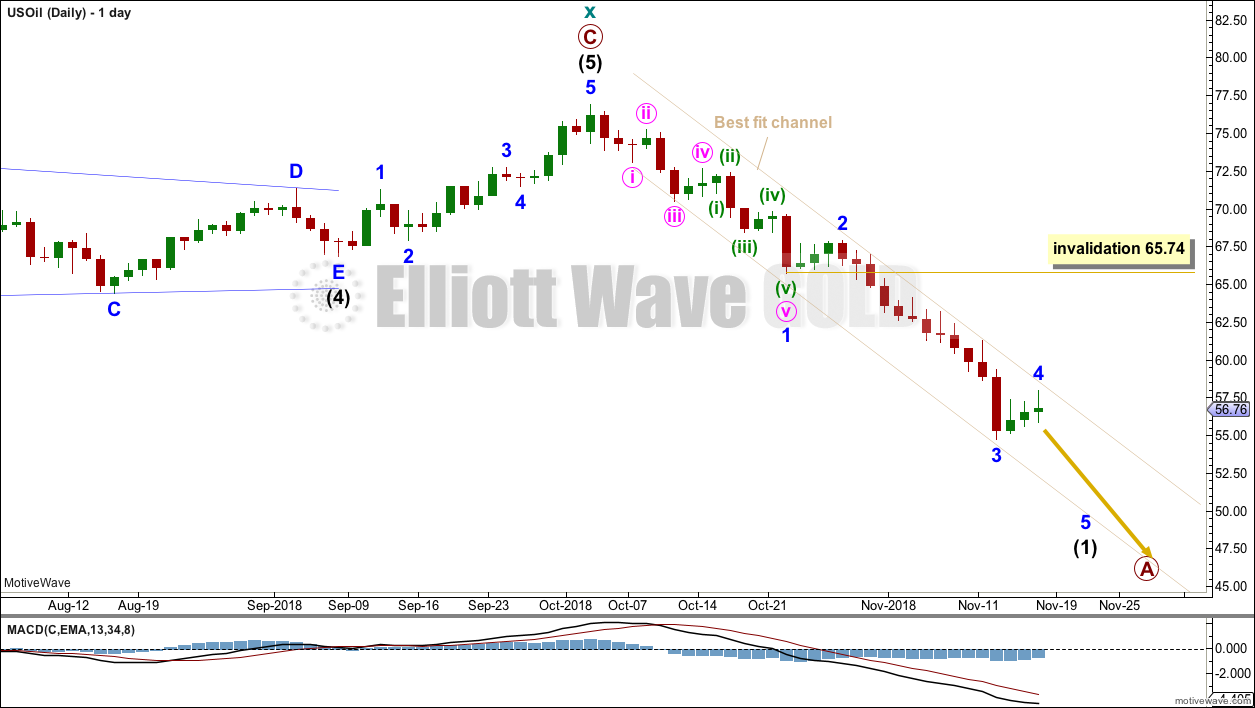
Attention now turns to the structure of downwards movement. An impulse is unfolding lower.
Minor wave 3 is longer than minor wave 1 and does not exhibit a Fibonacci ratio to minor wave 1.
Minor wave 4 may remain contained within the best fit channel. Minor wave 4 may not move into minor wave 1 price territory above 65.74. If the upper edge of the channel provides resistance here, then minor wave 4 should be over on Friday and next week should begin with downwards movement.
If price moves above 65.74 prior to making new lows, then this wave count would be changed to see intermediate wave (1) complete. The invalidation point would then move up to 76.90. Intermediate wave (2) may not move beyond the start of intermediate wave (1).
ALTERNATE ELLIOTT WAVE COUNT
MONTHLY CHART
Click chart to enlarge.
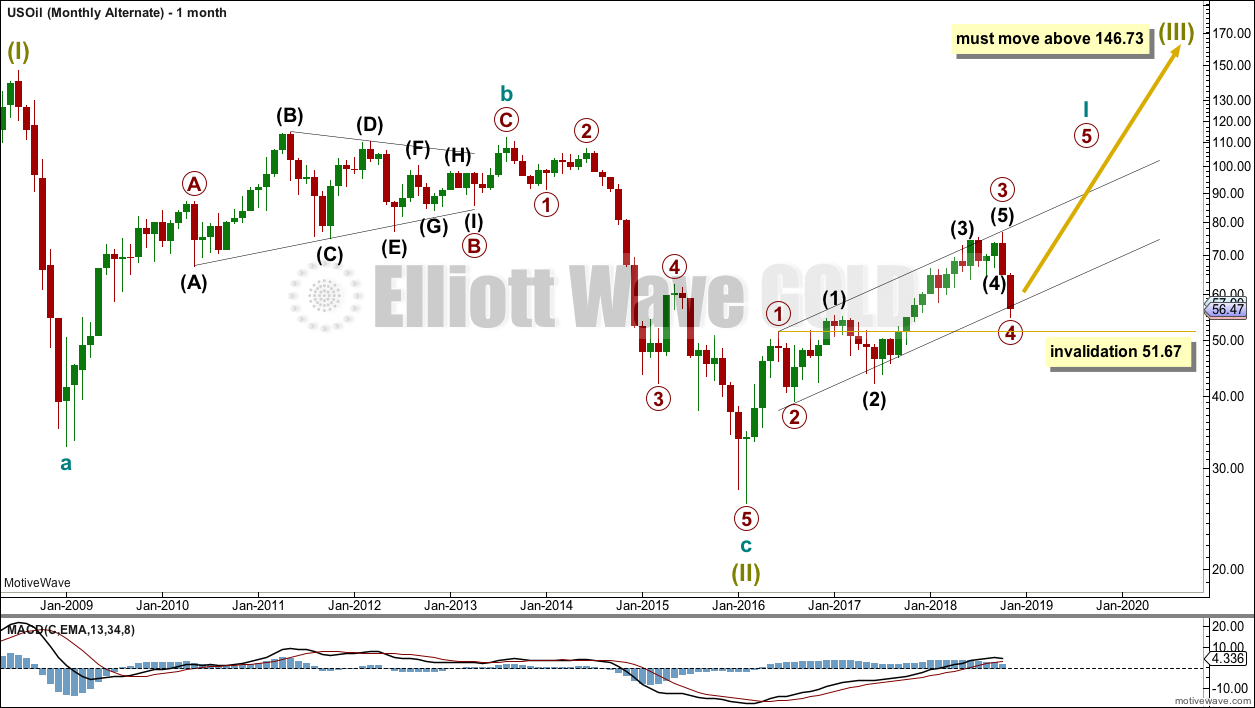
All the subdivisions for both wave counts are the same, but by changing the degree of labelling a very different wave count is seen.
If the degree of labelling for the large zigzag down to the last low is moved up one degree, it may have been the end of a correction labelled Super Cycle wave (II). Super Cycle wave (III) may have begun.
Within Super Cycle wave (III), cycle wave I would be an incomplete impulse.
Within cycle wave I, primary waves 1 through to 3 may be complete. The current strong downwards movement may be primary wave 4. Primary wave 4 may not move into primary wave 1 price territory below 51.67.
WEEKLY CHART
Click chart to enlarge.
This wave count sees the subdivisions of upwards movement from the low in February 2016 in the same way. A-B-C of a zigzag subdivides 5-3-5, exactly the same as 1-2-3 of an impulse.
Primary wave 3 may have been complete at the last high. Primary wave 4 may be unfolding as a zigzag. Zigzags can be relatively quick structures. This is possible.
However, primary wave 2 was a zigzag. There would be no alternation in structure between primary waves 2 and 4. This reduces the probability of this wave count.
DAILY CHART
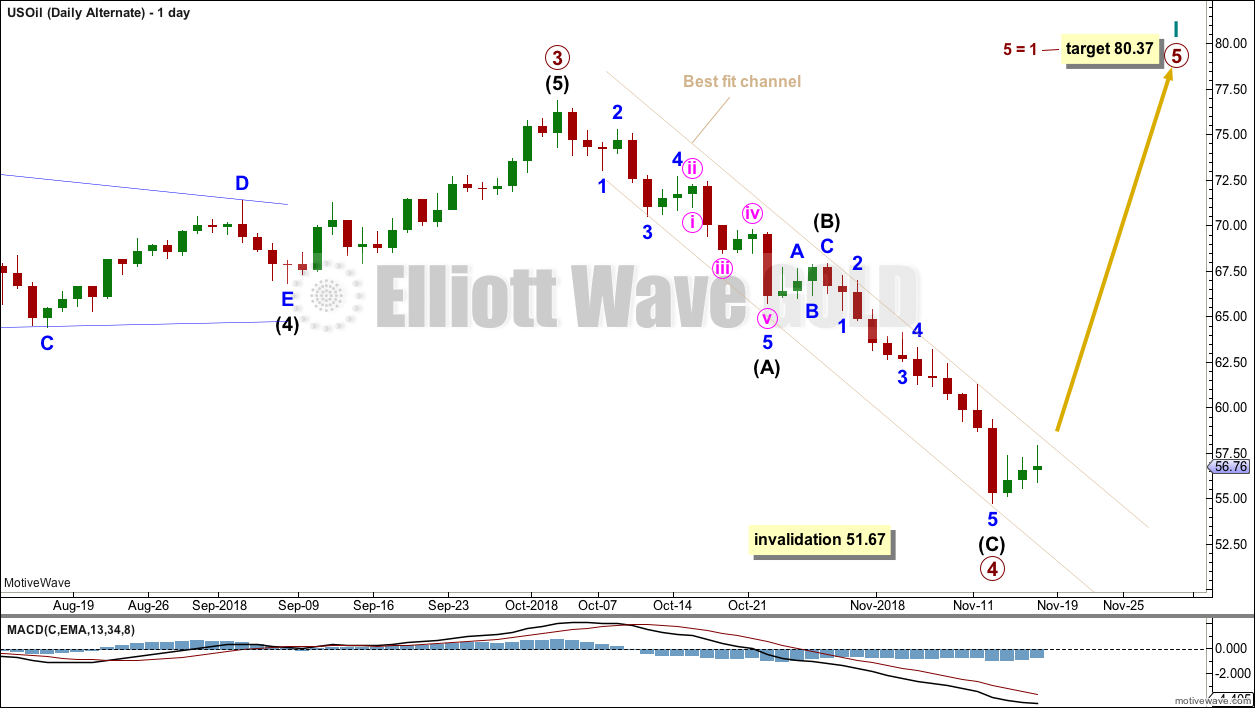
Click chart to enlarge.
If this downwards movement in price is primary wave 4, then it should be over here or very soon. It is possible to see a zigzag complete at the last low.
However, there is no candlestick reversal pattern and the last three green daily candlesticks are all small range days. This upwards movement looks too weak to be considered the start of a new trend; it looks much more likely to be a small counter trend bounce. Classic technical analysis does not support this wave count.
TECHNICAL ANALYSIS
MONTHLY CHART
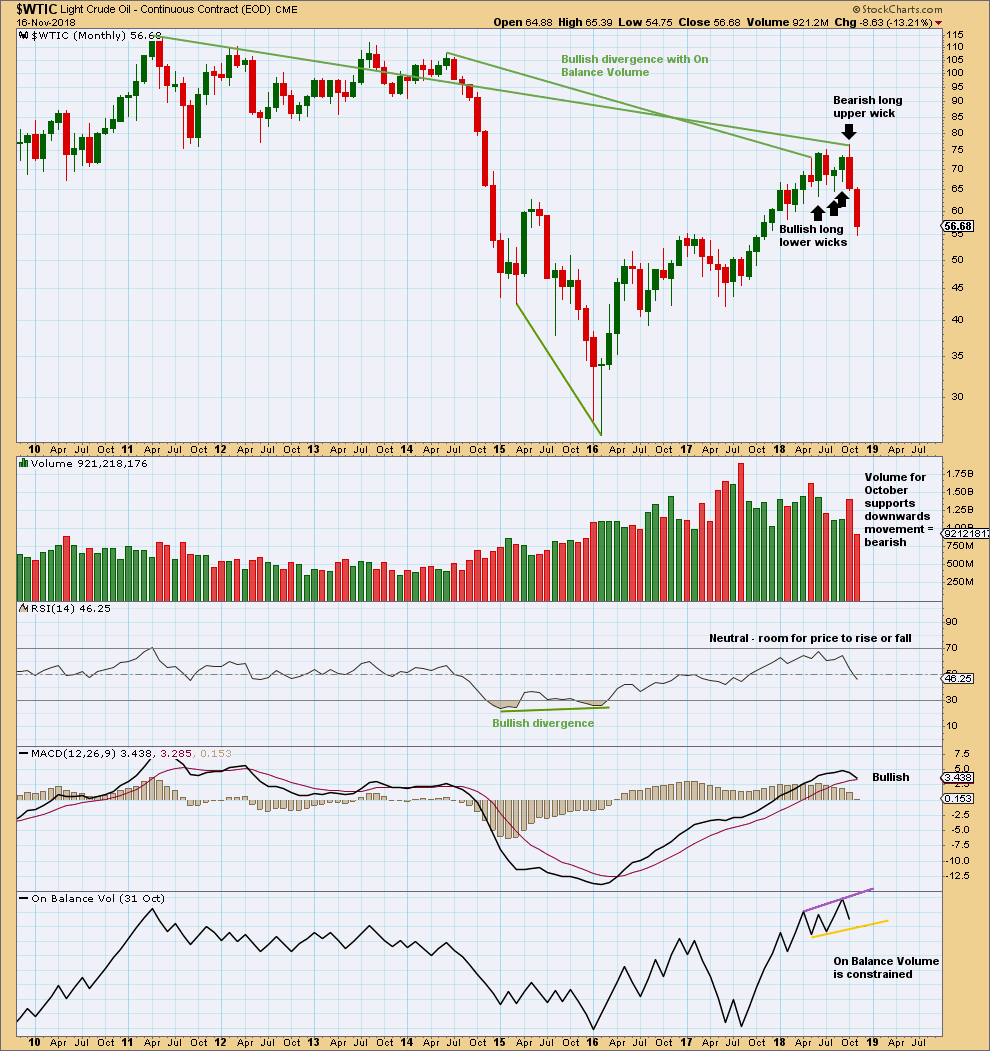
Click chart to enlarge. Chart courtesy of StockCharts.com.
The larger trend remains upwards.
With a long upper candlestick wick and support from volume, the last completed month of October is bearish. On its own, this is not an indication of the end of the upwards trend though; it is noted that August 2017 was similar yet price continued higher.
However, the month of October also completes a Bearish Engulfing candlestick pattern. This is a strong reversal pattern. This strong reversal pattern is now being followed by more downwards movement. Now it does look like there may have been a trend change.
Bullish divergence between price and On Balance Volume remains, and is still a strong technical indicator that price may continue upwards to make new highs.
WEEKLY CHART
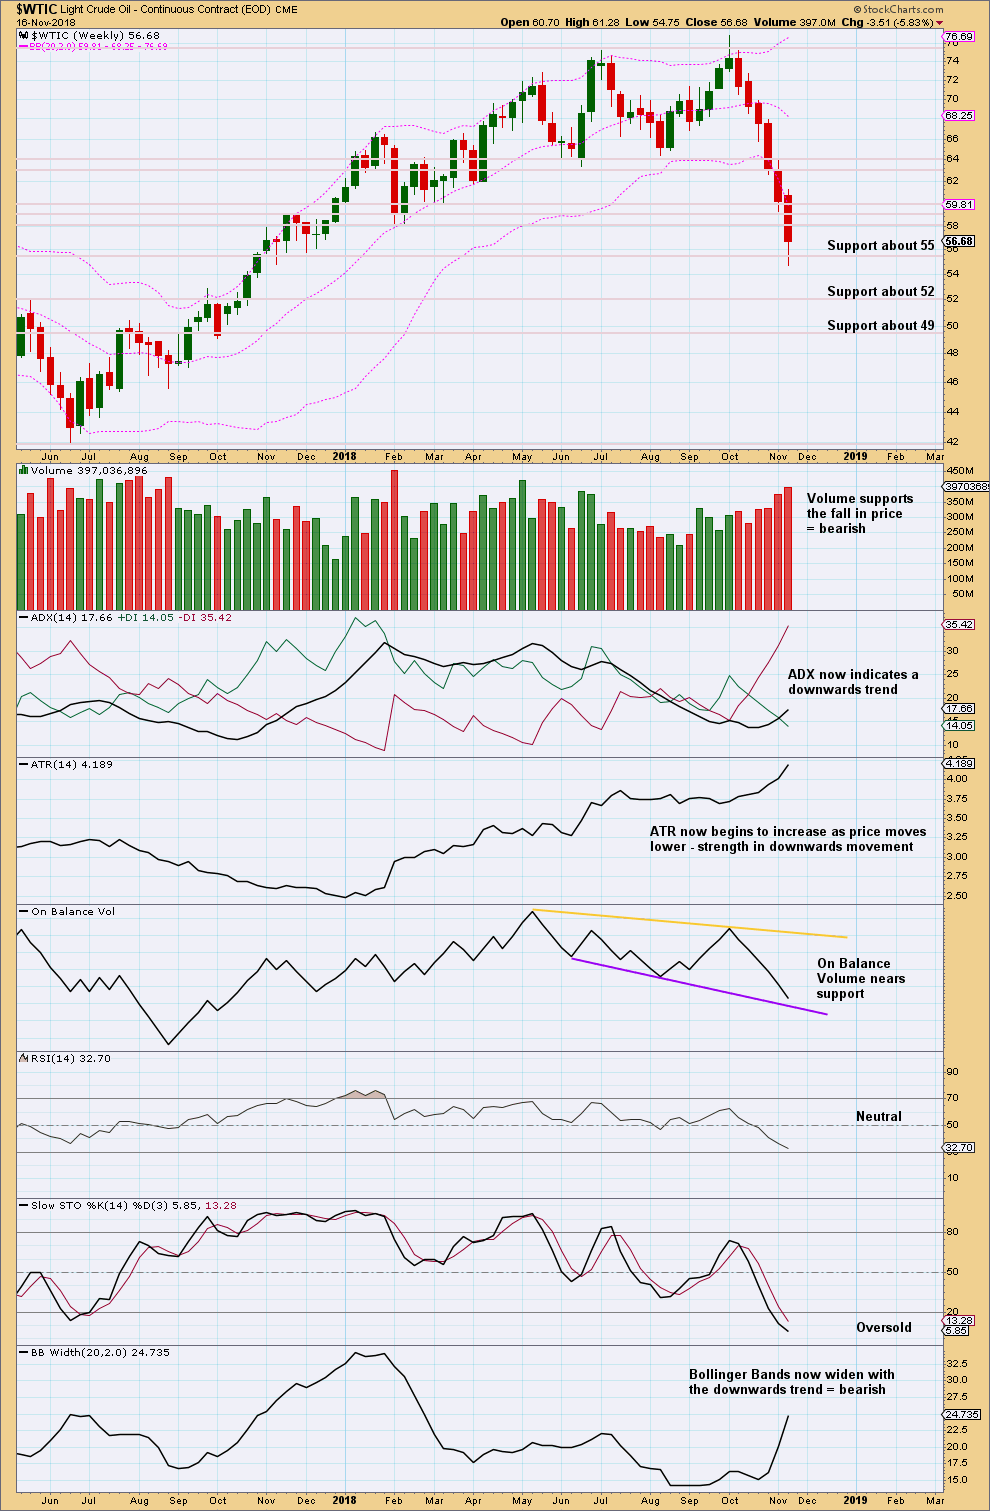
Click chart to enlarge. Chart courtesy of StockCharts.com.
There is still plenty of room for this downwards trend to continue.
At this stage, only Stochastics is now extreme and all other indicators are not yet oversold or extreme.
With volume continuing to support downwards movement, expect price to continue to fall. Only consider a low is in place if there is a bullish candlestick reversal pattern on the weekly or daily chart.
DAILY CHART
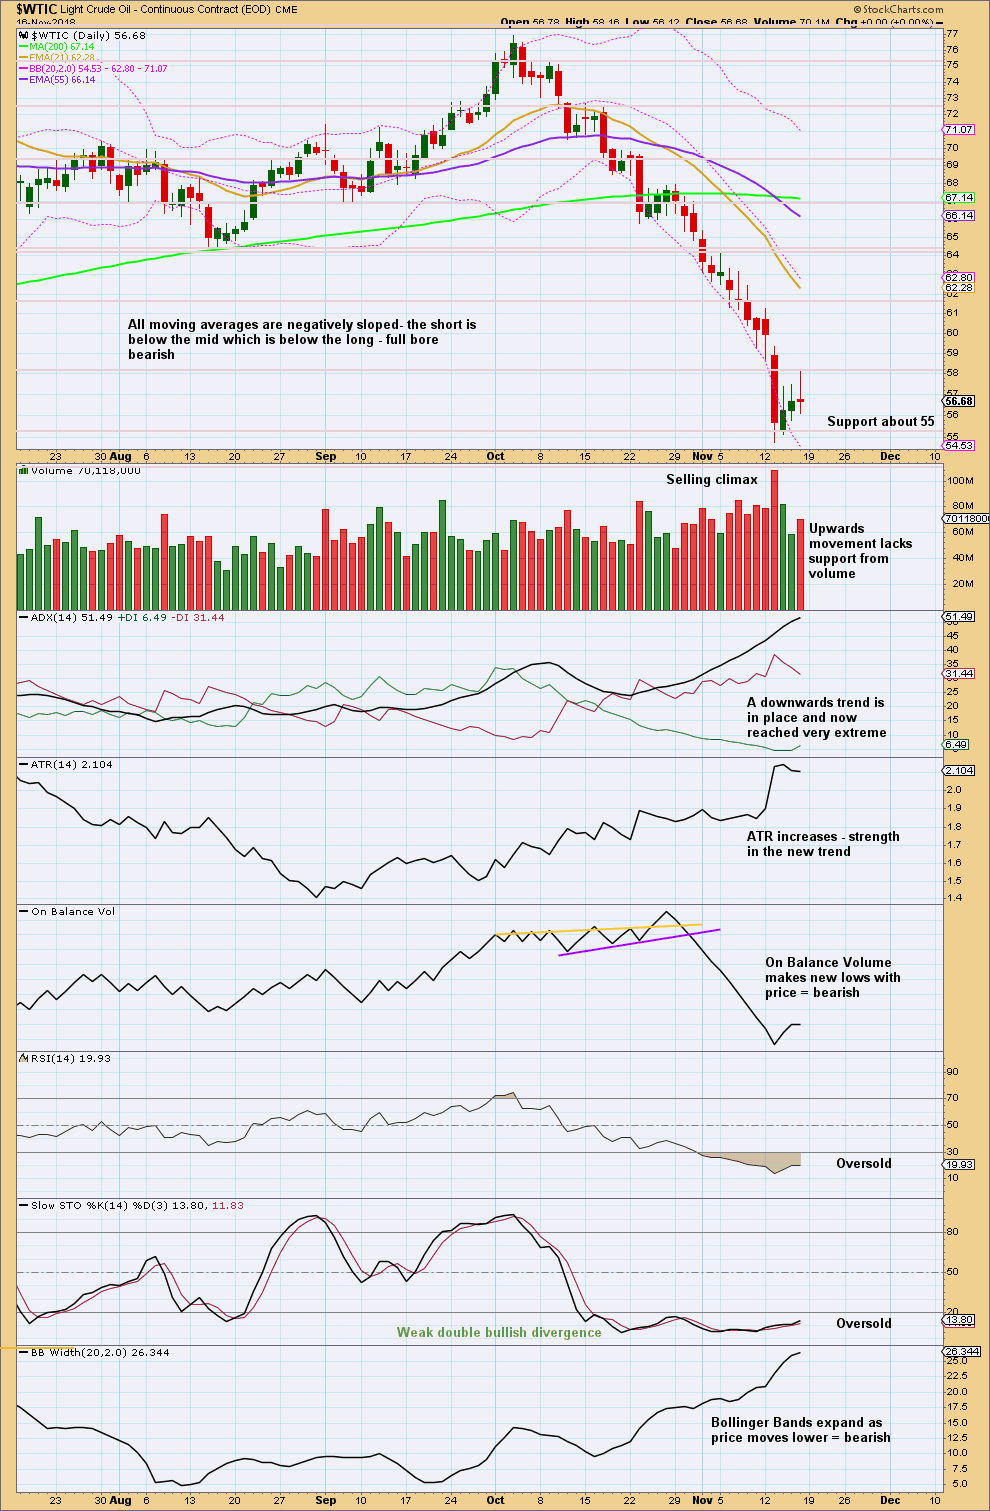
Click chart to enlarge. Chart courtesy of StockCharts.com.
I have taken some time to look back at the last strong bearish trend from Oil from about May 2014 to January 2016. I have noticed that downwards waves often end with support from volume, and sometimes do not even end with a long lower wick. Bullish reversal patterns are often but not always found at lows. RSI can reach very extreme and remain so for as long as three months when this market has a strong downwards trend. At lows Stochastics often will exhibit bullish divergence, but this can be rather weak. At lows RSI sometimes, not always, exhibits bullish divergence and can remain deeply oversold for long periods of time.
US Oil is a particularly difficult market to find lows in. It can trend strongly for very long periods of time with indicators remaining very extreme.
At this time, there is now clearly a downwards trend in place. This could continue for months yet. While price remains within the channel on the daily Elliott wave chart, expect it to continue to fall.
Expect that a low has been found only if a bullish candlestick reversal pattern appears, or the channel is clearly breached. But note that even if these occur, that any bounce may still be short lived.
The selling climax of the 13th of November does not mean that a low may be in place. This selling climax may now be relieved by three days of a shallow bounce.
2. Published March 13, 2020: At this time a final target of $9.77 was calculated and added to the analysis:
Summary: A multi-week interruption to the downwards trend may continue for another few days. Thereafter, the downwards trend may resume to a final target at 9.77.
MAIN ELLIOTT WAVE COUNT – BEARISH
MONTHLY CHART
Click chart to enlarge.
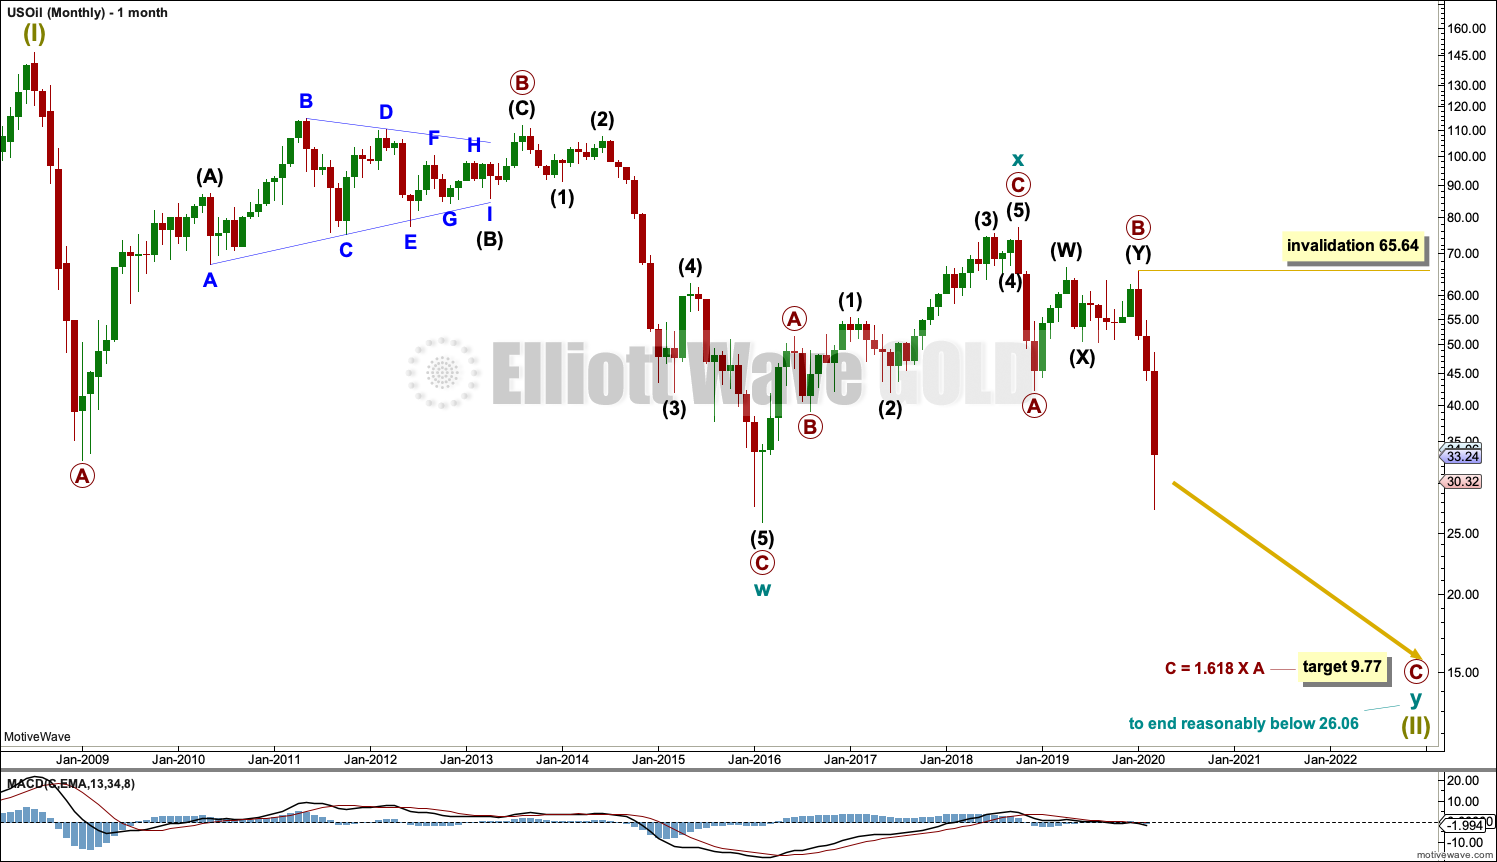
The basic Elliott wave structure is five steps forward and three steps back. This Elliott wave count expects that US Oil is still within a three steps back pattern, which began in July 2008. The Elliott wave count expects that the bear market for US Oil continues.
This Elliott wave corrective structure is a double zigzag, which is a fairly common structure. The correction is labelled Super Cycle wave (II).
The first zigzag in the double is complete and labelled cycle wave w. The double is joined by a three in the opposite direction labelled cycle wave x, which subdivides as a zigzag. The second zigzag in the double may now have begun, labelled cycle wave y.
The purpose of a second zigzag in a double zigzag is to deepen the correction when the first zigzag does not move price deep enough. To achieve this purpose cycle wave y may be expected to move reasonably below the end of cycle wave w at 26.06.
Primary wave C would reach equality in length with primary wave A at 31.11. This target is not low enough; it would not see cycle wave y move reasonably below the end of cycle wave w at 26.06. The next Fibonacci ratio of 1.618 is used to calculate a target for primary wave C and cycle wave y to end.
Cycle wave y is expected to subdivide as a zigzag, which subdivides 5-3-5.
Cycle wave w lasted 7.6 years and cycle wave x lasted 2.7 years. Cycle wave y now looks like it may be over within a few more months.
Within primary wave C, no second wave correction may move beyond the start of its first wave above 65.64.
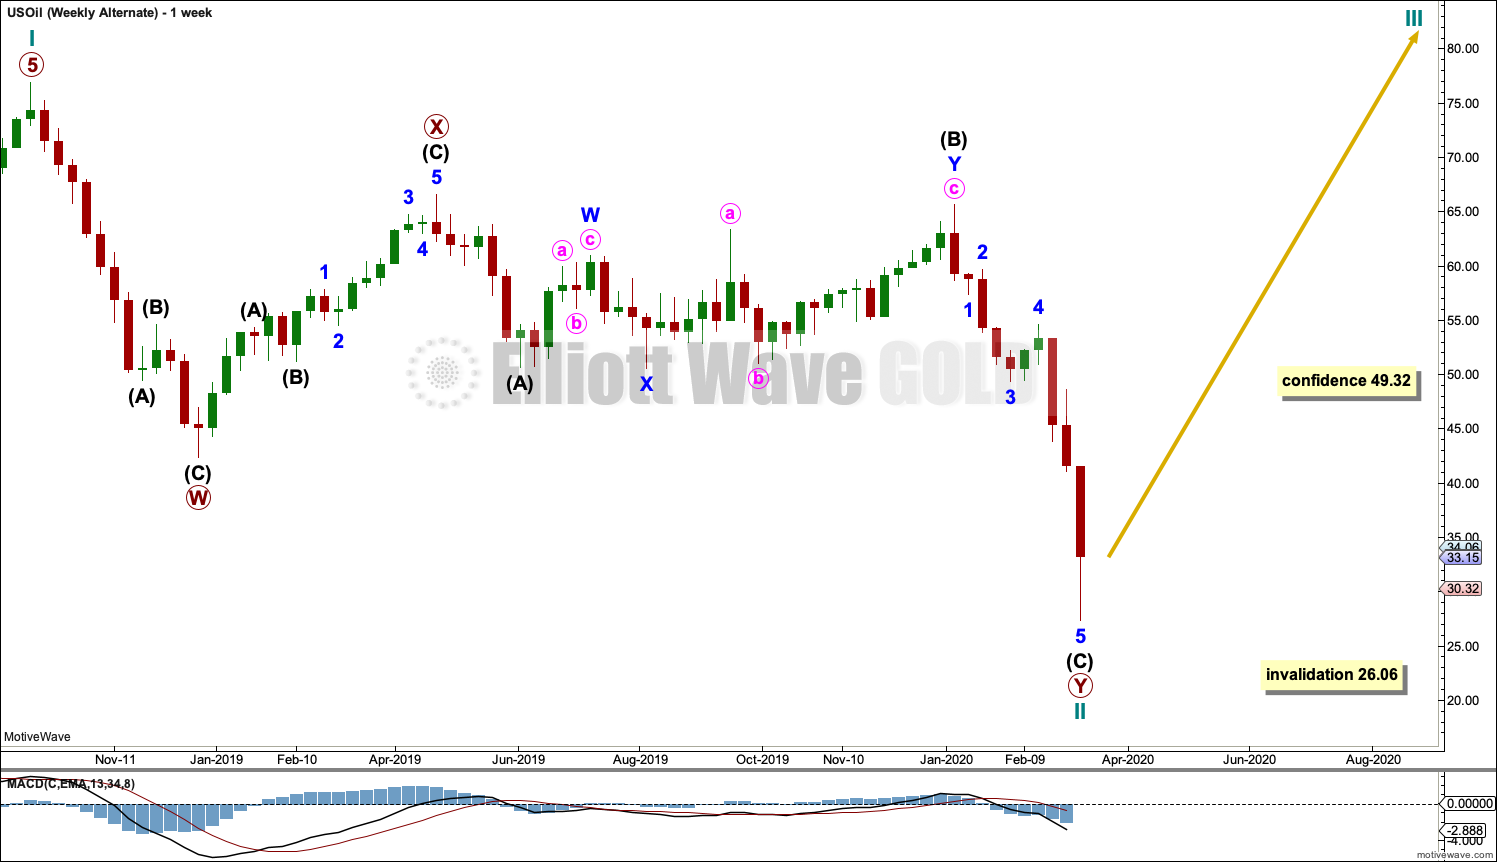
WEEKLY CHART

Click chart to enlarge.
This weekly chart shows all of cycle wave y so far.
Cycle wave y is expected to subdivide as a zigzag. A zigzag subdivides 5-3-5. Primary wave A must subdivide as a five wave structure if this wave count is correct.
Primary wave A may be a complete five wave impulse at the last low.
Primary wave B may be a complete double combination: zigzag – X – flat. Intermediate wave (W) fits as a zigzag. Intermediate wave (Y) may be a complete regular flat correction.
Primary wave C must subdivide as a five wave motive structure, most likely an impulse. Within primary wave C, intermediate waves (1) through to (3) may be complete. Intermediate wave (4) may not move into intermediate wave (1) price territory above 49.32.
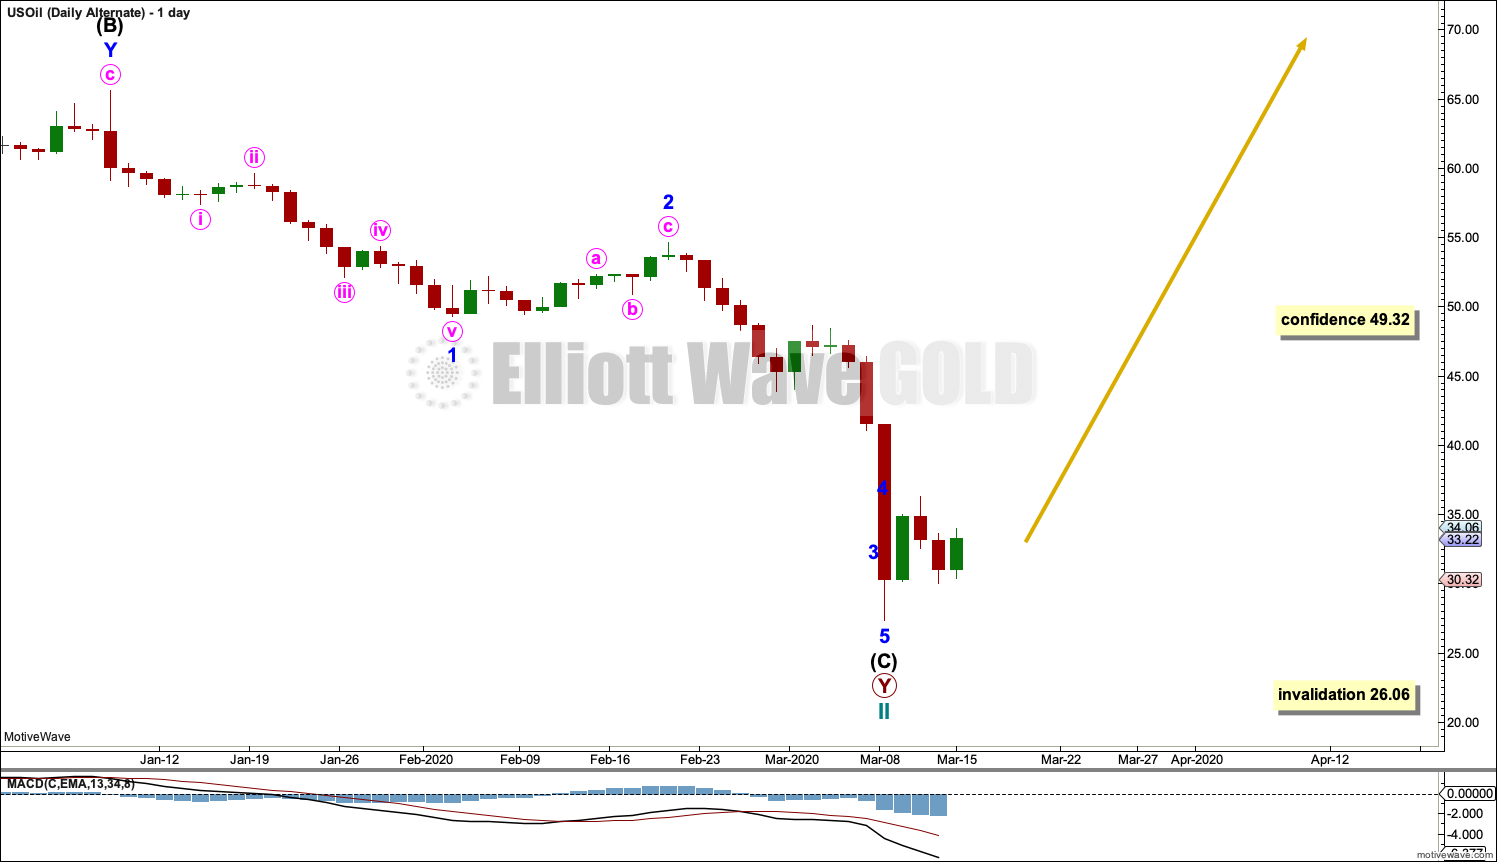
DAILY CHART
Click chart to enlarge.
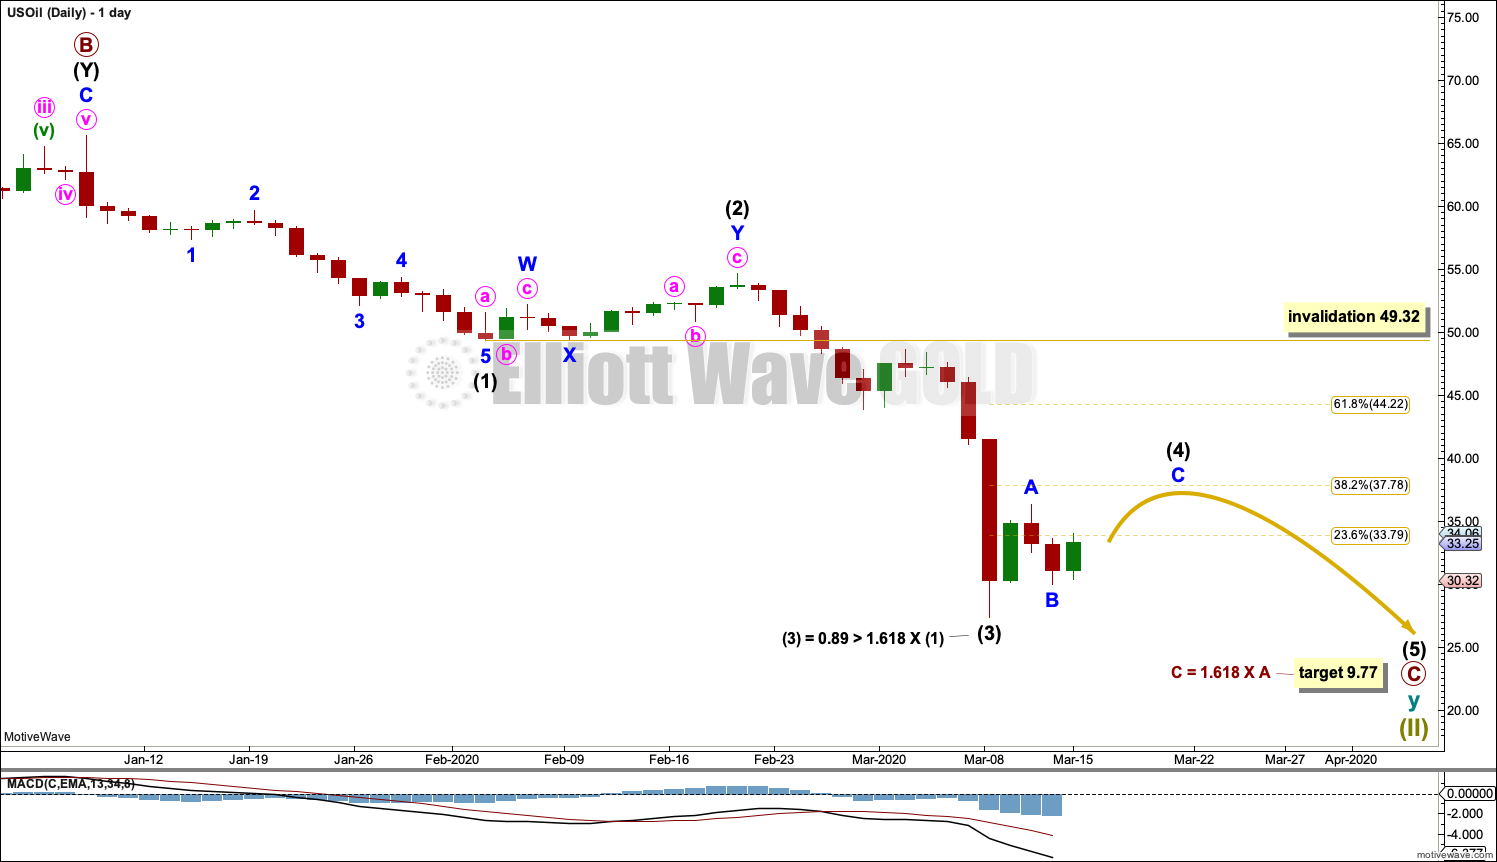
Primary wave C must subdivide as a five wave motive structure, most likely an impulse. Within primary wave C, intermediate waves (1) through to (3) may now be complete.
Although it looks like a three wave structure, intermediate wave (3) is labelled as complete. There may have been a quick fourth wave correction that does not show up on the daily chart for minor wave 4. This would be typical behaviour for a commodity.
Intermediate wave (4) may end about the 0.382 Fibonacci ratio of intermediate wave (3). Thereafter, intermediate wave (5) may continue downwards towards the final target.
When intermediate wave (4) may be complete, then the final target may be calculated at intermediate, primary and cycle degrees. At that stage, the target may change or may widen to a zone.
ALTERNATE ELLIOTT WAVE COUNT
MONTHLY CHART
Click chart to enlarge.
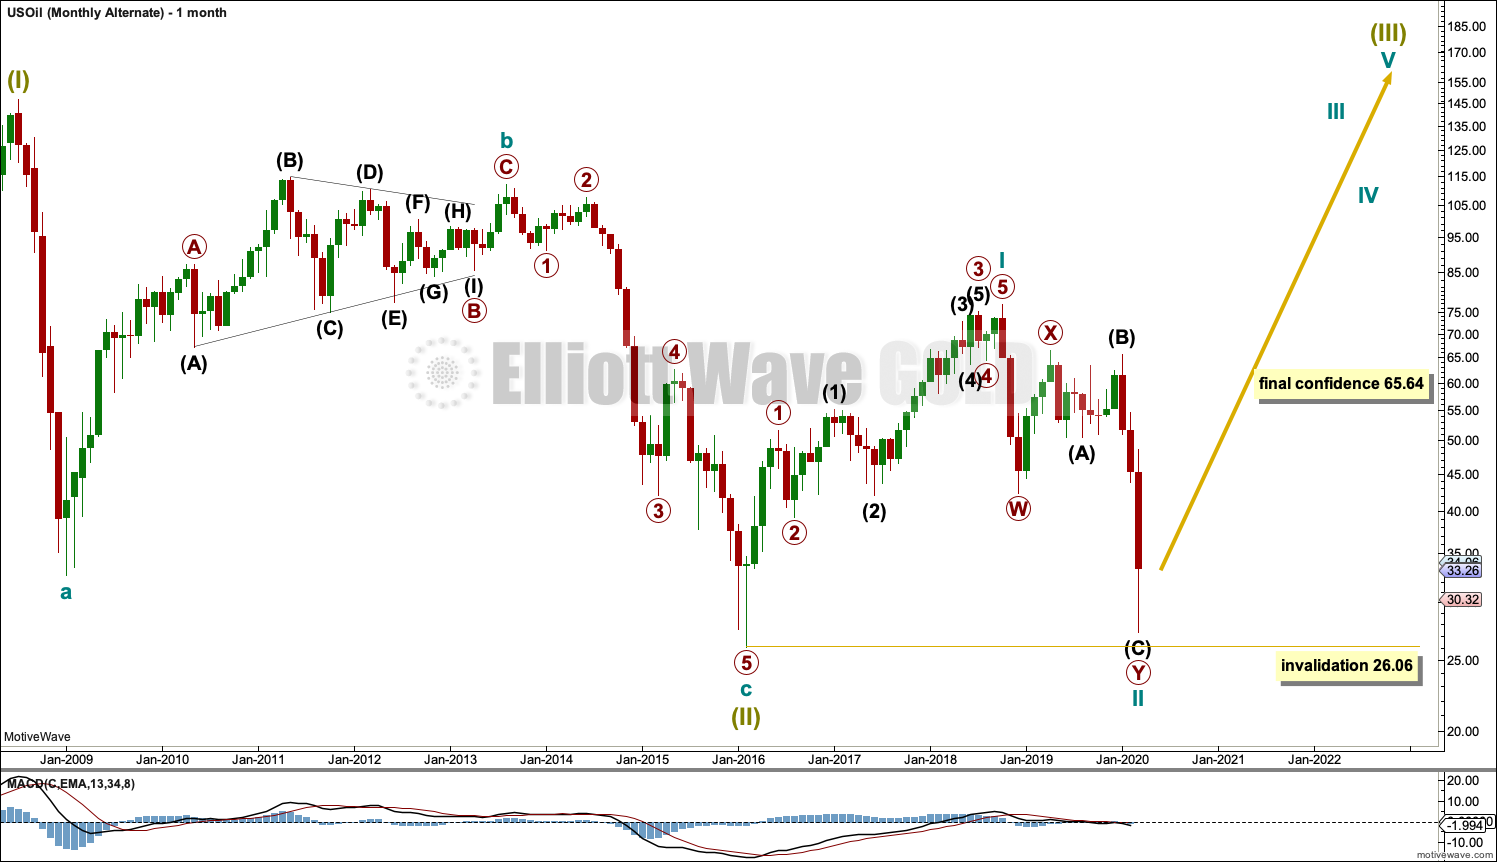
It is possible that the bear market is over for Oil and a new bull market has begun.
For a bullish wave count for Oil, the upwards wave from the major low at 26.06 in February 2016 must be seen as a complete five wave impulse. This is labelled cycle wave I.
Cycle wave II may be continuing lower as a double zigzag. Cycle wave II may no move beyond the start of cycle wave I below 26.06.
WEEKLY CHART
Click chart to enlarge.
Cycle wave II may be continuing lower as a double zigzag. The structure may be complete here, or minor wave 5 of intermediate wave (C) may continue lower.
Cycle wave II may not move beyond the start of cycle wave I below 26.06.
DAILY CHART
Click chart to enlarge.
The structure of intermediate wave (C) may be complete. This wave count now requires a new high above 54.65 for confidence.
TECHNICAL ANALYSIS
MONTHLY CHART
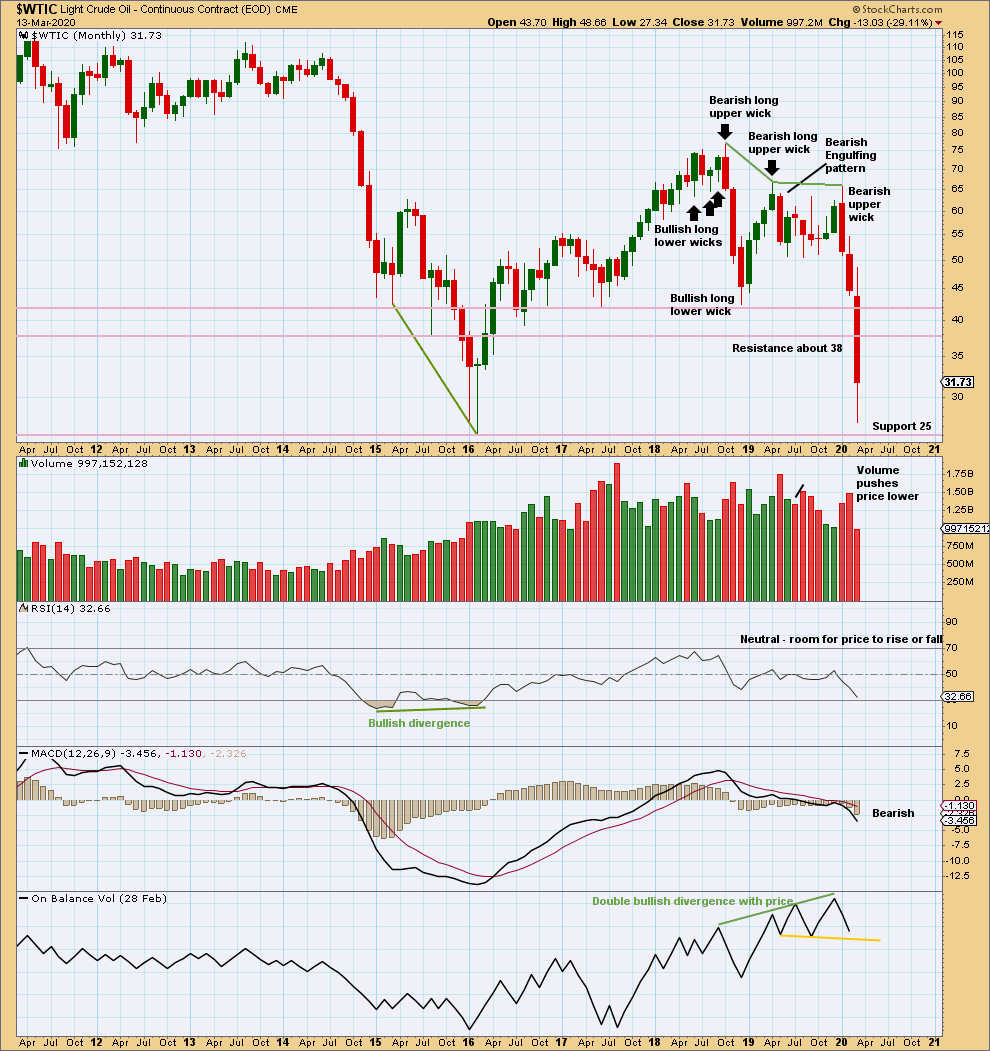
Click chart to enlarge. Chart courtesy of StockCharts.com.
Both January and February have increased range and volume for downwards movement. This supports the main Elliott wave count.
A close below support about 42 on a downwards day with support from volume is significant downwards breakout at this time frame.
WEEKLY CHART
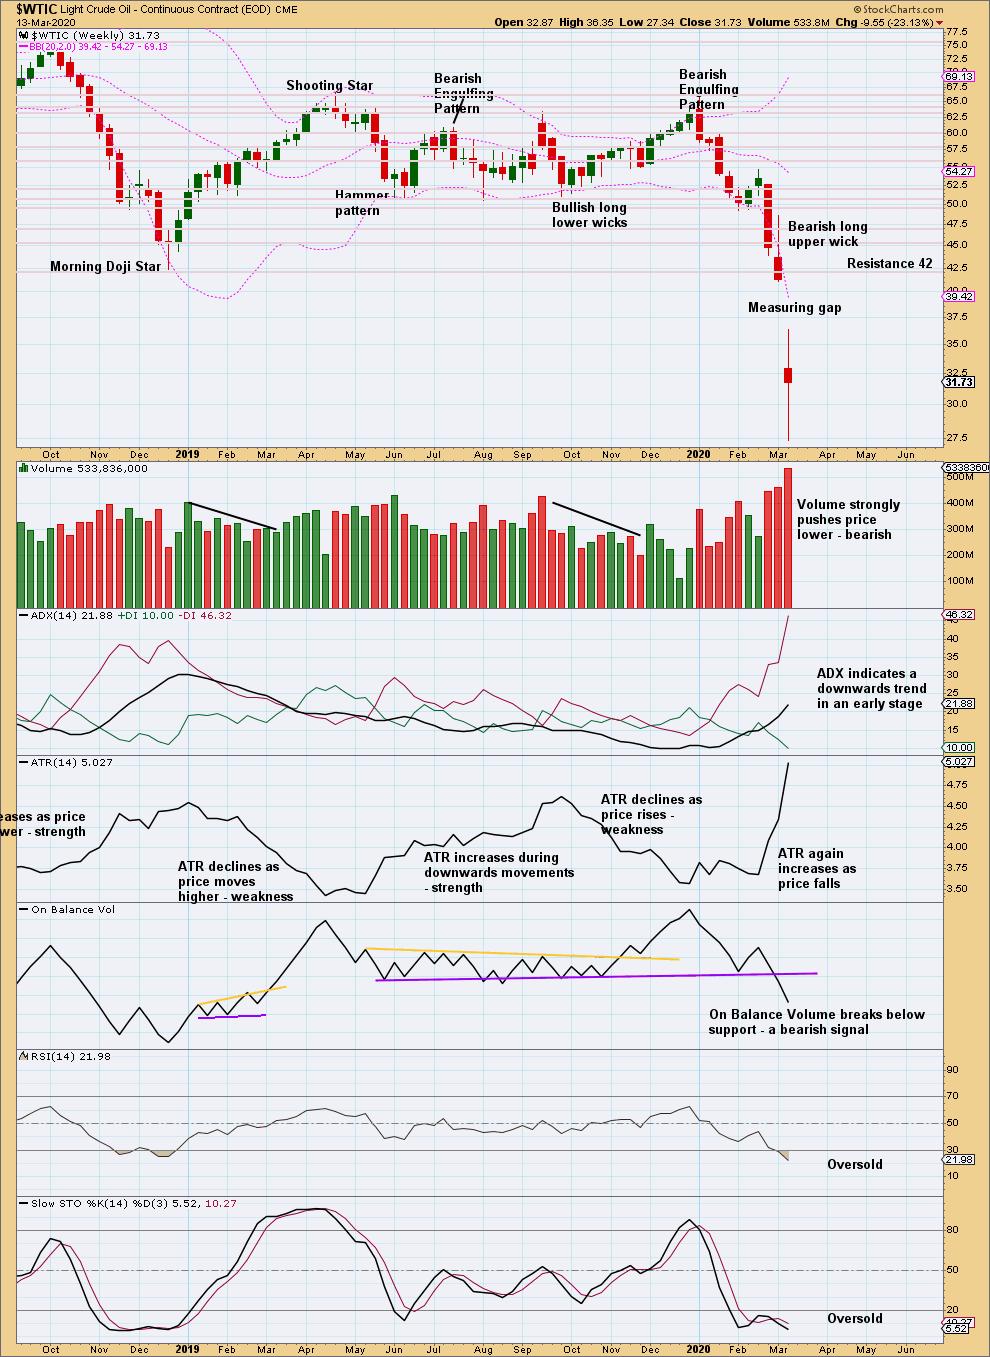
Click chart to enlarge. Chart courtesy of StockCharts.com.
A downwards breakout below prior support about 51 – 50 has been effected. This breakout has support from volume, so some confidence may be had in it.
This week’s measuring gap gives a new target at 22.74.
DAILY CHART
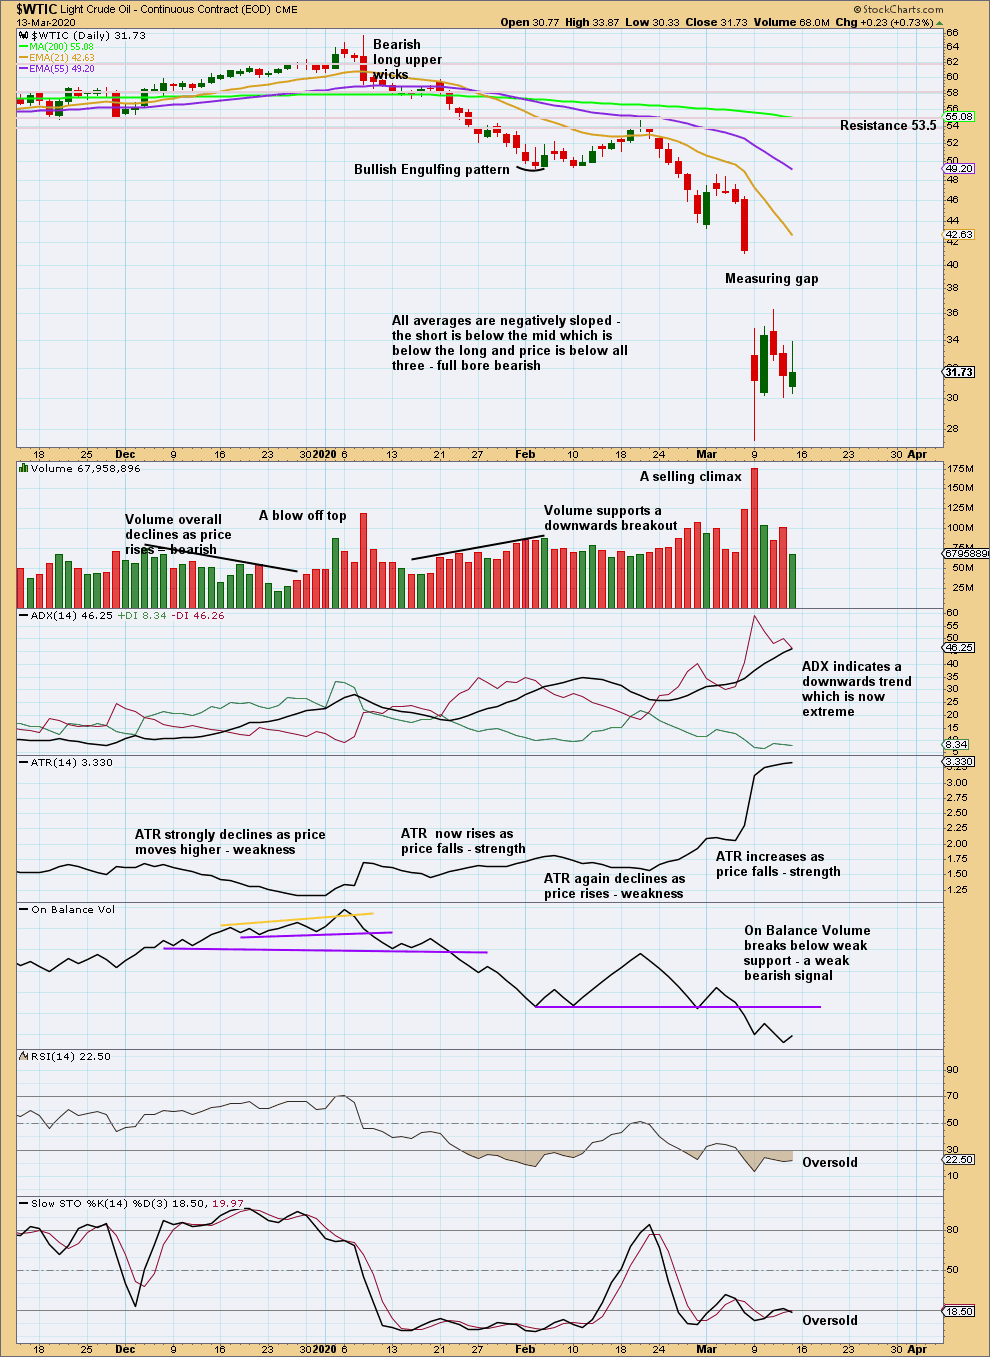
Click chart to enlarge. Chart courtesy of StockCharts.com.
A downwards trend is now in place at both daily and weekly time frames. Both volume and range support this trend.
RSI and Stochastics may remain very extreme for reasonable periods of time when this market trends. ADX may also remain very extreme for reasonable periods of time.
At the daily chart level, the calculation from the measuring gap gives a target at 27.27, which was almost met on the same day of the gap.
—
Careful risk management protects your trading account(s).
Follow my two Golden Rules:
1. Always trade with stops.
2. Risk only 1-5% of equity on any one trade.