
GOLD: Elliott Wave and Technical Analysis | Charts – June 15, 2020
Price remains range bound. All Elliott wave counts remain valid.
Summary: A high may be in for Gold. Downwards movement may begin to a mid-term target at 1,505.
Further confidence in a downwards trend may be had if price makes a new low below 1,548.43.
A new high above 1,764.12 would indicate an upwards breakout. The target would then again be at 1,980.
Grand SuperCycle analysis is here.
Monthly charts were last updated here.
MAIN BEARISH ELLIOTT WAVE COUNT
WEEKLY CHART
Click chart to enlarge.
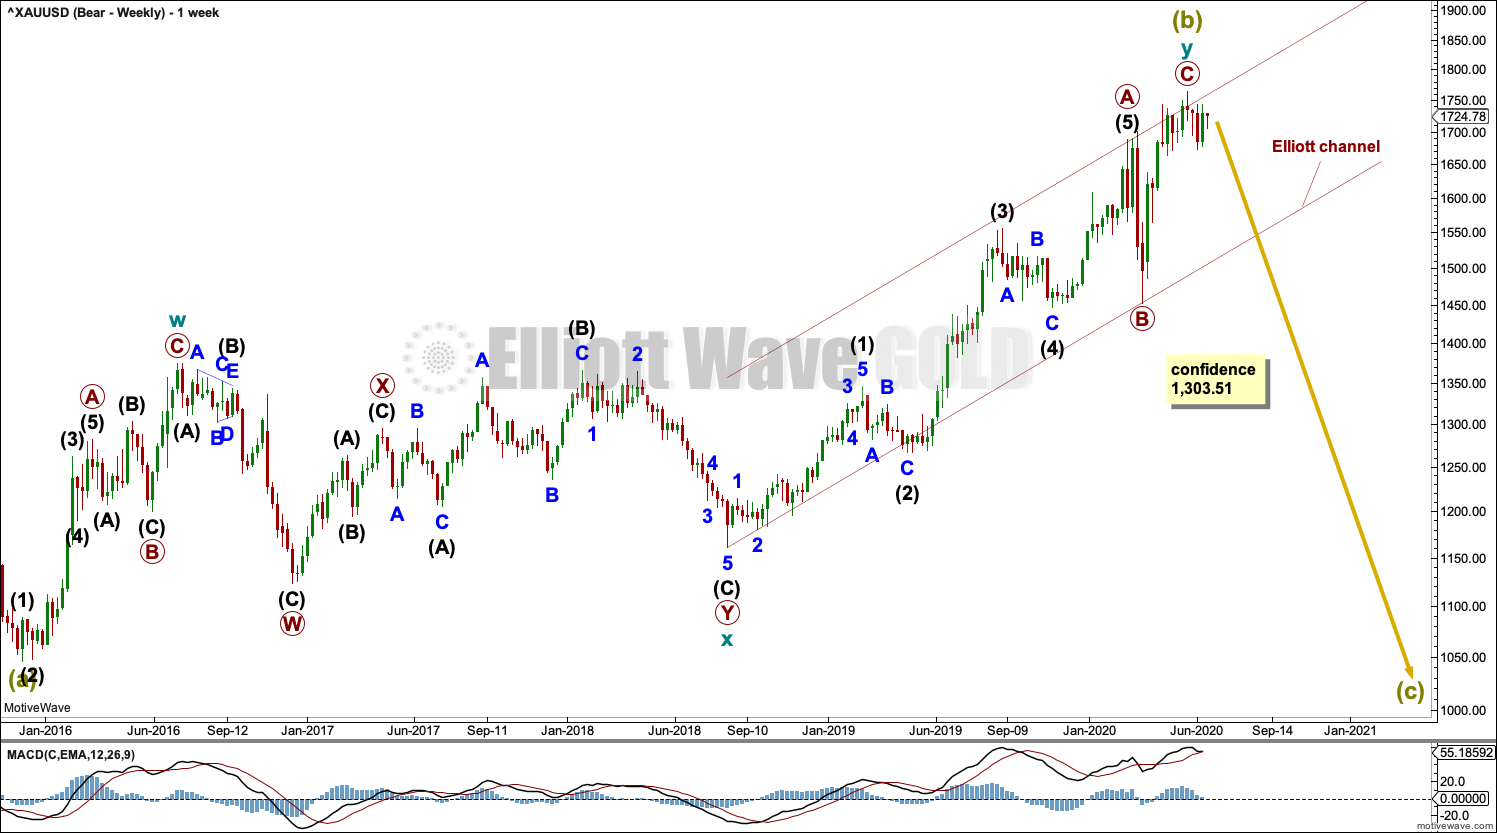
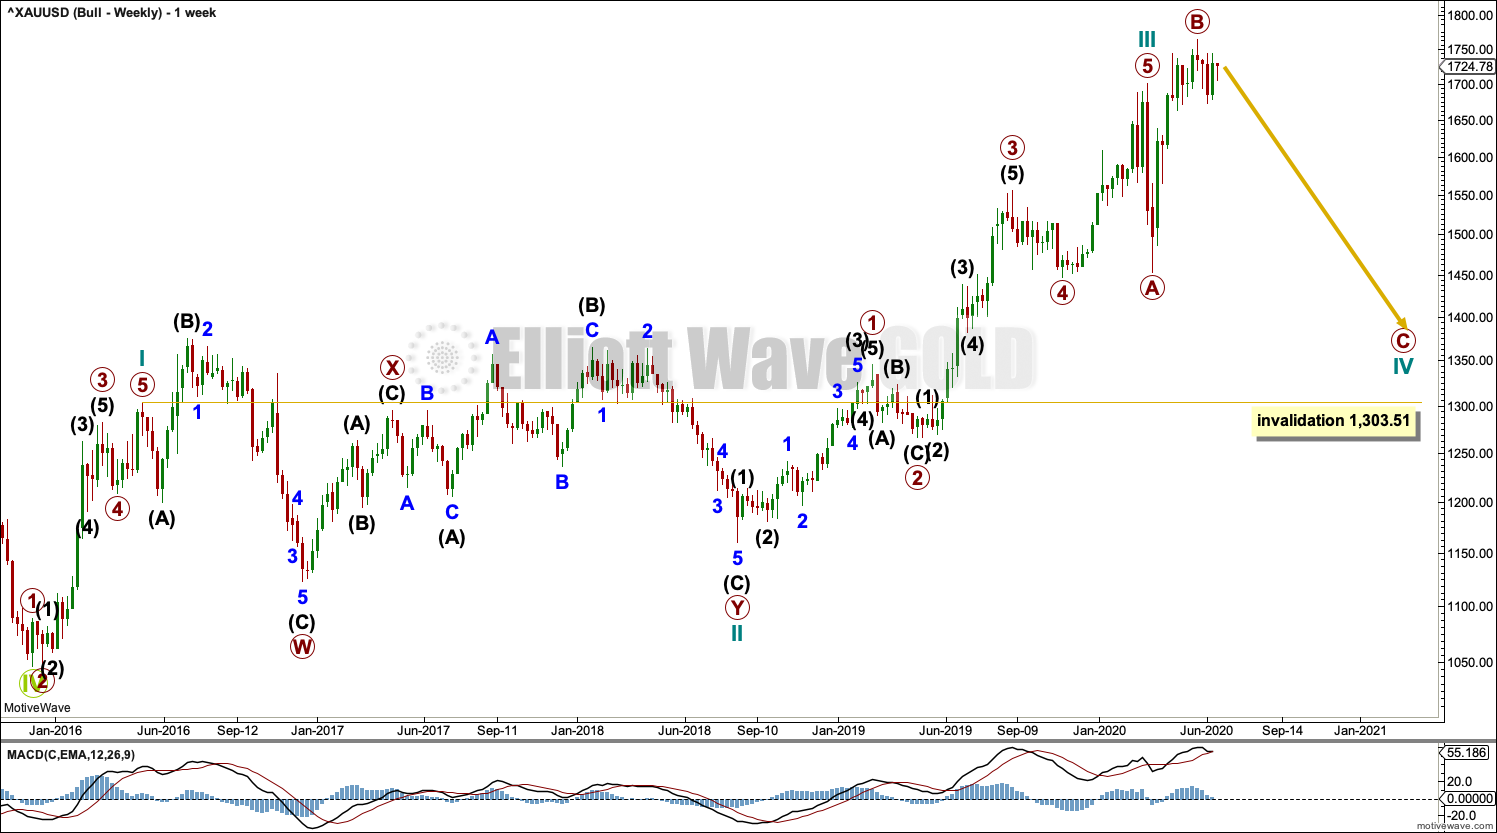
The bigger picture for this main bearish Elliott wave count sees Gold as still within a bear market, in a three steps back pattern that is labelled Grand Super Cycle wave IV on monthly charts.
Super Cycle wave (b) within Grand Super Cycle wave IV may be a complete double zigzag.
The first zigzag in the double is labelled cycle wave w. The double is joined by a three in the opposite direction, a combination labelled cycle wave x. The second zigzag in the double is labelled cycle wave y.
The purpose of the second zigzag in a double is to deepen the correction. Cycle wave y has achieved this purpose.
Super Cycle wave (c) downwards may continue to complete the larger (a)-(b)-(c) correction for Grand Super Cycle wave IV. Super Cycle wave (c) would be very likely to move below the end of Super Cycle wave (a) at 1,046.27 to avoid a truncation. When the bullish alternate wave count is invalidated, then a final target may be calculated for Super Cycle wave (c).
DAILY CHART
Click chart to enlarge.
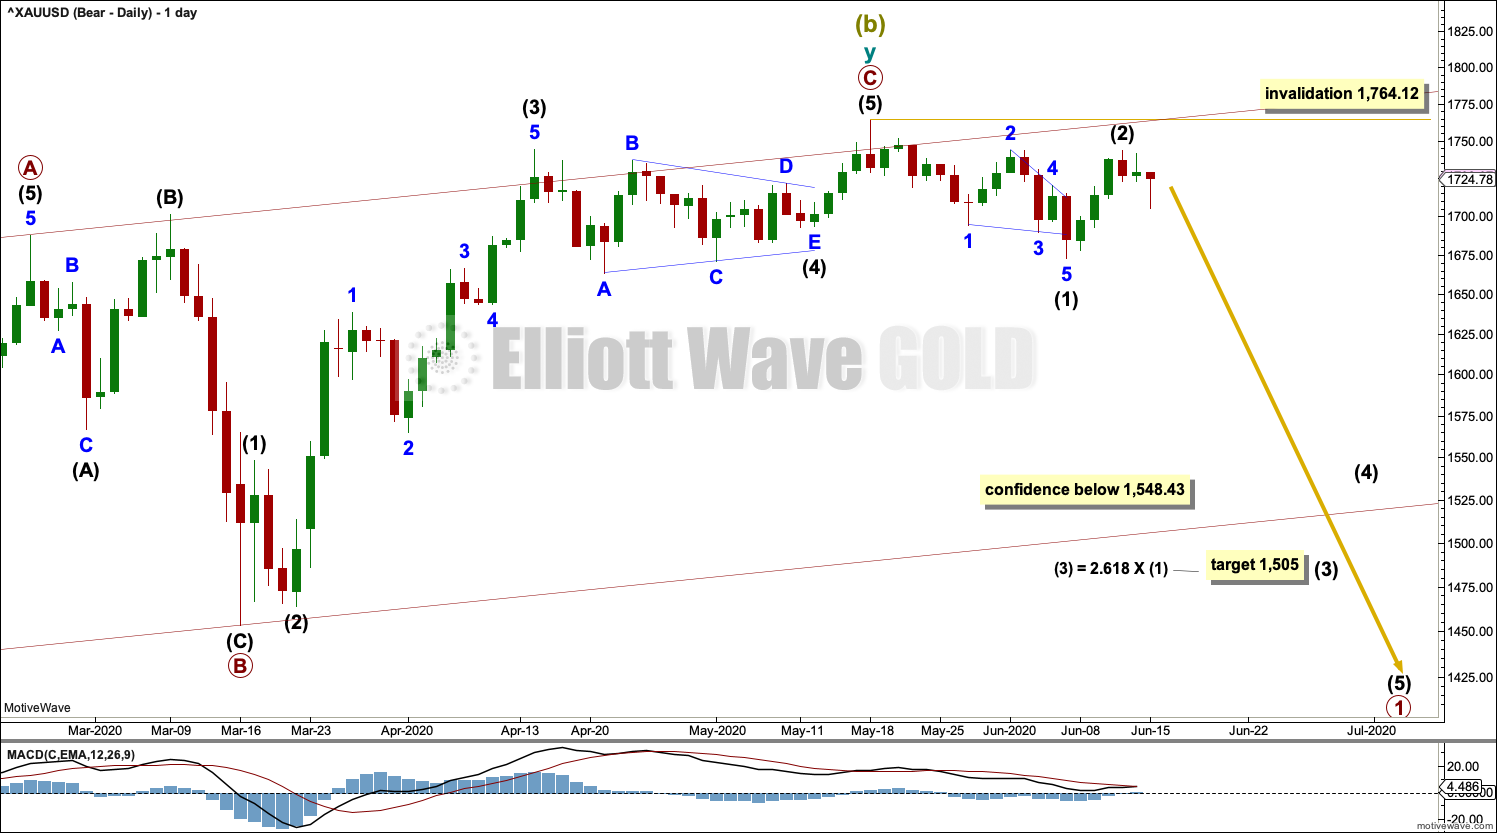
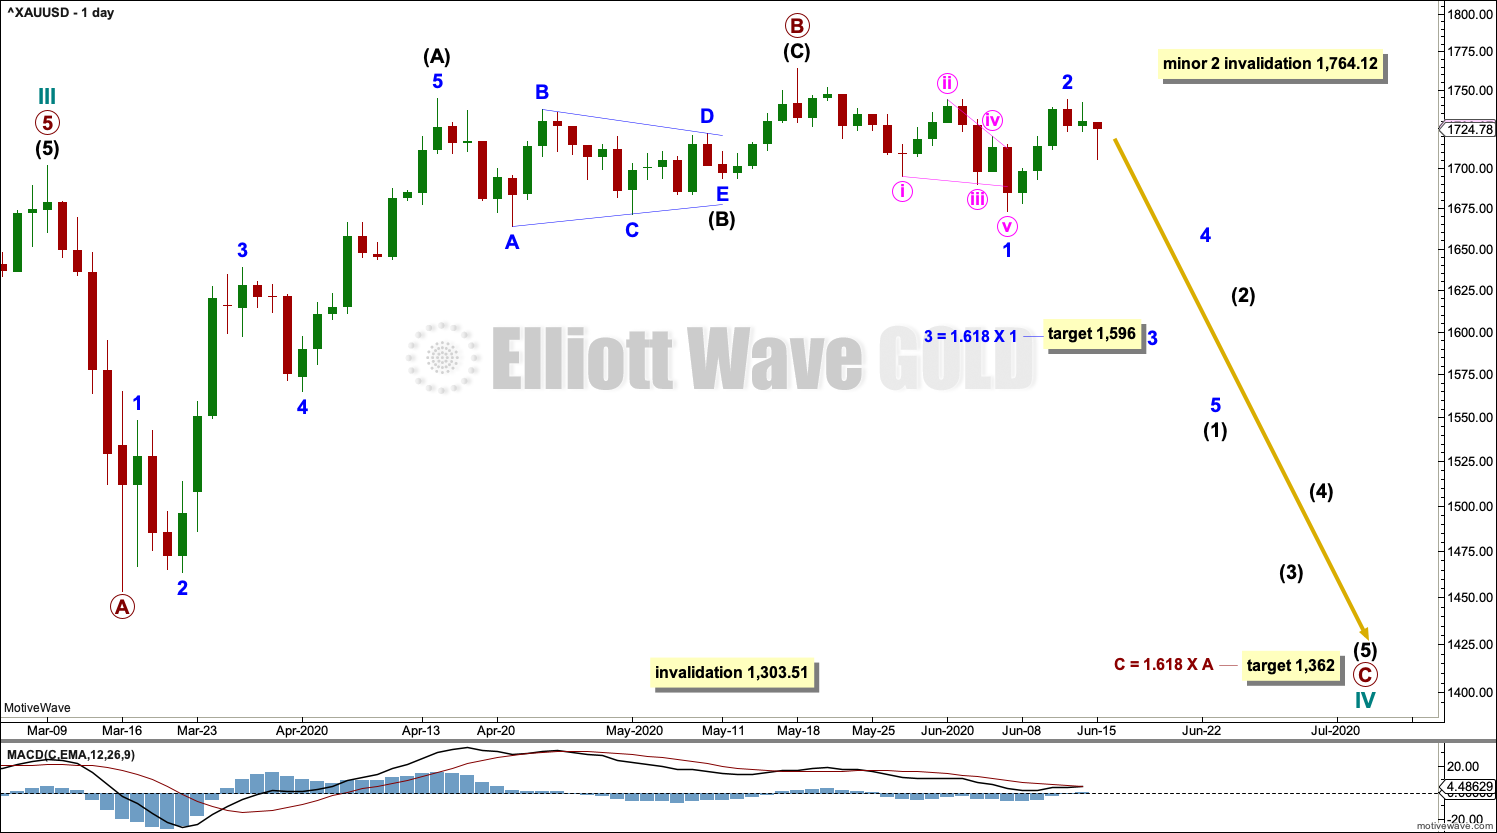
Primary wave C within cycle wave y may be a complete five wave impulse.
A new low below 1,693.39 has added initial confidence to this wave count. A new low below 1,548.43 would invalidate a new more bullish alternate wave count (see below), so it would add further confidence to this main wave count.
When primary wave 1 is complete within the new downwards trend, then primary wave 2 may not move beyond the start of primary wave 1 above 1,764.12.
Intermediate wave (2) may be continuing further as an expanded flat correction. It may not move beyond the start of intermediate wave (1) above 1,764.12.
HOURLY CHART
Click chart to enlarge.
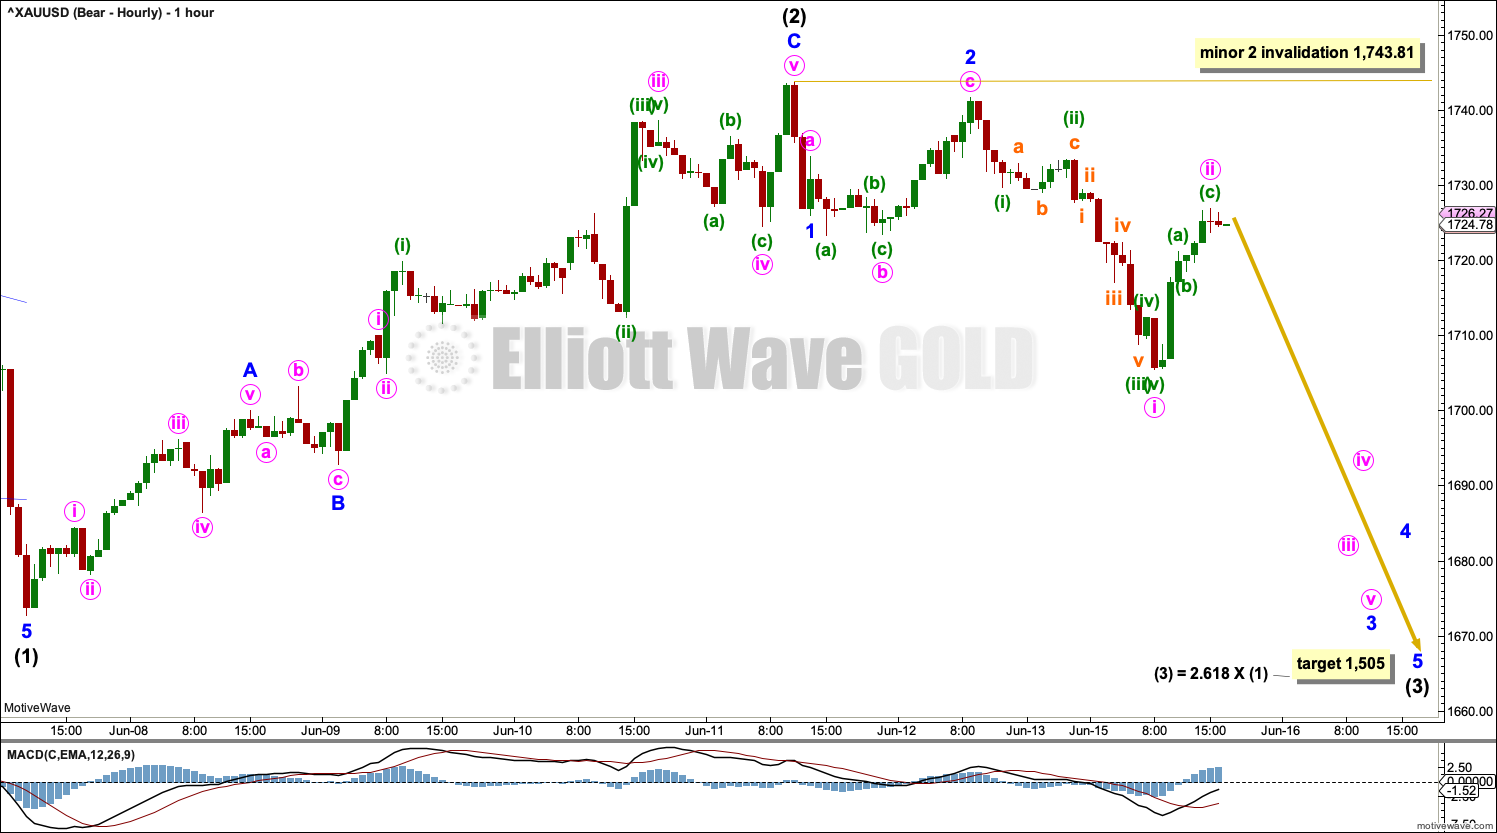
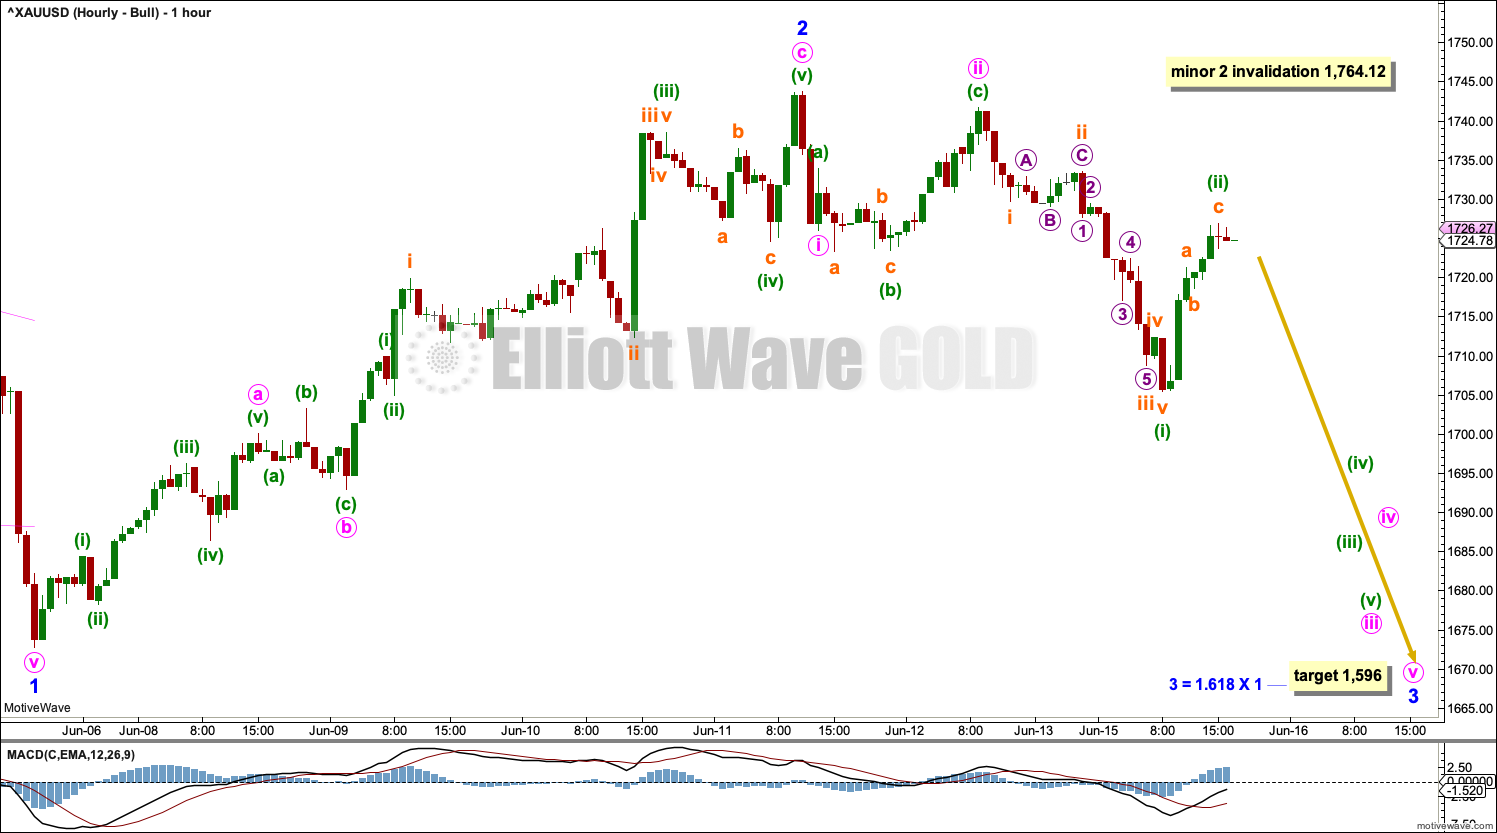
With three weeks of sideways overlapping movement since the high on 18th of May, there are multiple ways to label this sideways movement.
It is possible that intermediate wave (1) ended at the last swing low on 4th June as a leading contracting diagonal. Intermediate wave (2) may also be over at the last high as a quick deep zigzag.
Intermediate wave (3) may have just begun.
Minor wave 2 within intermediate wave (3) may not move beyond the start of minor wave 1 above 1,743.81. If price makes a new high above 1,743.81 in the next day, then use the alternate below.
ALTERNATE HOURLY CHART
Click chart to enlarge.
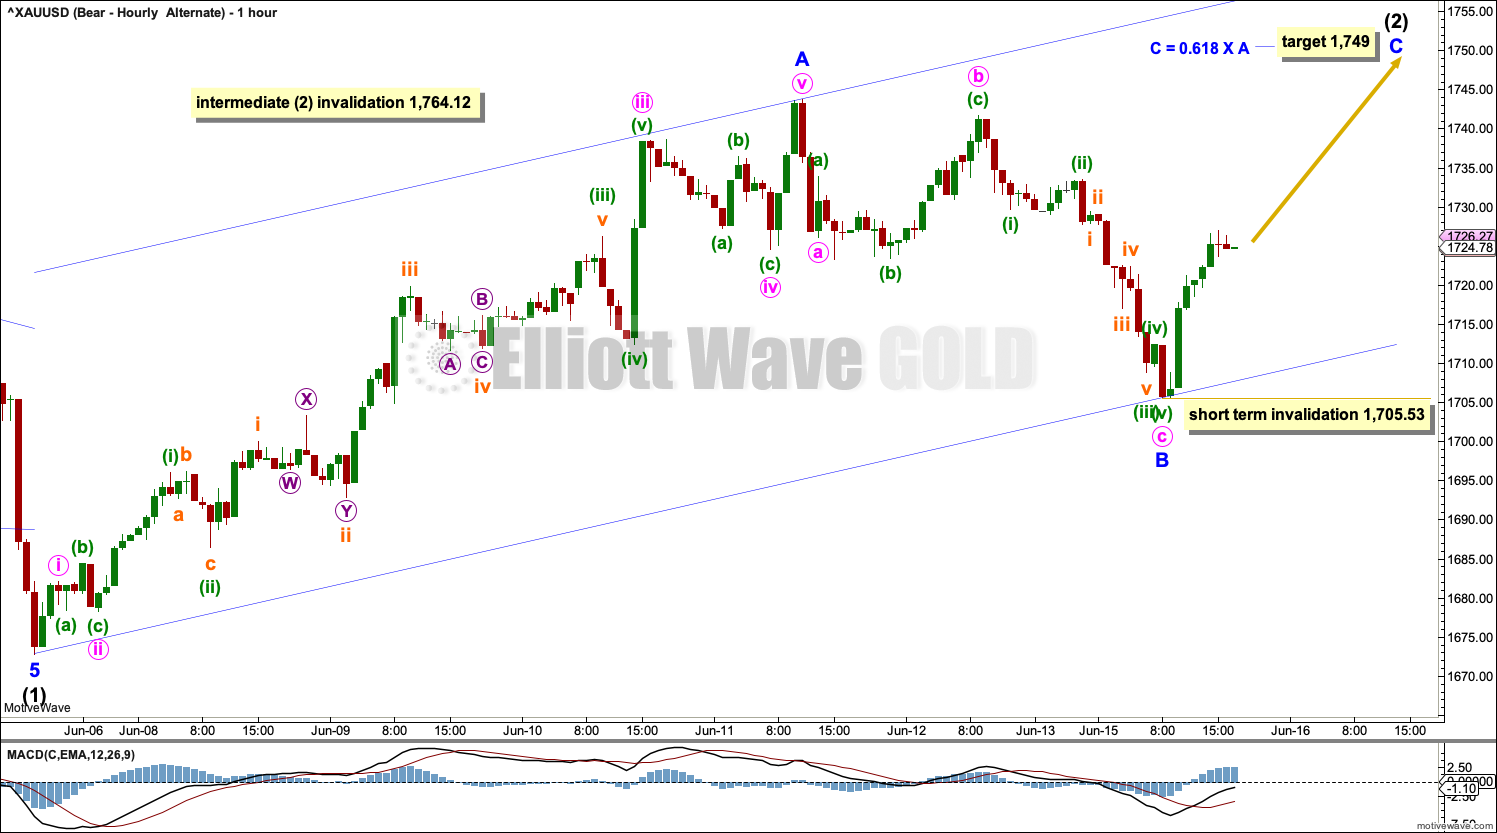
It is possible that intermediate wave (2) is an incomplete zigzag. A target is calculated for minor wave C.
No second wave correction within minor wave C may move beyond the start of its first wave below 1,705.53.
Intermediate wave (2) may not move beyond the start of intermediate wave (1) above 1,764.12.
ALTERNATE DAILY CHART
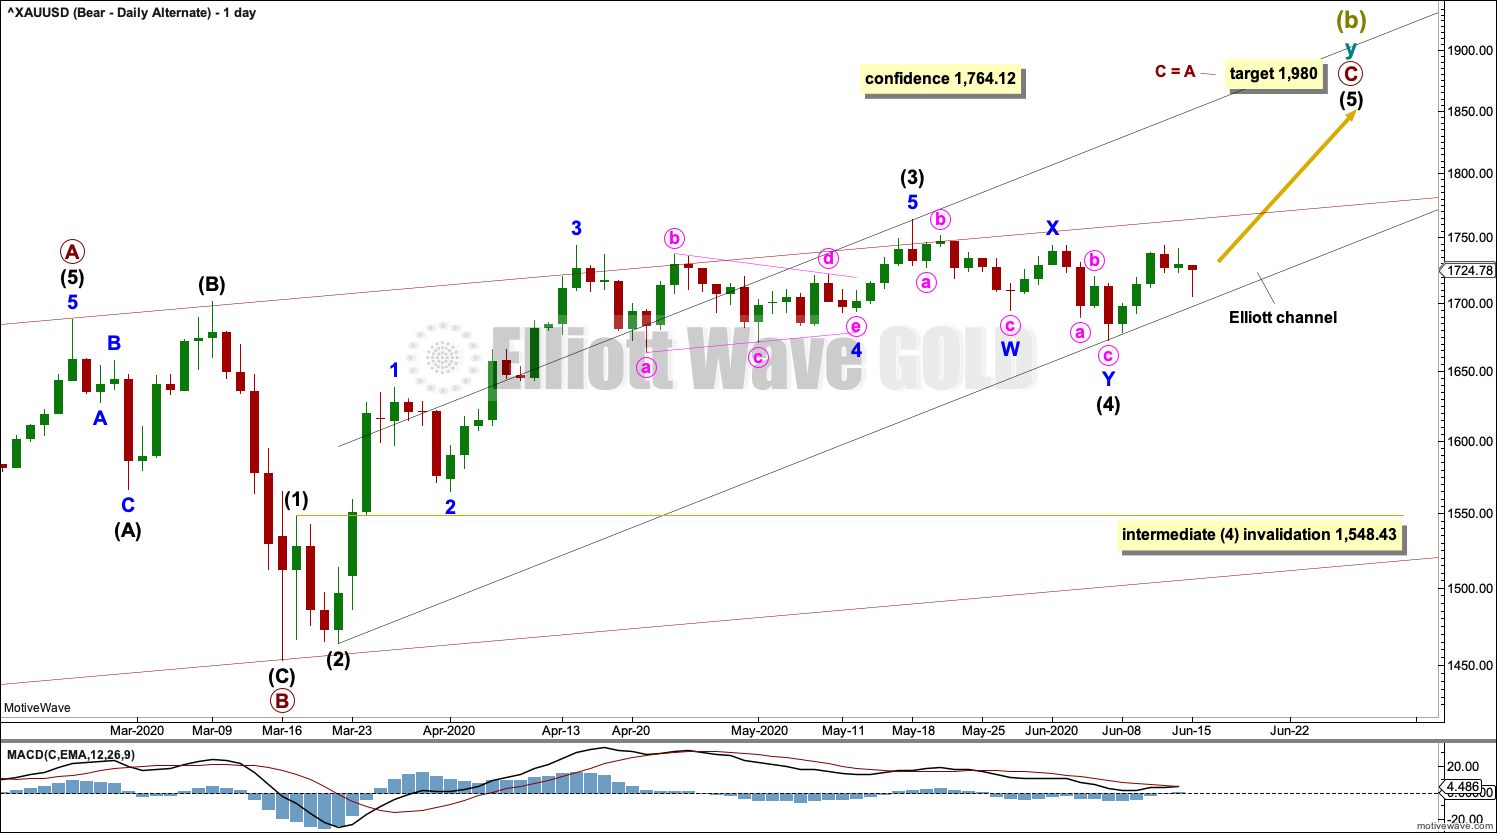
Click chart to enlarge.
This alternate wave count has the lowest probability.
It remains possible that primary wave C may be an incomplete five wave impulse.
Within the impulse: intermediate waves (1) through to (3) may be complete and intermediate wave (4) may have continued lower as a double zigzag. Intermediate wave (4) may not move into intermediate wave (1) price territory below 1,548.43.
An Elliott channel is drawn about primary wave C. Primary wave C does not fit well within this channel, which reduces the probability of this wave count.
ALTERNATE BULLISH ELLIOTT WAVE COUNT
WEEKLY CHART
Click chart to enlarge.
This wave count sees the the bear market complete at the last major low for Gold on 3 December 2015.
If Gold is in a new bull market, then it should begin with a five wave structure upwards on the weekly chart.
Cycle wave I fits as a five wave impulse with reasonably proportionate corrections for primary waves 2 and 4.
Cycle wave II fits as a double flat. However, within the first flat correction labelled primary wave W, this wave count needs to ignore what looks like an obvious triangle from July to September 2016 (this can be seen labelled as a triangle on the bear wave count above). This movement must be labelled as a series of overlapping first and second waves. Ignoring this triangle reduces the probability of this wave count in Elliott wave terms.
Within the first flat correction labelled primary wave W of the double flat of cycle wave II, intermediate wave (B) is 1.69 the length of intermediate wave (A). This is longer than the common range of up to 1.38, but within an allowable guideline of up to 2. The length of intermediate wave (B) reduces the probability of this wave count.
Cycle wave III may be complete. Cycle wave IV may not move into cycle wave I price territory below 1,303.51.
DAILY CHART
Click chart to enlarge.
Cycle wave IV may be an incomplete expanded flat correction. Primary wave A within the flat correction may have subdivided as a zigzag. Primary wave B may now be a complete zigzag. Primary wave B would be a 1.25 length of primary wave A. This is within the normal range for primary wave B within a flat from 1 to 1.38 times the length of primary wave A.
A target is calculated for primary wave C to end based upon the most common Fibonacci ratio to primary wave A within an expanded flat. Primary wave C must subdivide as a five wave motive structure.
It is still also possible that primary wave B could continue higher as a double zigzag. The common range of primary wave B would extend up to 1.38 times the length of primary wave A at 1,795.98. A maximum allowable guideline for primary wave B would be up to 2 times the length of primary wave A at 1,949.96. There is no Elliott wave rule stating a limit for B waves within expanded flat corrections, so there is no rule which may be used to determine an upper invalidation point for this wave count.
HOURLY CHART
Click chart to enlarge.
Minor wave 1 may have completed as a leading contracting diagonal. Minor wave 2 may be complete as a deep zigzag. Minor wave 3 downwards may have begun.
The alternate hourly chart for the bearish wave count works in the same way as for this bullish wave count. It is possible that minor wave 2 may continue higher as a zigzag.
TECHNICAL ANALYSIS
WEEKLY CHART
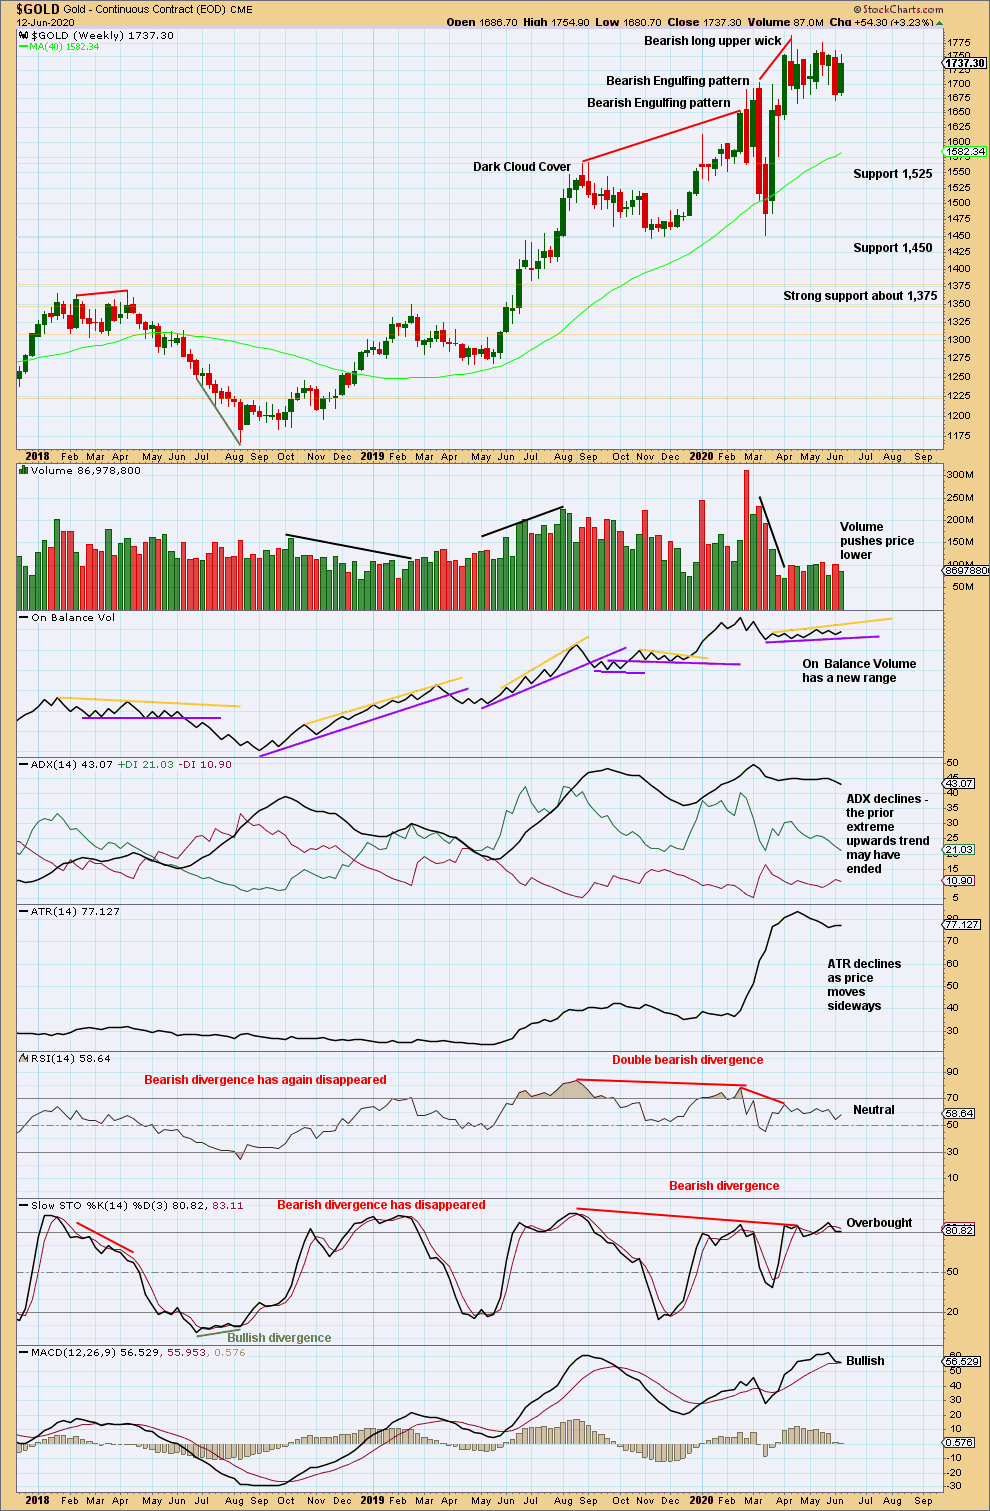
Click chart to enlarge. Chart courtesy of StockCharts.com.
Price remains within a consolidation with support about 1,665 to 1,680. An inside sees price remain within this range. The short-term volume profile is still bearish, suggesting a downwards breakout.
DAILY CHART
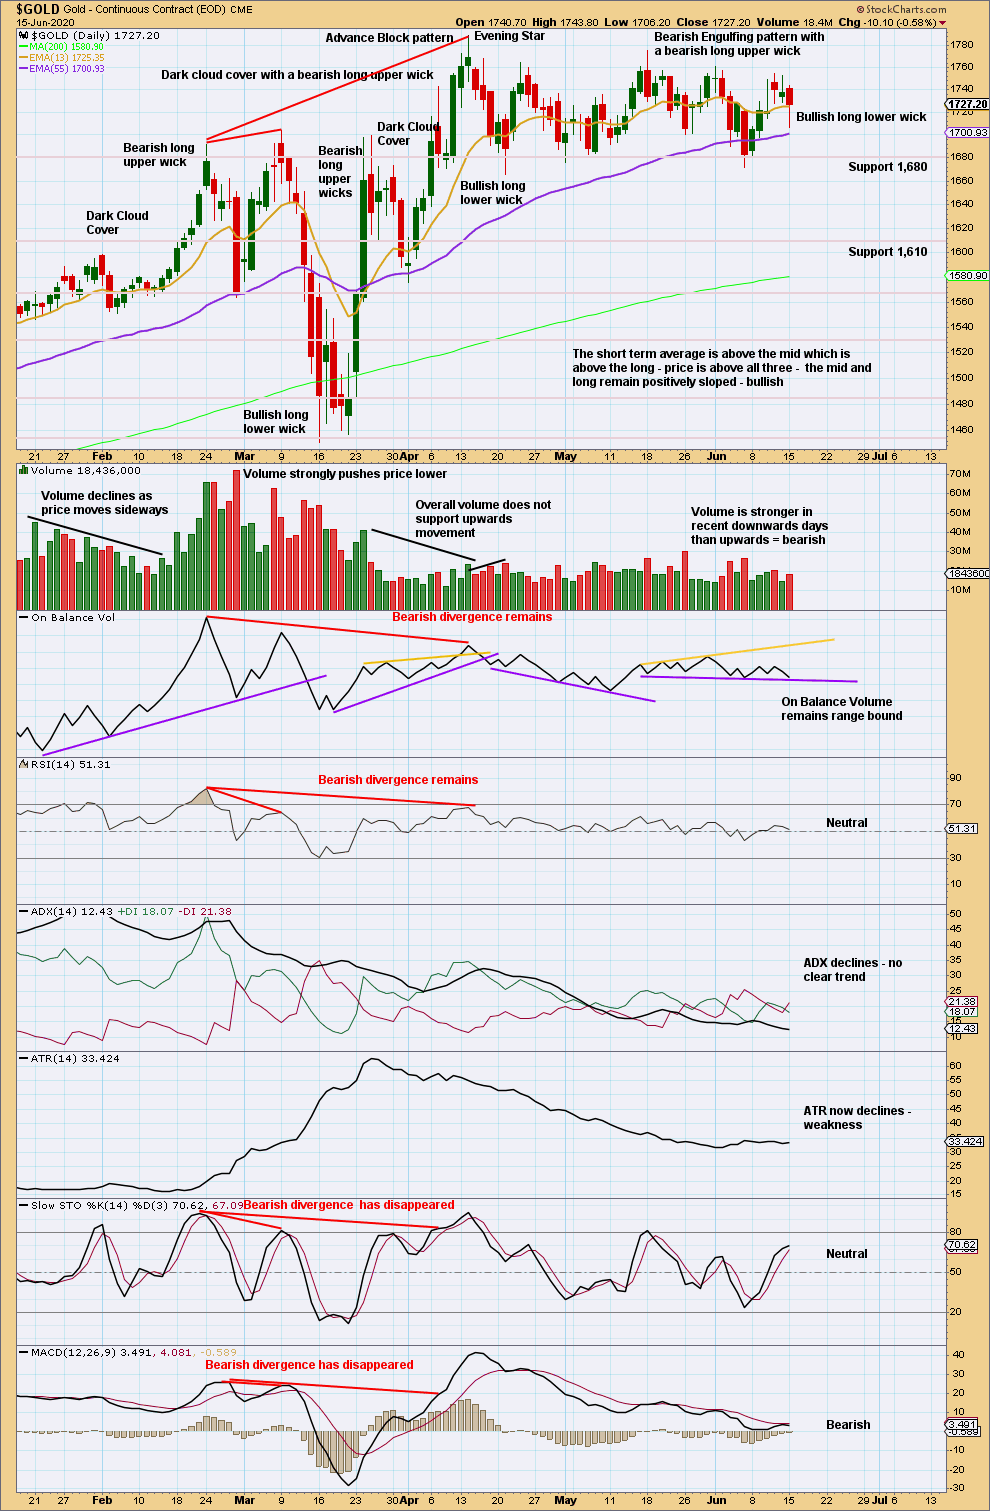
Click chart to enlarge. Chart courtesy of StockCharts.com.
With a bearish reversal pattern having support from volume on the 18th of May, the risk that price has changed trend here is high.
Price remains range bound with support about 1,665 to 1,675 and resistance about 1,765 to 1,790. The short-term volume profile remains bearish, suggesting a downwards breakout may be more likely.
Today’s bullish long lower wick suggests a swing up to resistance may continue.
GDX WEEKLY CHART
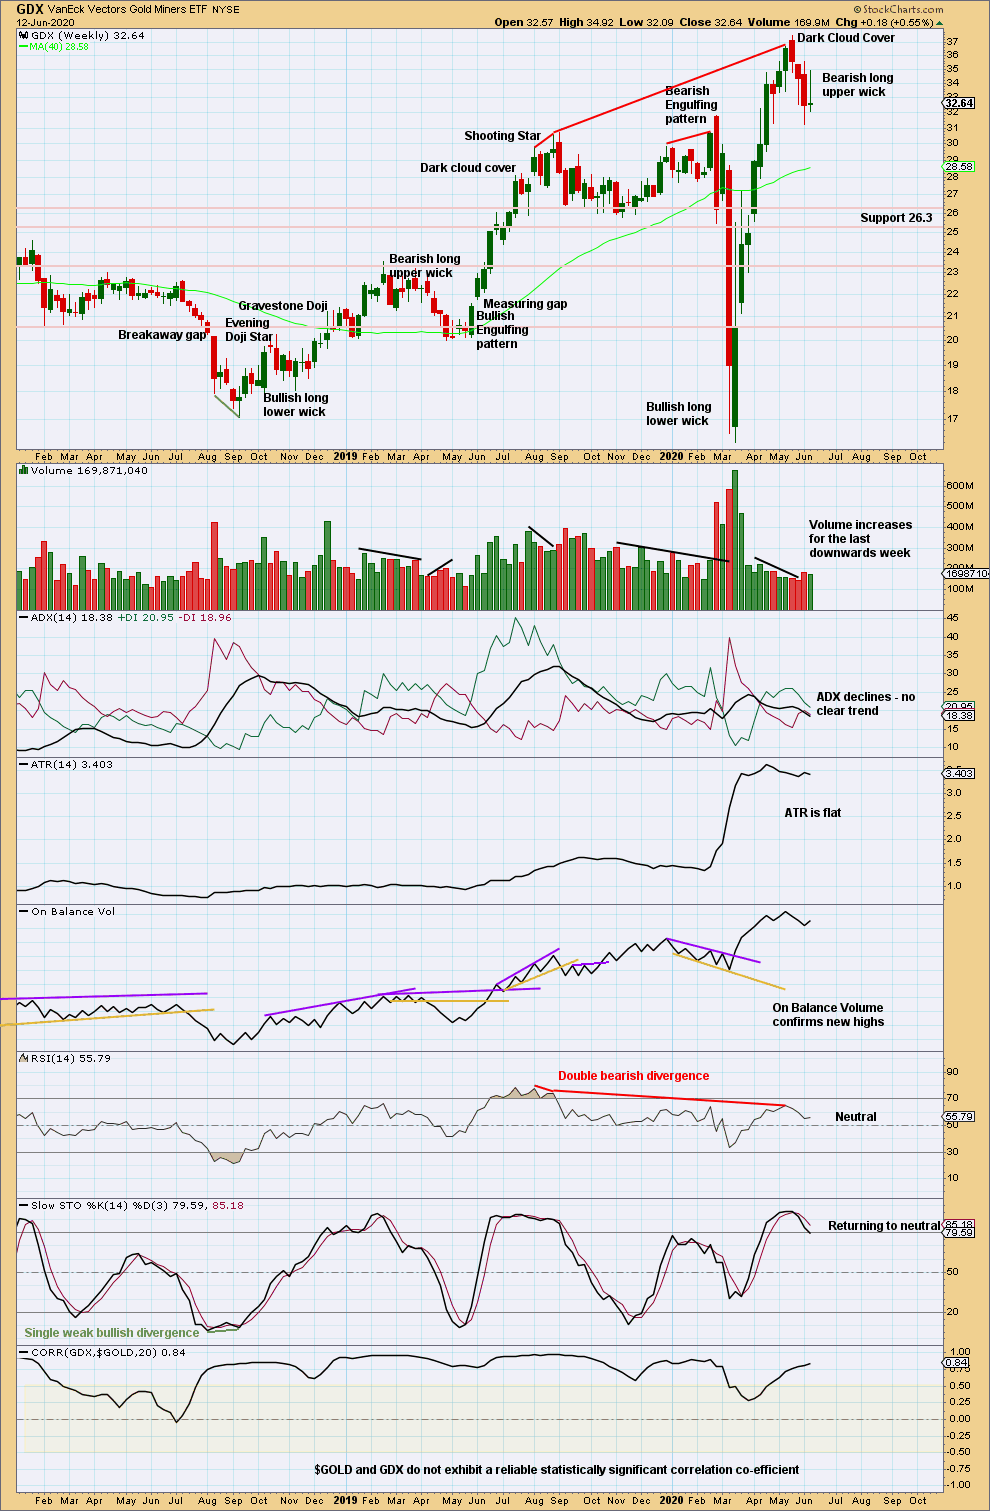
Click chart to enlarge. Chart courtesy of StockCharts.com.
A bearish upper candlestick wick suggest more downwards movement ahead.
GDX DAILY CHART
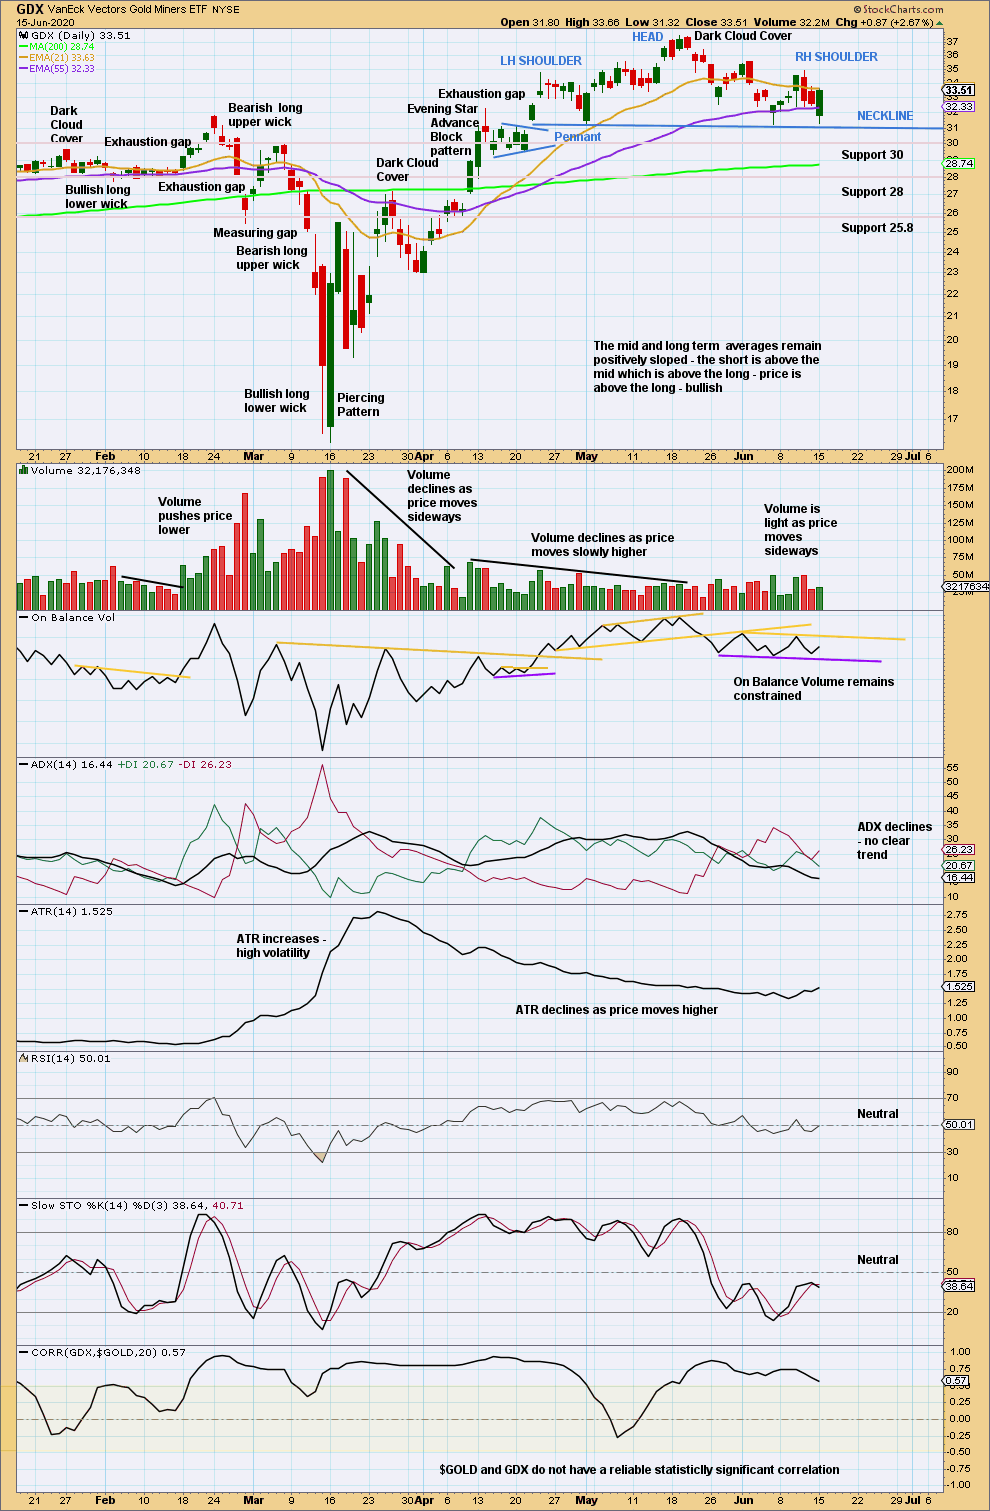
Click chart to enlarge. Chart courtesy of StockCharts.com.
A head and shoulders pattern with double shoulders may be forming. A break below the neckline of a head and shoulders pattern is required for confidence in the pattern. A target would be about 24.90.
Today a bounce up off the neckline adds to the technical significance of that line.
Published @ 08:15 p.m. EST.
—
Careful risk management protects your trading account(s).
Follow my two Golden Rules:
1. Always trade with stops.
2. Risk only 1-5% of equity on any one trade.
—
New updates to this analysis are in bold.