
GOLD: Elliott Wave and Technical Analysis | Charts – June 23, 2020
Barchart data shows a new high today, invalidating the main Elliott wave count and leaving an alternate now as the new main wave count. But Stockcharts data does not show a new high and this upwards session lacks support from volume.
Summary: A new high above 1,764.12 on Barchart data indicates an upwards breakout. A short-term target is now at 1,777. A mid-term target is at 1,820. The final target is at 1,980.
However, Stockcharts data has not confirmed an upwards breakout and this last upwards session lacks support from volume. Stockcharts data shows price at resistance and On Balance Volume at resistance. The breakout should be treated with suspicion while it is not confirmed. If tomorrow sees price continue higher with support from volume, then some confidence may be had in the Elliott wave count. The targets may be optimistic as this trend is very stretched and overbought.
Grand SuperCycle analysis is here.
Monthly charts were last updated here.
MAIN BEARISH ELLIOTT WAVE COUNT
WEEKLY CHART
Click chart to enlarge.
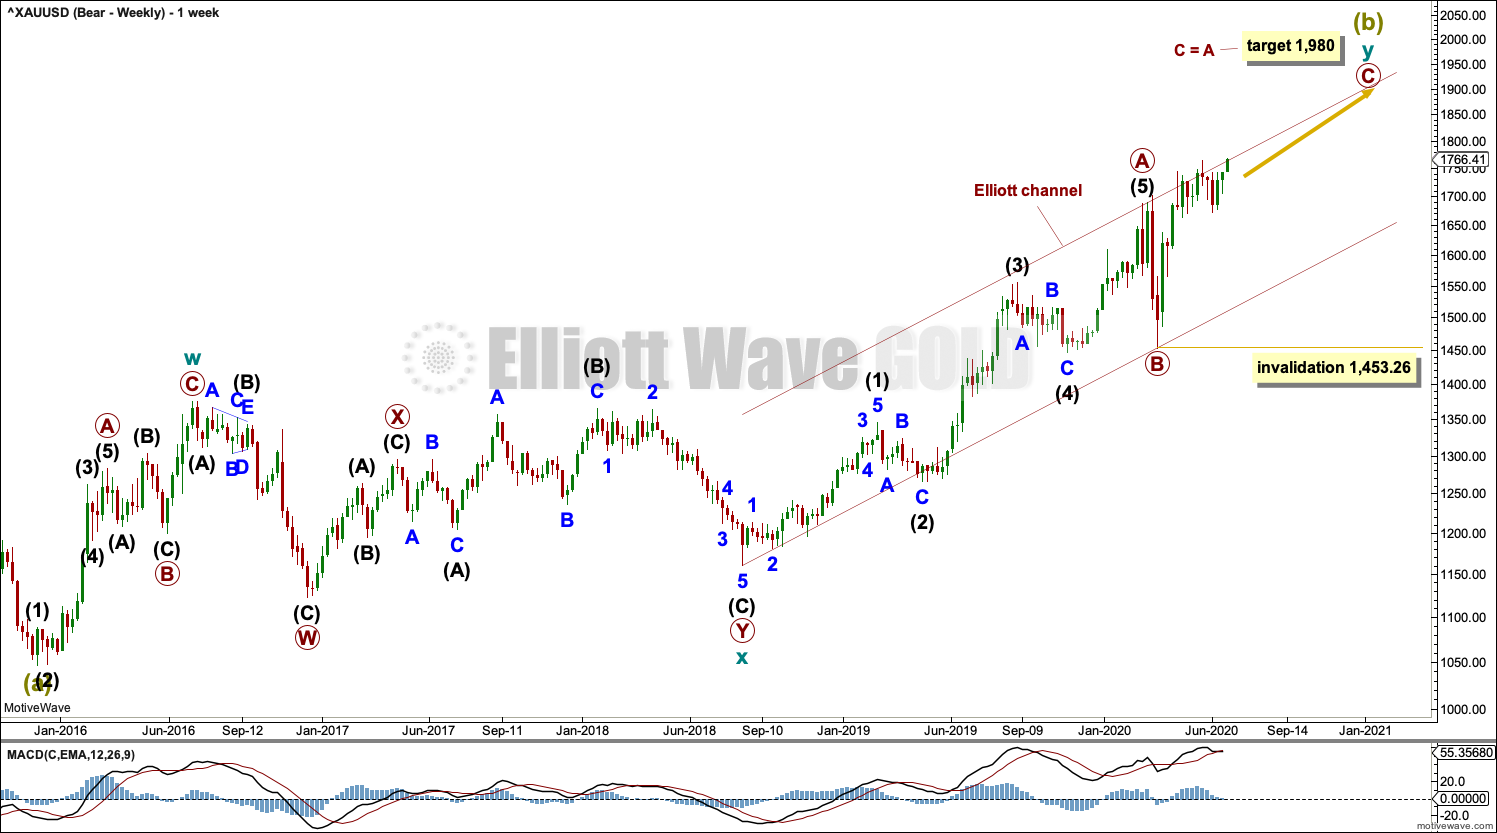
The bigger picture for this main bearish Elliott wave count sees Gold as still within a bear market, in a three steps back pattern that is labelled Grand Super Cycle wave IV on monthly charts.
Super Cycle wave (b) within Grand Super Cycle wave IV may be an incomplete double zigzag.
The first zigzag in the double is labelled cycle wave w. The double is joined by a three in the opposite direction, a combination labelled cycle wave x. The second zigzag in the double is labelled cycle wave y.
The purpose of the second zigzag in a double is to deepen the correction. Cycle wave y has achieved this purpose.
DAILY CHART
Click chart to enlarge.
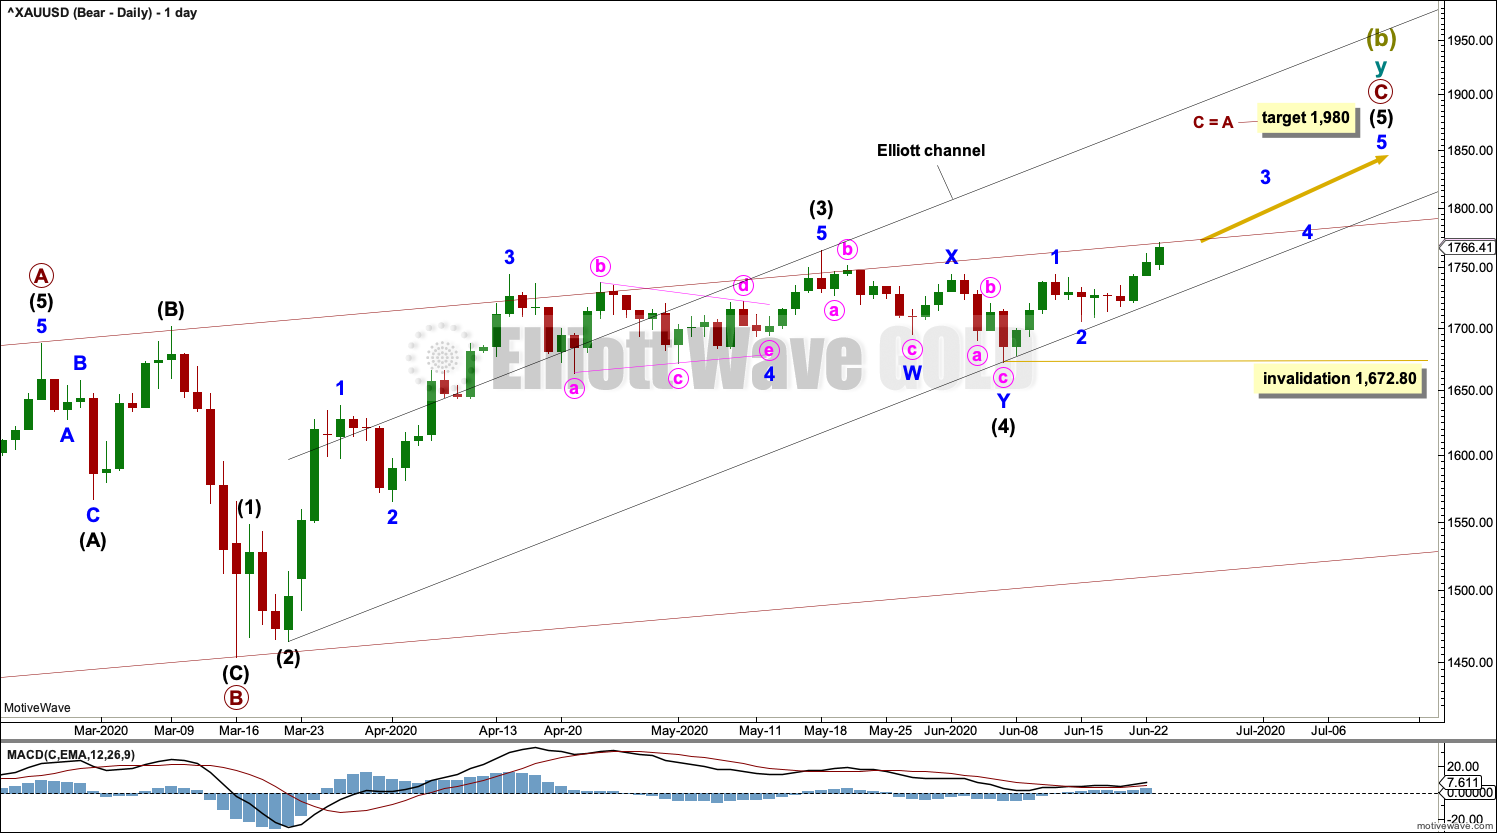
Primary wave C may be an incomplete five wave impulse.
Within the impulse: intermediate waves (1) through to (3) may be complete and intermediate wave (4) may have continued lower as a double zigzag. Intermediate wave (4) may not move into intermediate wave (1) price territory below 1,548.43.
An Elliott channel is drawn about primary wave C. Primary wave C does not fit well within this channel.
Draw a best fit channel about the start of intermediate wave (5) as shown. Copy the channel over to the hourly chart.
HOURLY CHART
Click chart to enlarge.
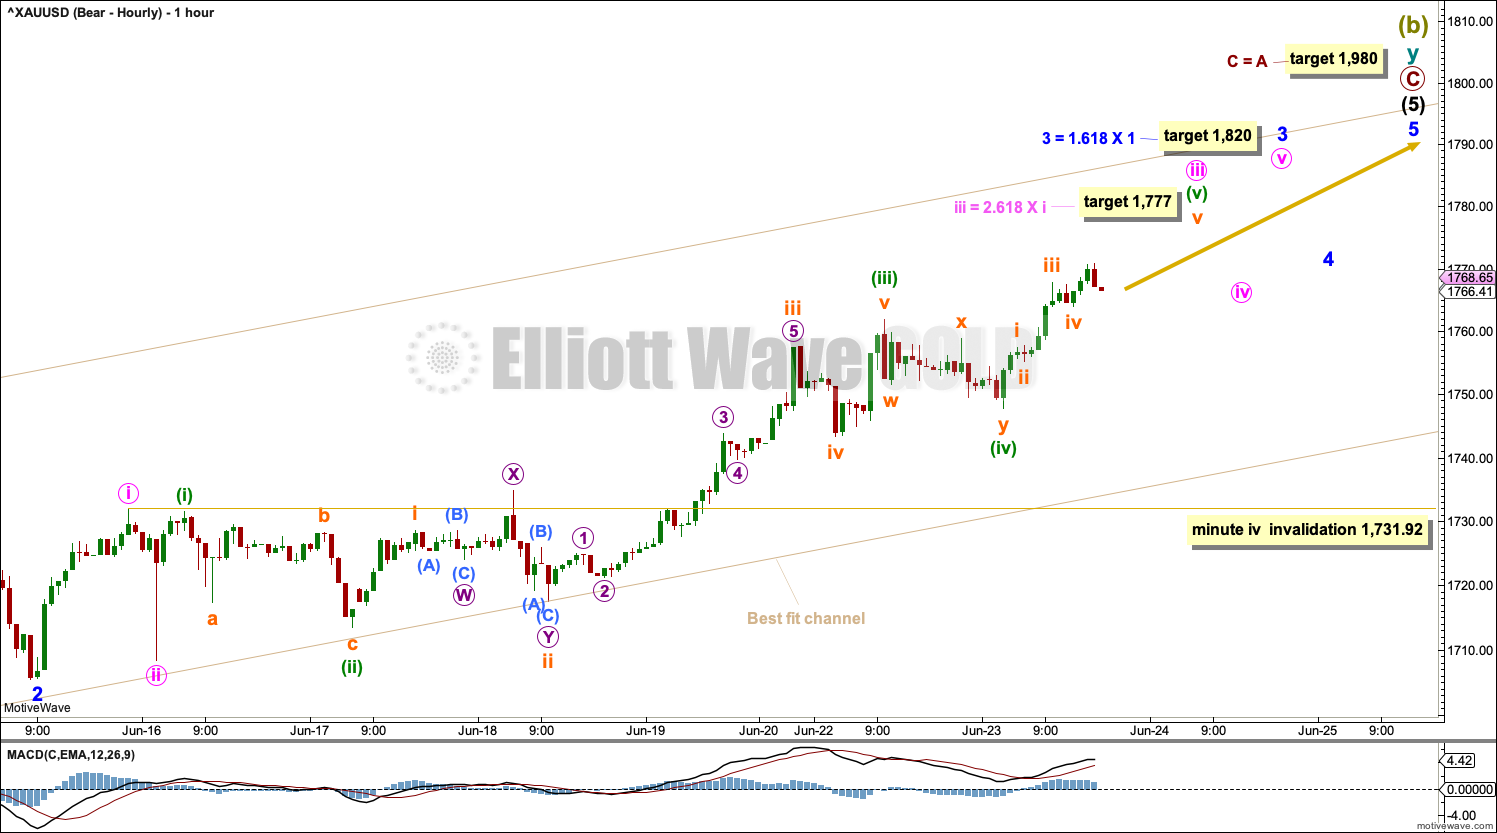
The hourly chart shows all of minor wave 3 so far. Minor wave 3 may only subdivide as an impulse.
Gold typically exhibits swift strong fifth waves to end third waves one degree higher. Look out for the possibility that one or both of minuette wave (v) to end minute wave iii and / or minute wave v to end minor wave 3 may exhibit blow off tops.
Minute wave iv within minor wave 3 may not move into minute wave i price territory below 1,731.92.
ALTERNATE BULLISH ELLIOTT WAVE COUNT
WEEKLY CHART
Click chart to enlarge.
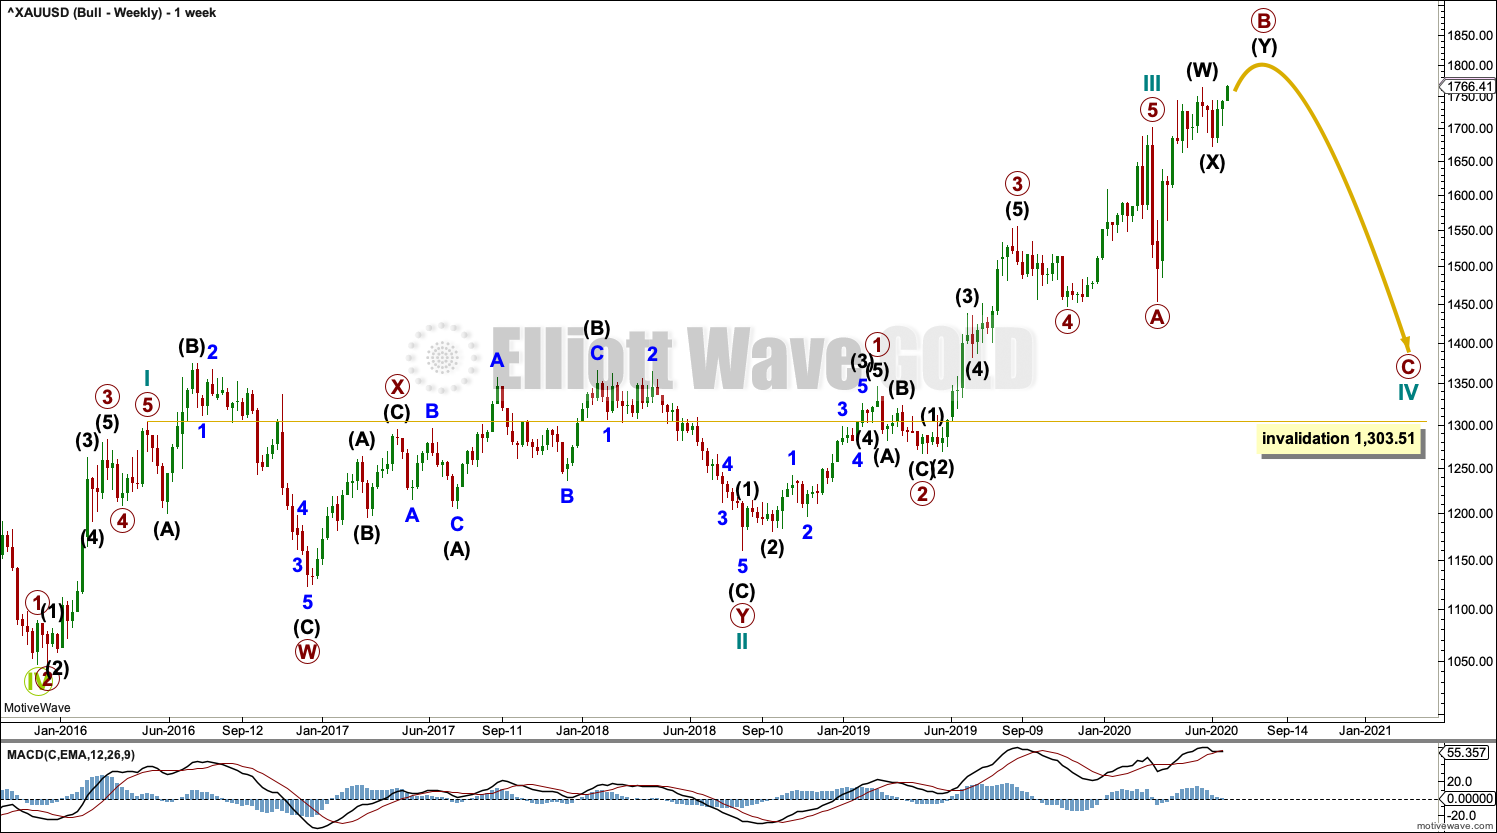
This wave count sees the the bear market complete at the last major low for Gold on 3 December 2015.
If Gold is in a new bull market, then it should begin with a five wave structure upwards on the weekly chart.
Cycle wave I fits as a five wave impulse with reasonably proportionate corrections for primary waves 2 and 4.
Cycle wave II fits as a double flat. However, within the first flat correction labelled primary wave W, this wave count needs to ignore what looks like an obvious triangle from July to September 2016 (this can be seen labelled as a triangle on the bear wave count above). This movement must be labelled as a series of overlapping first and second waves. Ignoring this triangle reduces the probability of this wave count in Elliott wave terms.
Within the first flat correction labelled primary wave W of the double flat of cycle wave II, intermediate wave (B) is 1.69 the length of intermediate wave (A). This is longer than the common range of up to 1.38, but within an allowable guideline of up to 2. The length of intermediate wave (B) reduces the probability of this wave count.
Cycle wave III may be complete. Cycle wave IV may not move into cycle wave I price territory below 1,303.51.
DAILY CHART
Click chart to enlarge.
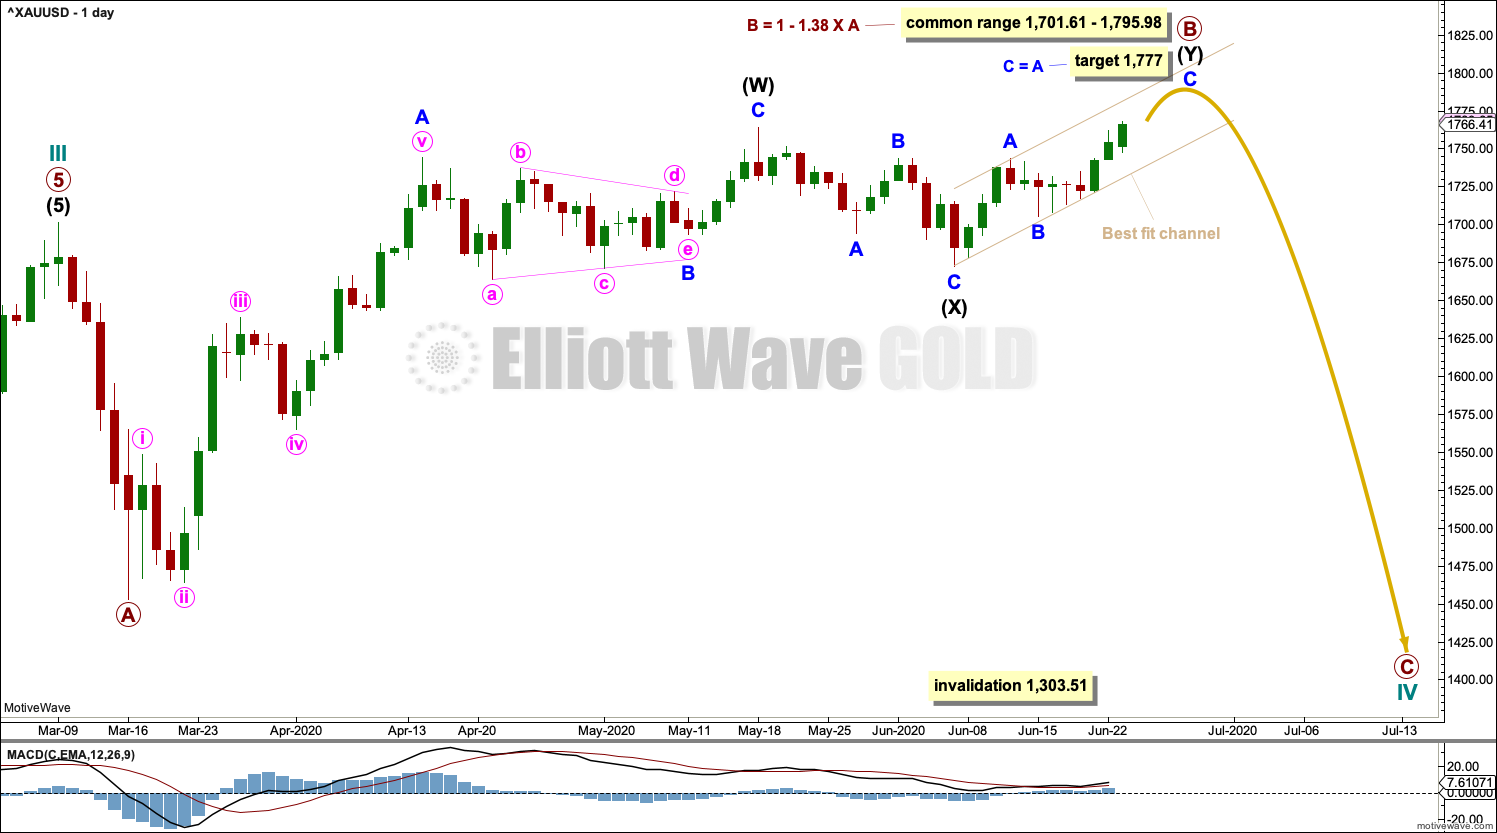
Cycle wave IV may be an incomplete expanded flat correction. Primary wave A within the flat correction may have subdivided as a zigzag. Primary wave B may be continuing higher as a double zigzag.
The common range of primary wave B would extend up to 1.38 times the length of primary wave A at 1,795.98. A maximum allowable guideline for primary wave B would be up to 2 times the length of primary wave A at 1,949.96. There is no Elliott wave rule stating a limit for B waves within expanded flat corrections, so there is no rule which may be used to determine an upper invalidation point for this wave count.
Draw a best fit channel about intermediate wave (Y). Copy the channel over to the hourly chart.
HOURLY CHART
Click chart to enlarge.
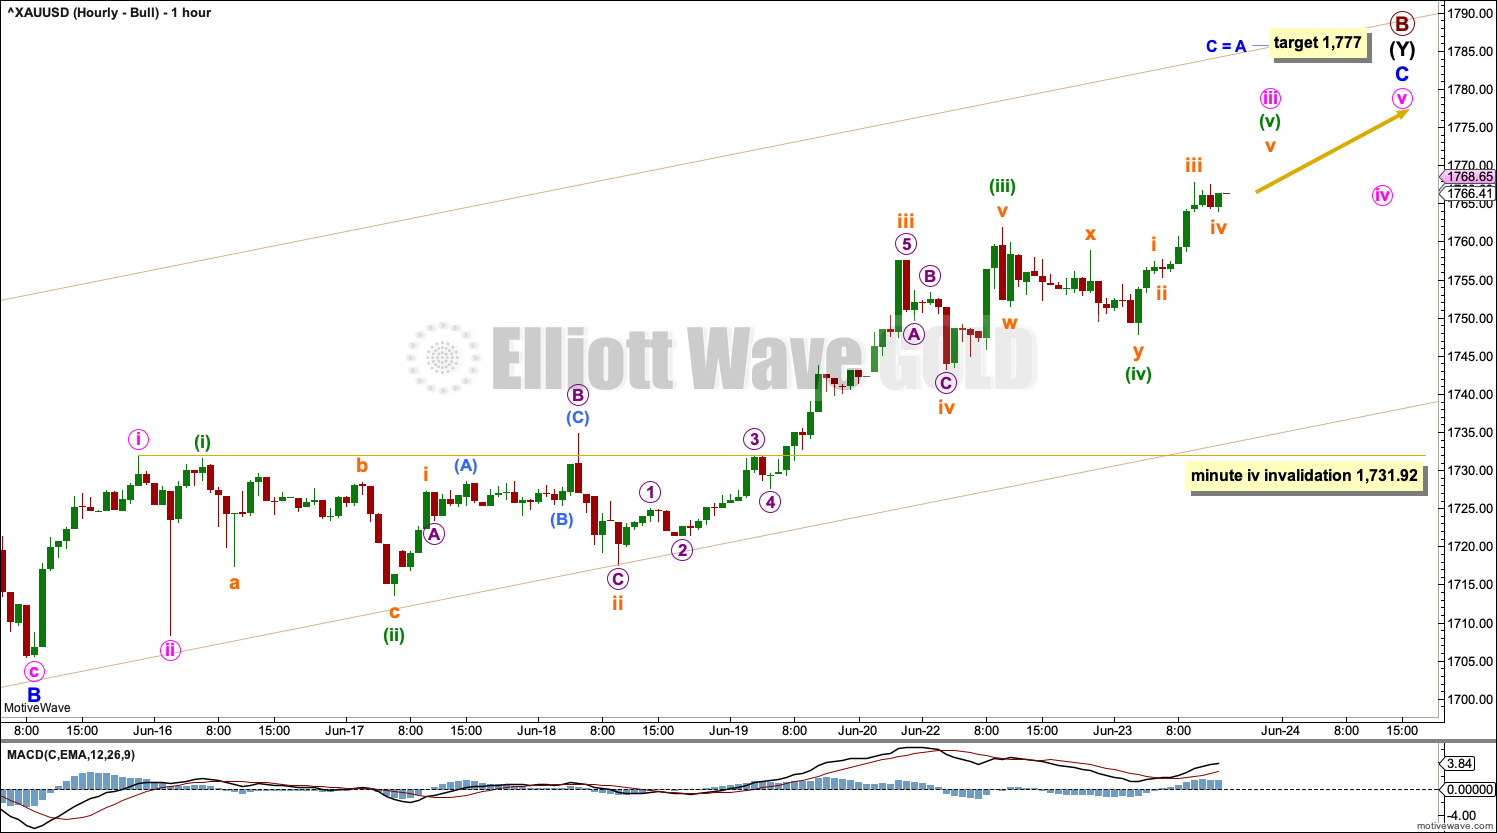
Minor wave C may be completing as a five wave impulse. Minute wave iv within the impulse may not move into minute wave i price territory below 1,731.92.
The target for minor wave C expects it to exhibit the most common Fibonacci ratio to minor wave A.
TECHNICAL ANALYSIS
WEEKLY CHART
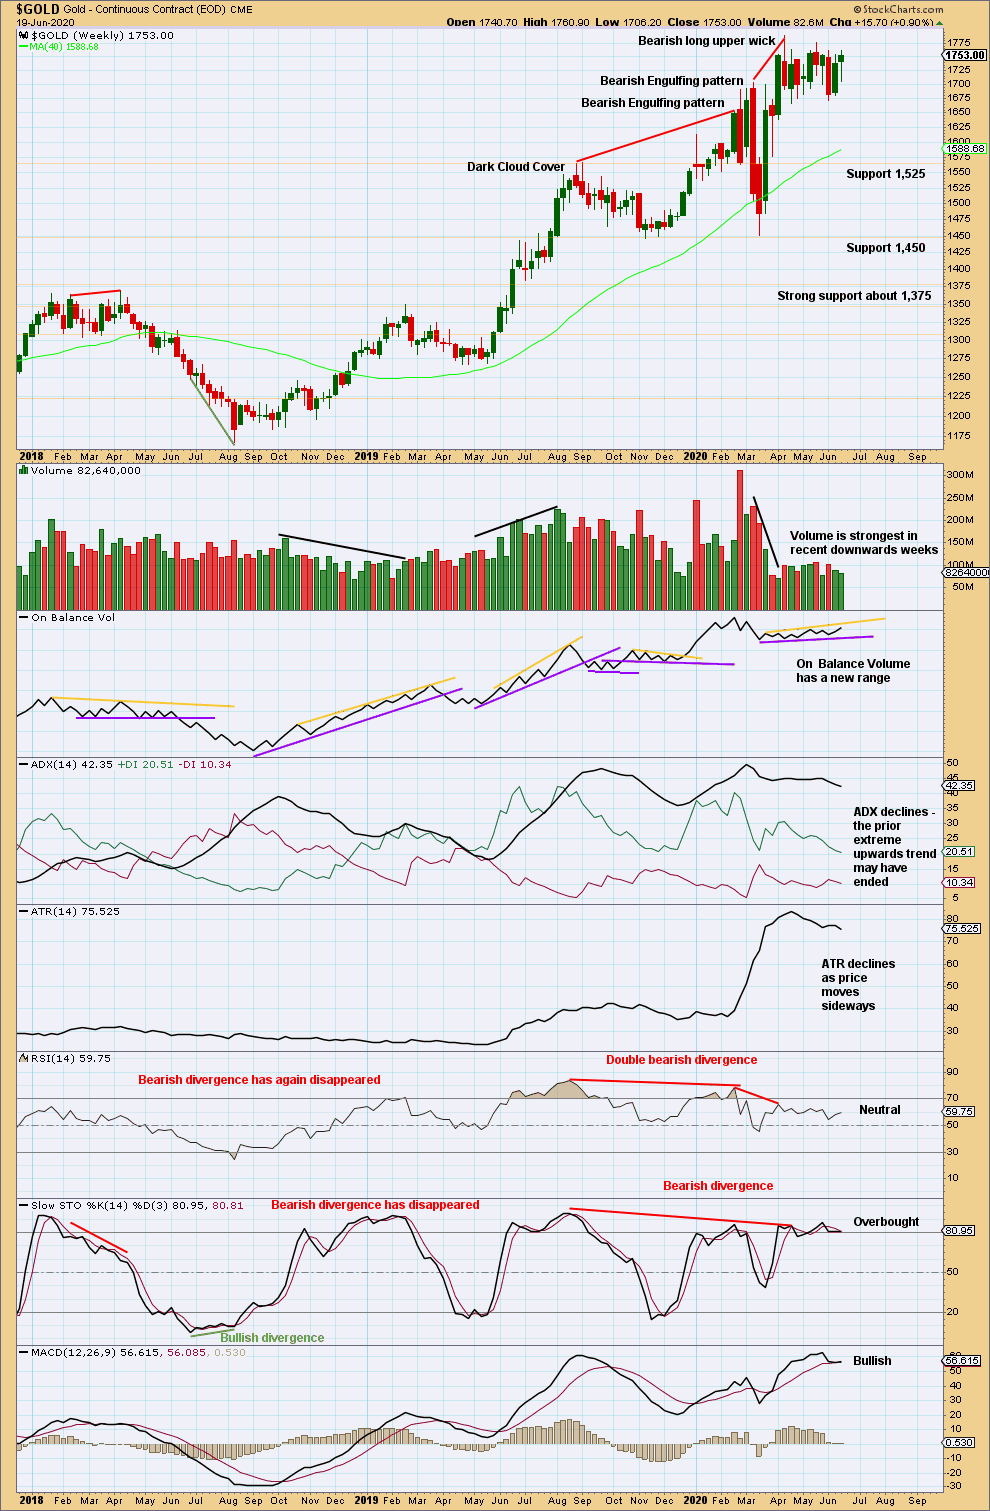
Click chart to enlarge. Chart courtesy of StockCharts.com.
Price remains within a consolidation with support about 1,665 to 1,680. The short-term volume profile is still bearish, suggesting a downwards breakout. Upwards movement within the last week lacks support from volume.
DAILY CHART
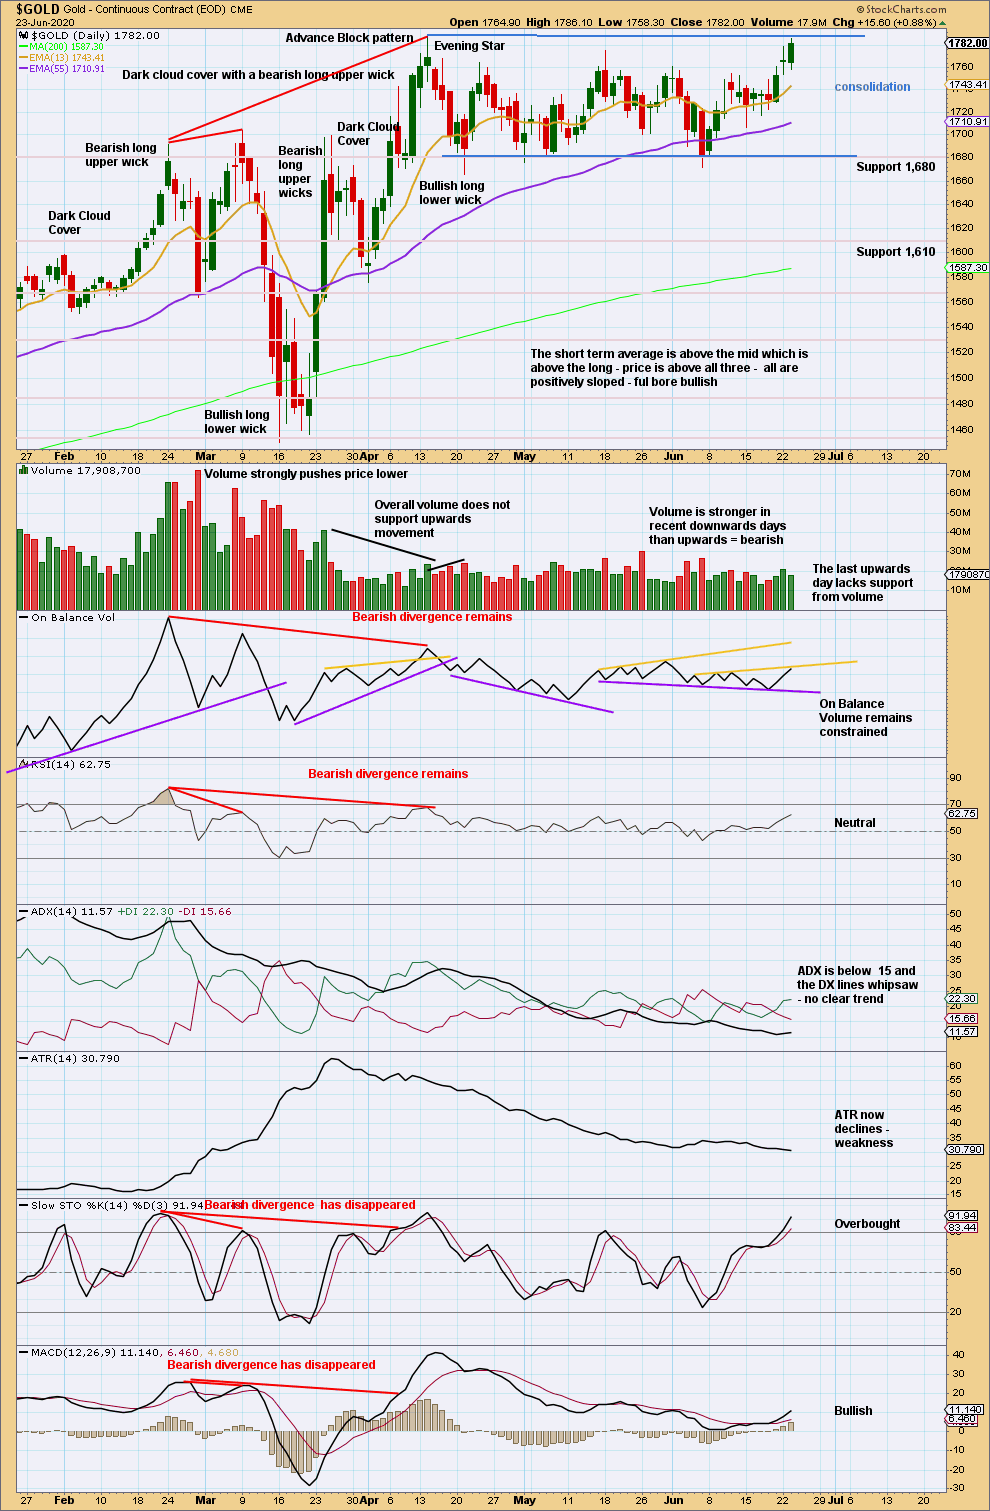
Click chart to enlarge. Chart courtesy of StockCharts.com.
Price remains range bound with support about 1,665 to 1,675 and resistance about 1,765 to 1,790. The short-term volume profile remains bearish, suggesting a downwards breakout may be more likely. This last upwards session has a high for Stockcharts data at 1,786.10, so there has been no upwards breakout. Declining volume for this last session suggests an upwards swing may end here.
An upwards breakout requires support from volume for confidence. Upwards breakouts lacking support from volume should be viewed with suspicion. An upwards breakout requires price to close above resistance at 1,788.80, which is the high of 14th of April.
GDX WEEKLY CHART
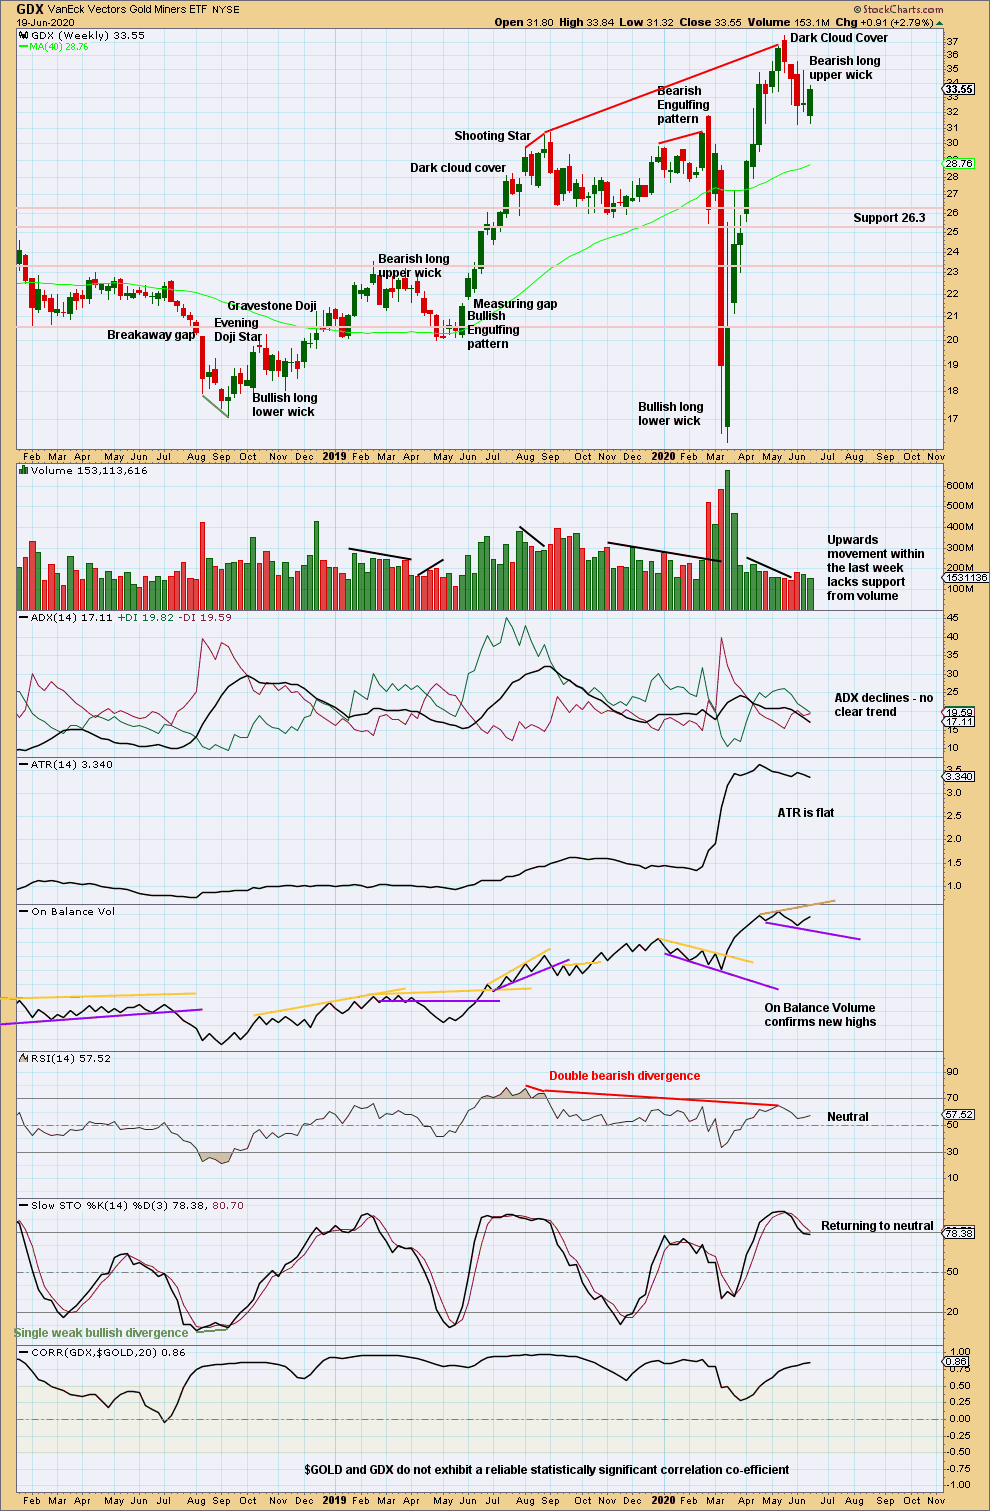
Click chart to enlarge. Chart courtesy of StockCharts.com.
The volume profile may be bearish, but this is best judged at the daily chart level this week.
GDX DAILY CHART
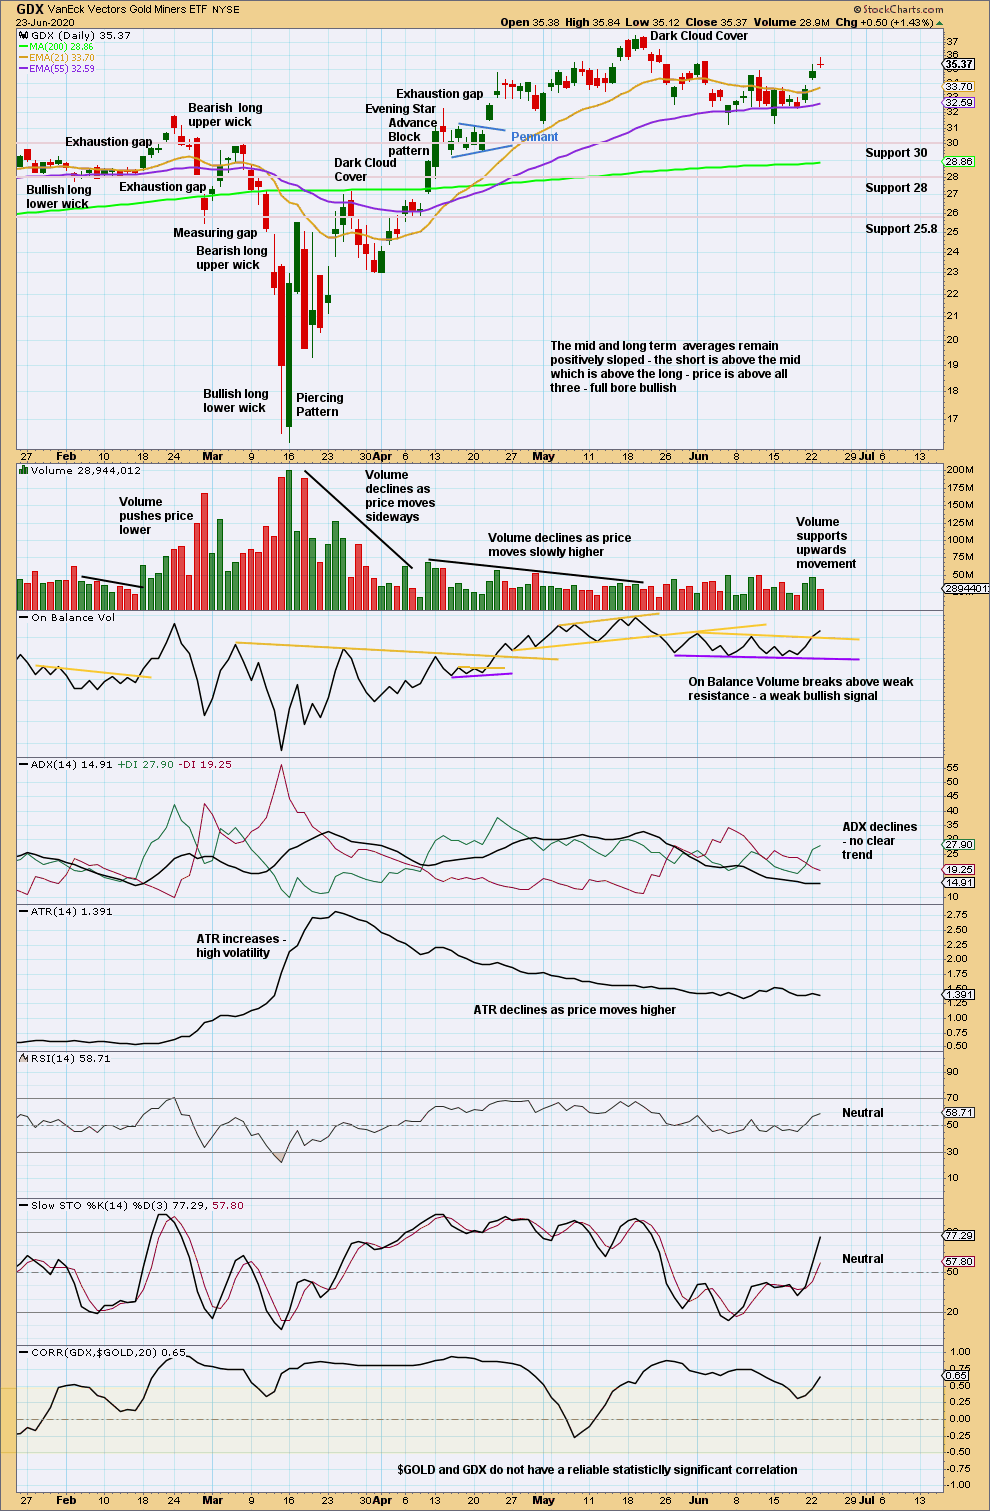
Click chart to enlarge. Chart courtesy of StockCharts.com.
Price is range bound with resistance about 35.55 to 37.50 and support about 31.20 to 31.30. A breakout of this range is required before having confidence in a trend. An upwards breakout should have support from volume for confidence. A downwards breakout does not require volume for support. Today a weak bullish signal from On Balance Volume suggests an upwards breakout may come soon.
Published @ 08:06 p.m. EST.
—
Careful risk management protects your trading account(s).
Follow my two Golden Rules:
1. Always trade with stops.
2. Risk only 1-5% of equity on any one trade.
—
New updates to this analysis are in bold.