
GOLD: Elliott Wave and Technical Analysis | Charts – June 30, 2020
The main wave count assumes the trend remains the same until proven otherwise. The trend is upwards. Price continues to move higher towards the target.
Summary: The next target is at 1,820. The final target is at 1,980.
Today Stockcharts data confirms an upwards breakout with a little support from volume. But On Balance Volume remains at resistance. If targets are wrong, then they may be too optimistic. An alternate wave count has a target at 1,791 for a major trend change.
Grand SuperCycle analysis is here.
Monthly charts were last updated here.
MAIN BEARISH ELLIOTT WAVE COUNT
WEEKLY CHART
Click chart to enlarge.
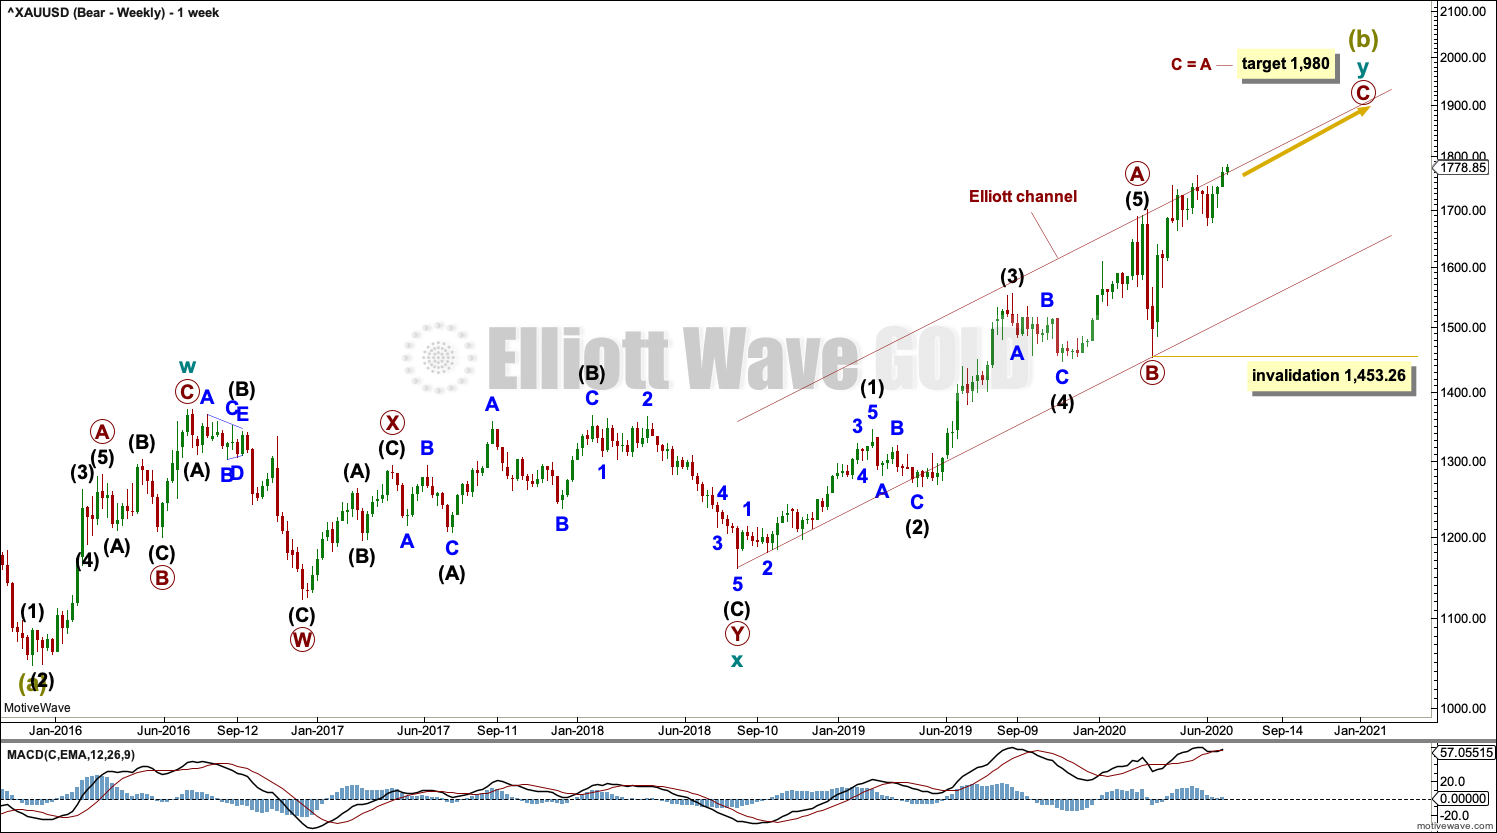
The bigger picture for this main bearish Elliott wave count sees Gold as still within a bear market, in a three steps back pattern that is labelled Grand Super Cycle wave IV on monthly charts.
Super Cycle wave (b) within Grand Super Cycle wave IV may be an incomplete double zigzag. When Super Cycle wave (b) may be complete, then this wave count expects Super Cycle wave (c) to begin and to move price below the end of Super Cycle wave (a) at 1,046.27.
The first zigzag in the double is labelled cycle wave w. The double is joined by a three in the opposite direction, a combination labelled cycle wave x. The second zigzag in the double is labelled cycle wave y.
The purpose of the second zigzag in a double is to deepen the correction. Cycle wave y has achieved this purpose.
We should always assume the trend remains the same until proven otherwise. At this stage, Gold is in a bull market for the mid term.
DAILY CHART
Click chart to enlarge.
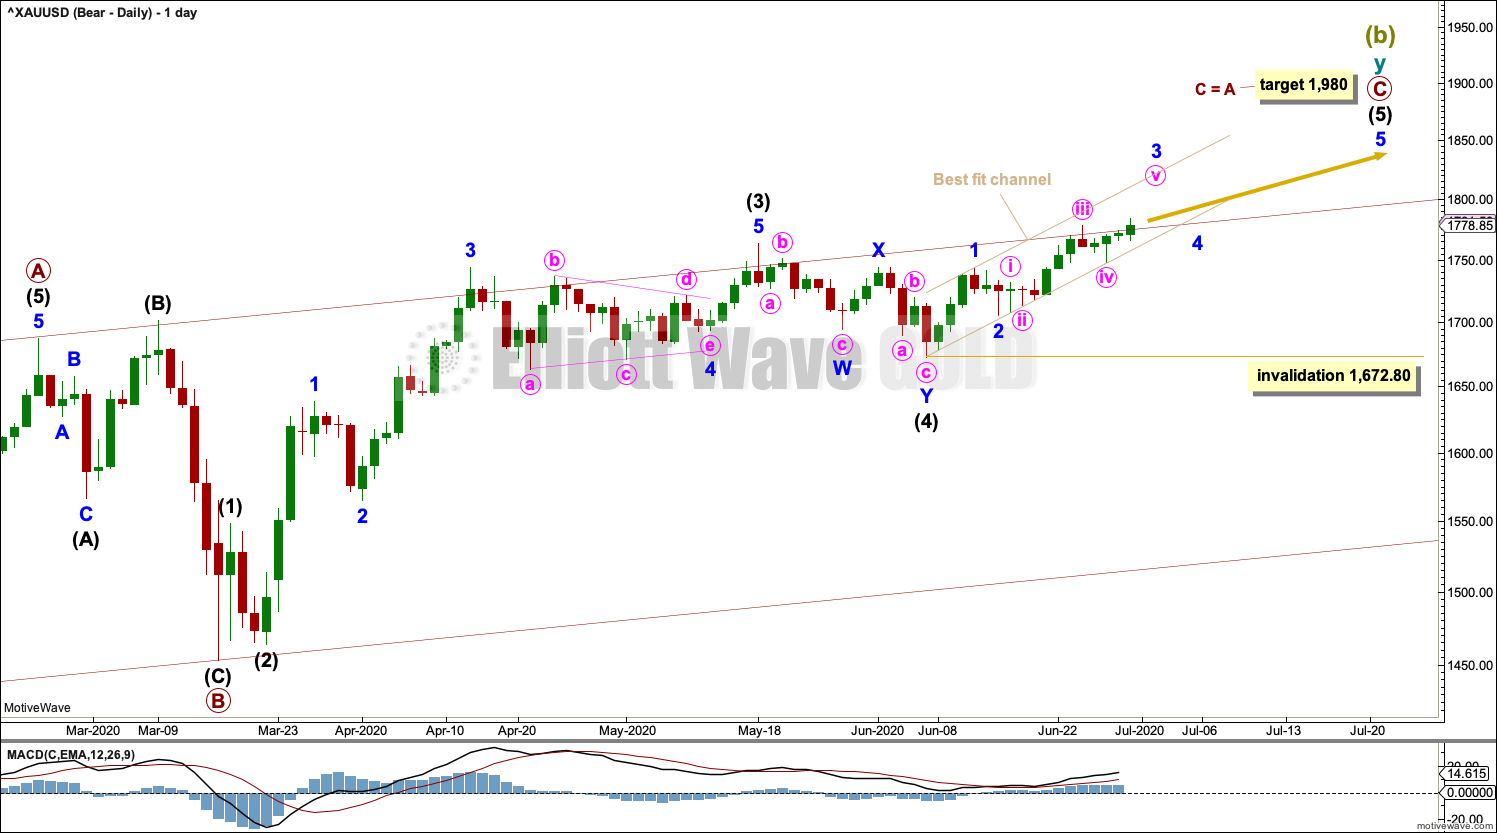
Primary wave C may be an incomplete five wave impulse.
Within the impulse: intermediate waves (1) through to (3) may be complete and intermediate wave (4) may be a double zigzag. No second wave correction within intermediate wave (5) may move beyond its start below 1,672.80.
Draw a best fit channel about the start of intermediate wave (5) as shown. The lower edge of the channel may provide support for corrections along the way up.
HOURLY CHART
Click chart to enlarge.
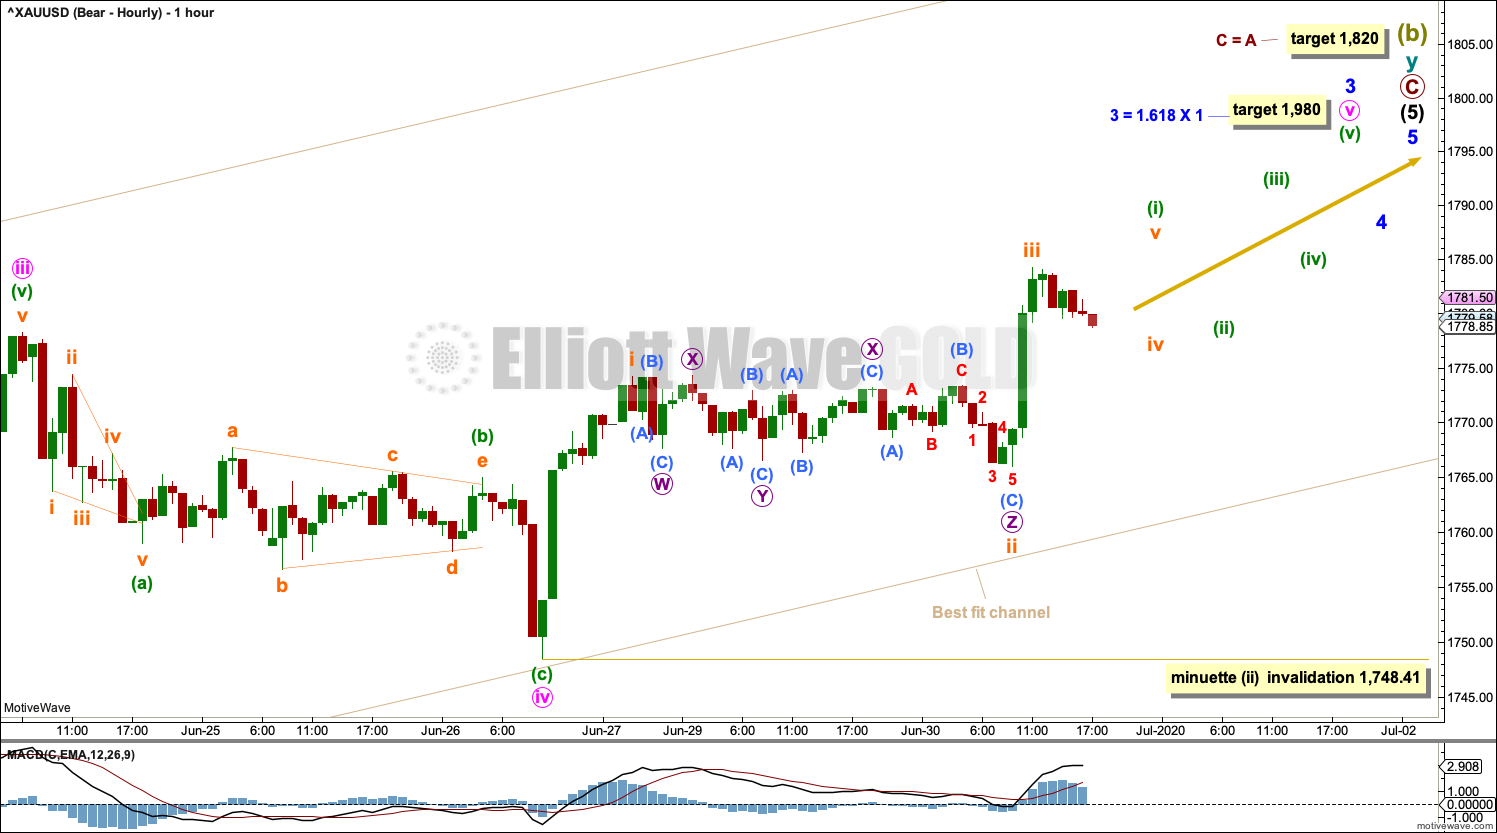
The hourly chart shows the end of minor wave 3, from the high of minute wave iii within minor wave 3. Minor wave 3 may only subdivide as an impulse.
Minute waves i through to iv within the impulse of minor wave 3 may now be complete. Minute wave v may be underway. Minuette wave (i) within minute wave v may be nearing completion.
Gold typically exhibits swift strong fifth waves to end third waves one degree higher. Look out for the possibility that minuette wave v to end minute wave v to end minor wave 3 may exhibit a blow off top.
Minuette wave (ii) within minute wave v may not move beyond the start of minuette wave (i) below 1,748.41.
ALTERNATE BEARISH ELLIOTT WAVE COUNT
WEEKLY CHART
Click chart to enlarge.
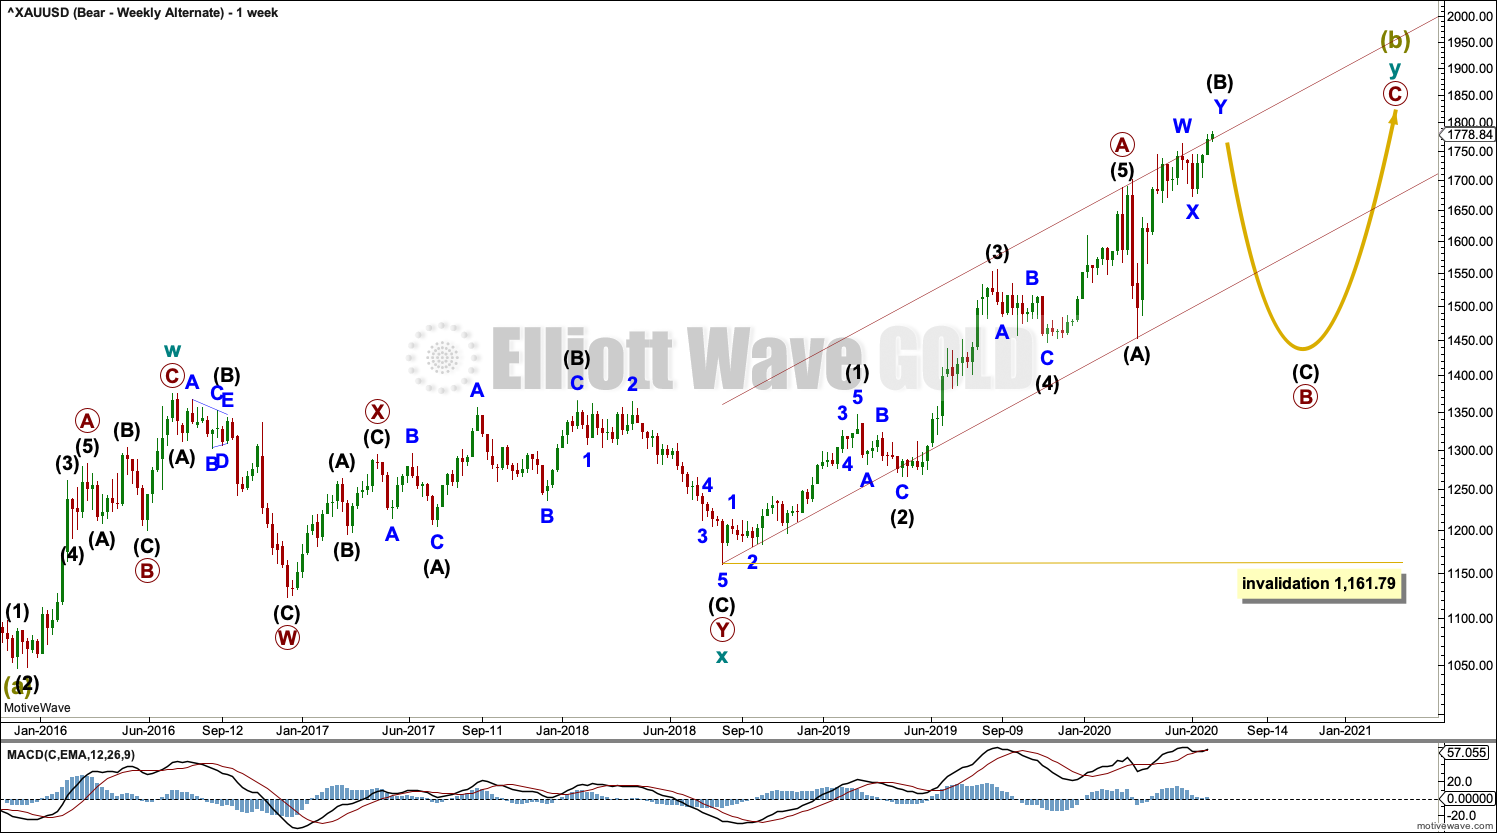
This wave count has support from classic technical analysis.
It is possible that primary wave B is an incomplete expanded flat correction.
The only problem with this wave count is the size in terms of both duration and price travelled for primary wave B. It looks much larger than cycle wave w, but cycle wave y is already much longer than cycle wave w, so this may be acceptable.
If primary wave A is correctly labelled as a five wave structure, then primary wave B may not move beyond its start below 1,161.79.
DAILY CHART
Click chart to enlarge.
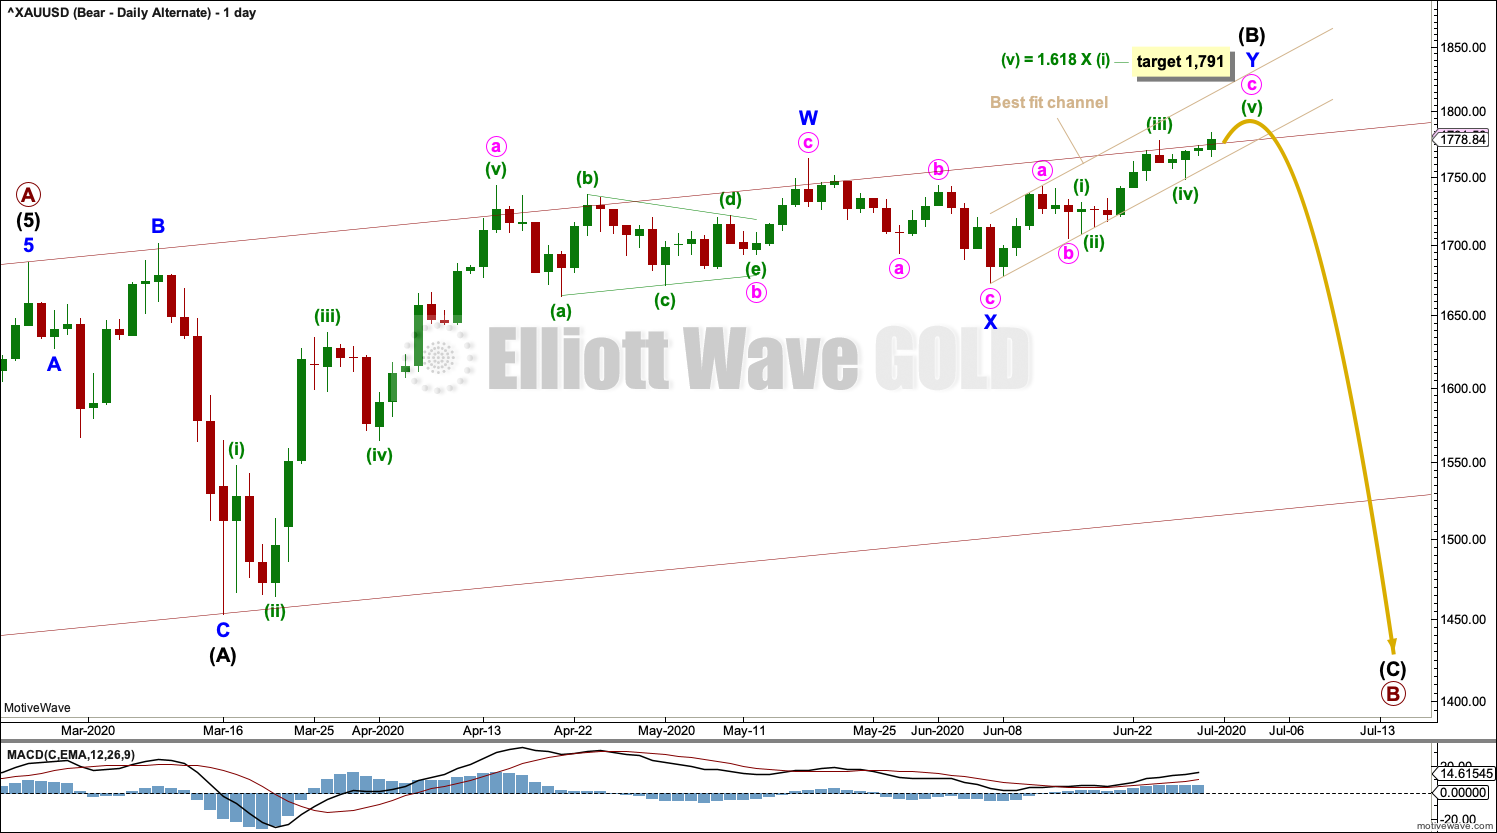
Primary wave B may be continuing as an expanded flat correction. The most common range for intermediate wave (B) within an expanded flat is from 1 to 1.38 times the length of intermediate wave (A), giving a range from 1,687.92 to 1,777.09. The target calculated would see intermediate wave (B) end within this range.
When intermediate wave (B) may be a complete structure, then a trend change would be expected. Intermediate wave (C) downwards would be extremely likely to make at least a slight new low below the end of intermediate wave (A) at 1,453.26 to avoid a truncation and a very rare running flat.
When intermediate wave (B) may be complete and the start of intermediate wave (C) may be known, then a target may be calculated for intermediate wave (C) to end. That cannot be done yet.
This alternate wave count sees an expanded flat unfolding for primary wave B, in mostly the same way as the alternate bullish wave count below sees an expanded flat unfolding for cycle wave IV.
HOURLY CHART
Click chart to enlarge.
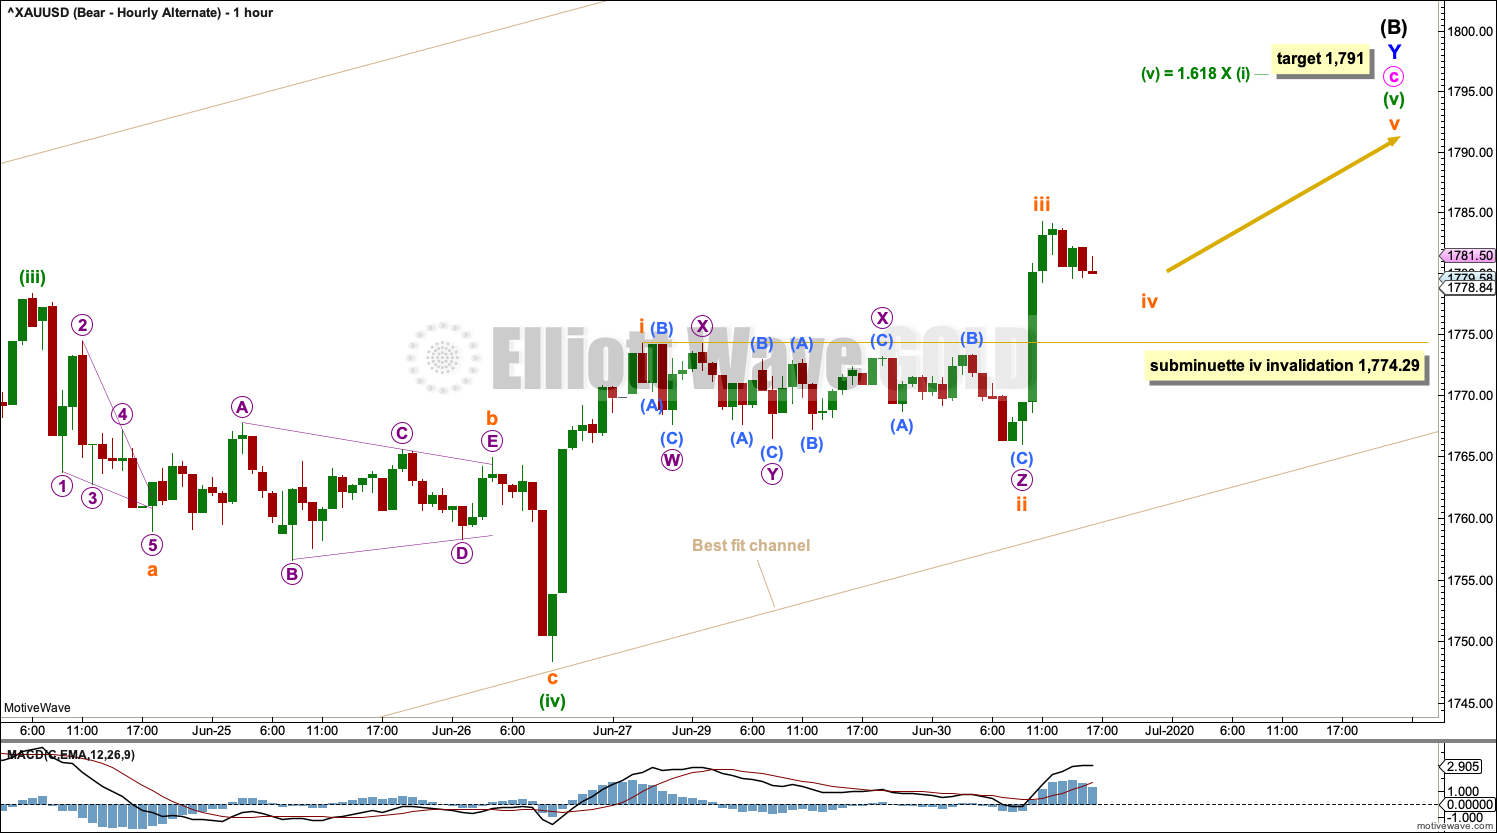
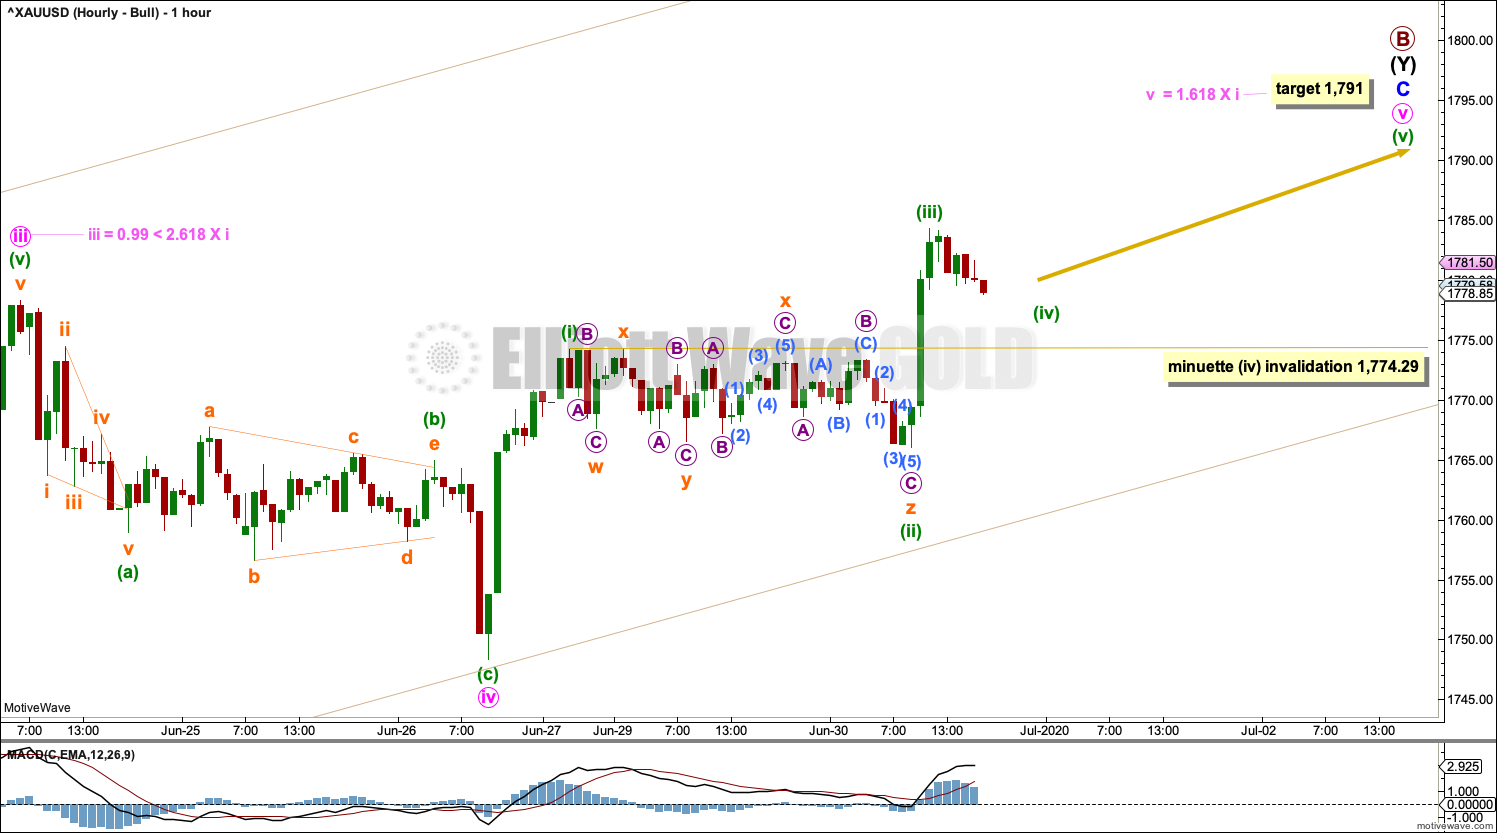
This hourly chart shows the end of minute wave c within minor wave Y within intermediate wave (B).
The high labelled minuette wave (iii) may be seen on the daily chart.
Minute wave c may be subdividing as an impulse. Minuette waves (i) through to (iv) within the impulse may be complete. Minuette wave (v) may have begun.
Minuette wave (v) may be subdividing as an impulse. Subminuette waves i through to iii within minuette wave (v) may be complete. Subminuette wave iv may not move into subminuette wave i price territory below 1,774.29.
ALTERNATE BULLISH ELLIOTT WAVE COUNT
WEEKLY CHART
Click chart to enlarge.
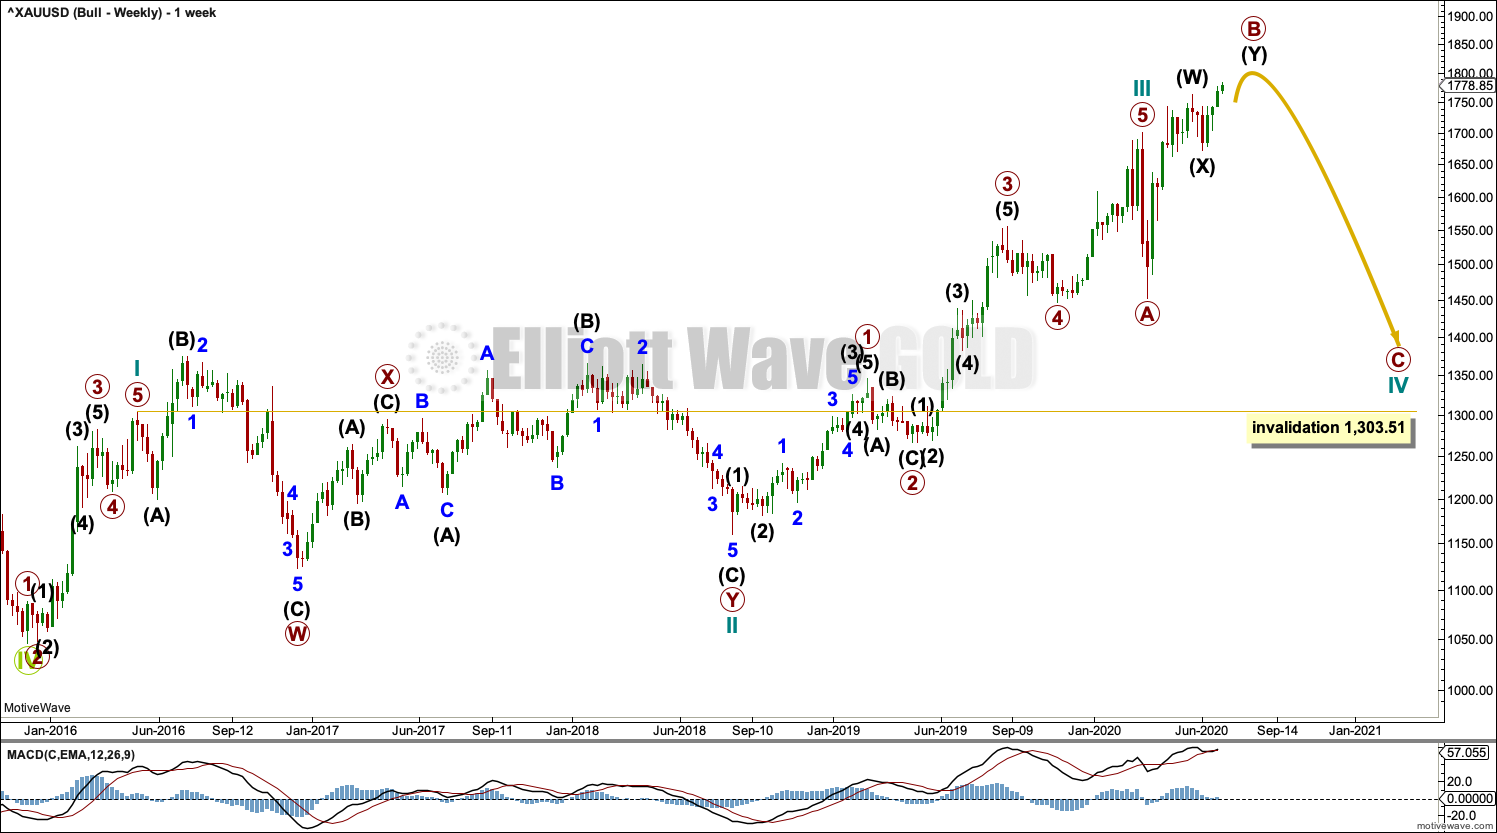
This wave count sees the the bear market complete at the last major low for Gold on 3 December 2015.
If Gold is in a new bull market, then it should begin with a five wave structure upwards on the weekly chart.
Cycle wave I fits as a five wave impulse with reasonably proportionate corrections for primary waves 2 and 4.
Cycle wave II fits as a double flat. However, within the first flat correction labelled primary wave W, this wave count needs to ignore what looks like an obvious triangle from July to September 2016 (this can be seen labelled as a triangle on the bear wave count above). This movement must be labelled as a series of overlapping first and second waves. Ignoring this triangle reduces the probability of this wave count in Elliott wave terms.
Within the first flat correction labelled primary wave W of the double flat of cycle wave II, intermediate wave (B) is 1.69 the length of intermediate wave (A). This is longer than the common range of up to 1.38, but within an allowable guideline of up to 2. The length of intermediate wave (B) reduces the probability of this wave count.
Cycle wave III may be complete. Cycle wave IV may not move into cycle wave I price territory below 1,303.51.
DAILY CHART
Click chart to enlarge.
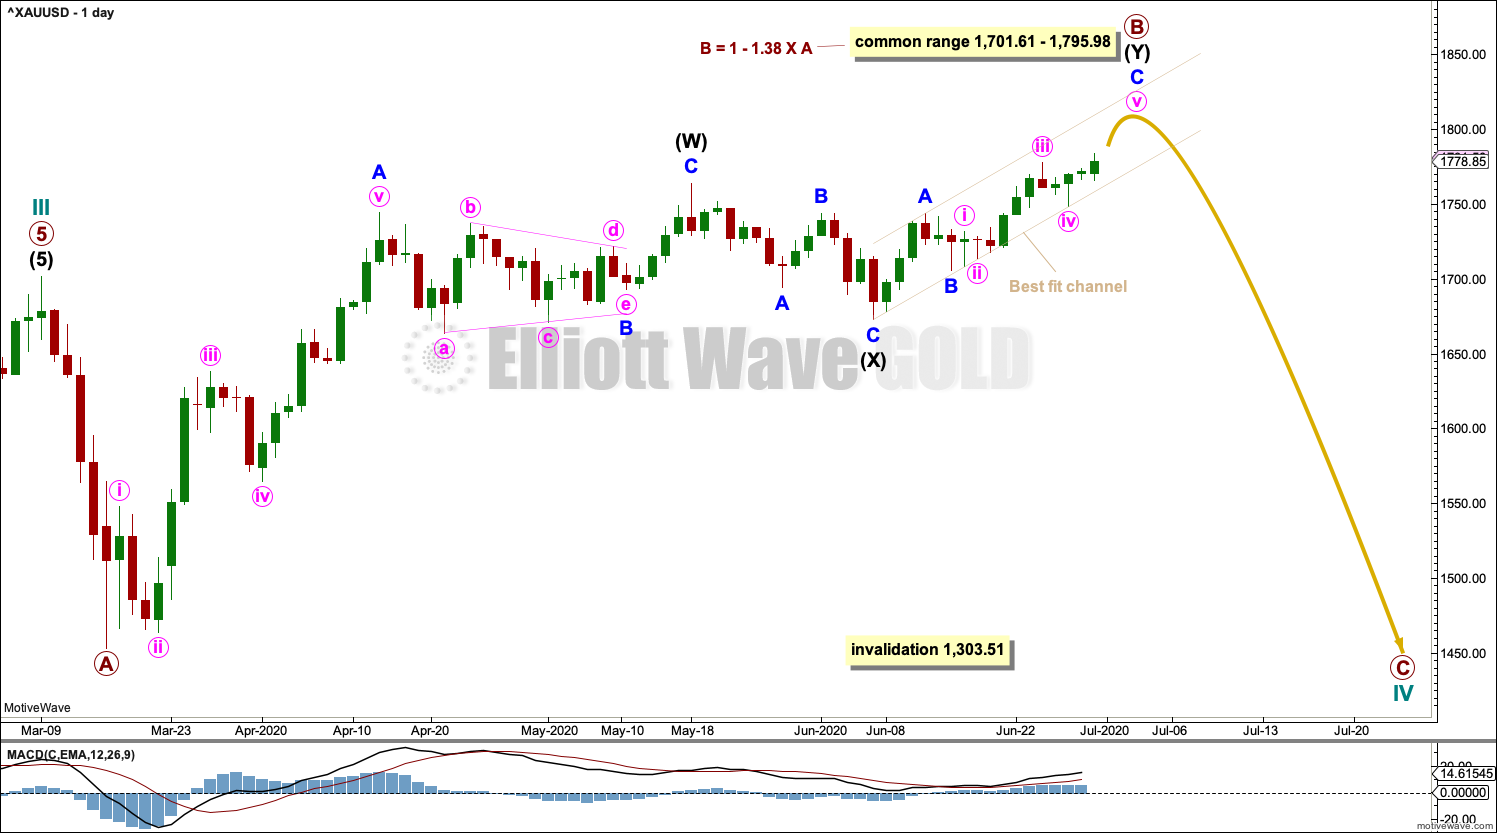
Cycle wave IV may be an incomplete expanded flat correction. Primary wave A within the flat correction may have subdivided as a zigzag. Primary wave B may be continuing higher as a double zigzag.
The common range of primary wave B would extend up to 1.38 times the length of primary wave A at 1,795.98. A maximum allowable guideline for primary wave B would be up to 2 times the length of primary wave A at 1,949.96. There is no Elliott wave rule stating a limit for B waves within expanded flat corrections, so there is no rule which may be used to determine an upper invalidation point for this wave count.
Draw a best fit channel about intermediate wave (Y). Copy the channel over to the hourly chart. Assume upwards movement may continue while price remains within the channel. If the channel is breached, then assume intermediate wave (Y) may be over.
HOURLY CHART
Click chart to enlarge.
Minor wave C may be completing as a five wave impulse. Minute waves i through to iv may now be complete. Minuette waves (i) through to (iii) within minute wave v may be complete. Minuette wave (iv) may not move into minuette wave (i) price territory below 1,774.29.
The structure for minor wave C looks incomplete. A target is calculated for minute wave v to end.
TECHNICAL ANALYSIS
WEEKLY CHART
Click chart to enlarge. Chart courtesy of StockCharts.com.
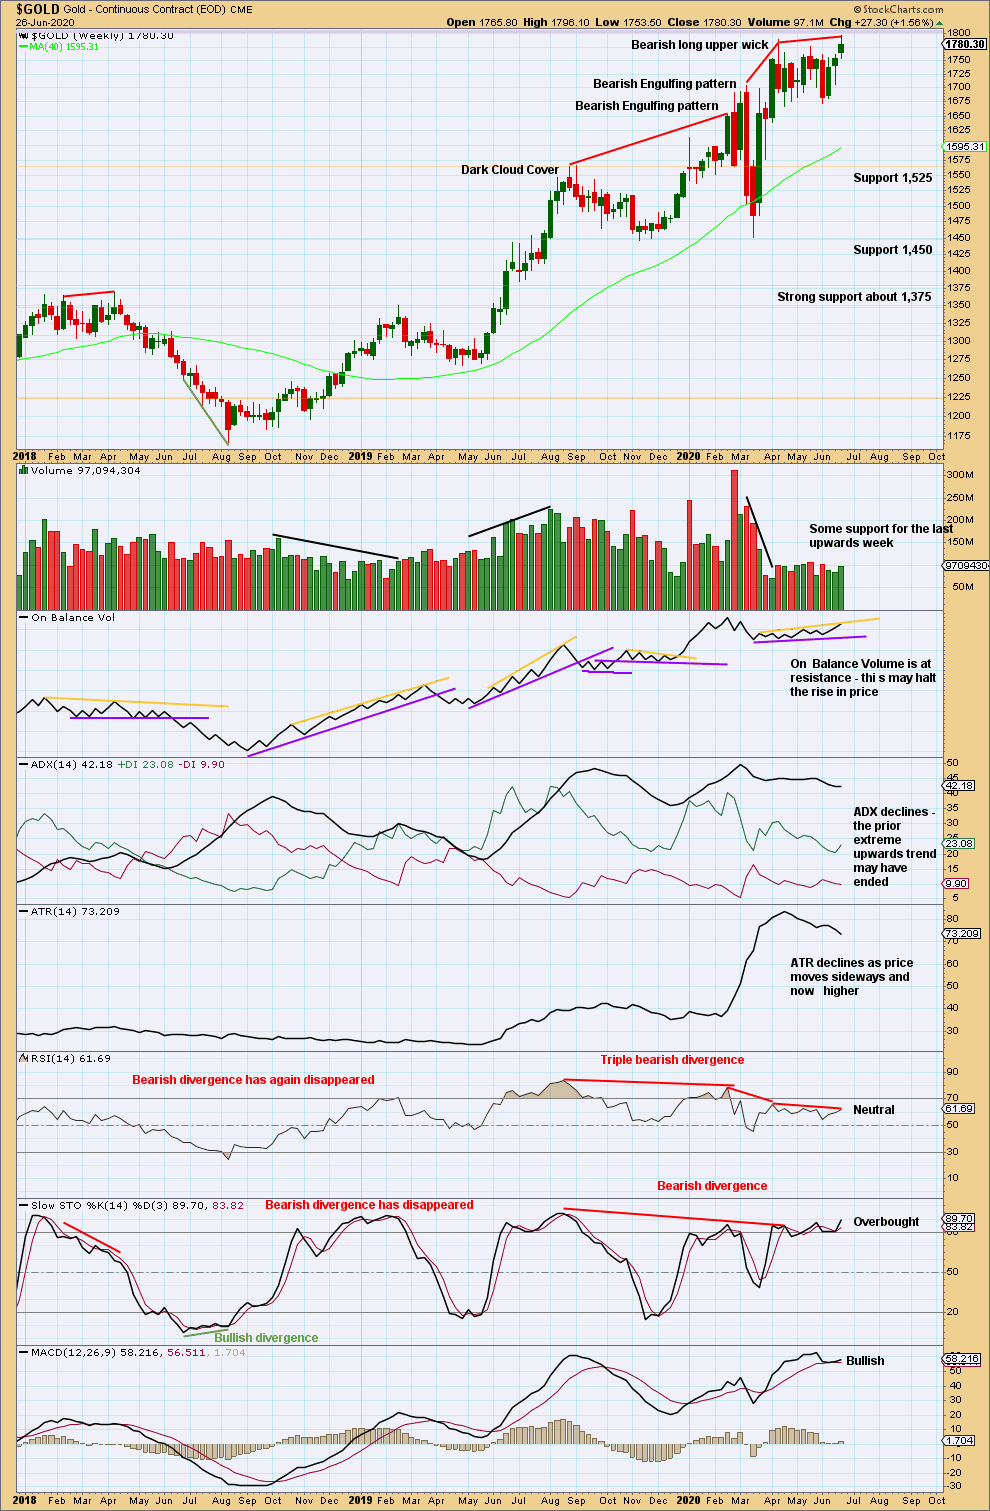
Price remains within a consolidation with support about 1,665 to 1,680.
There is now strong triple bearish divergence between price and RSI. This supports either the alternate bearish Elliott wave count or the bullish Elliott wave count.
DAILY CHART
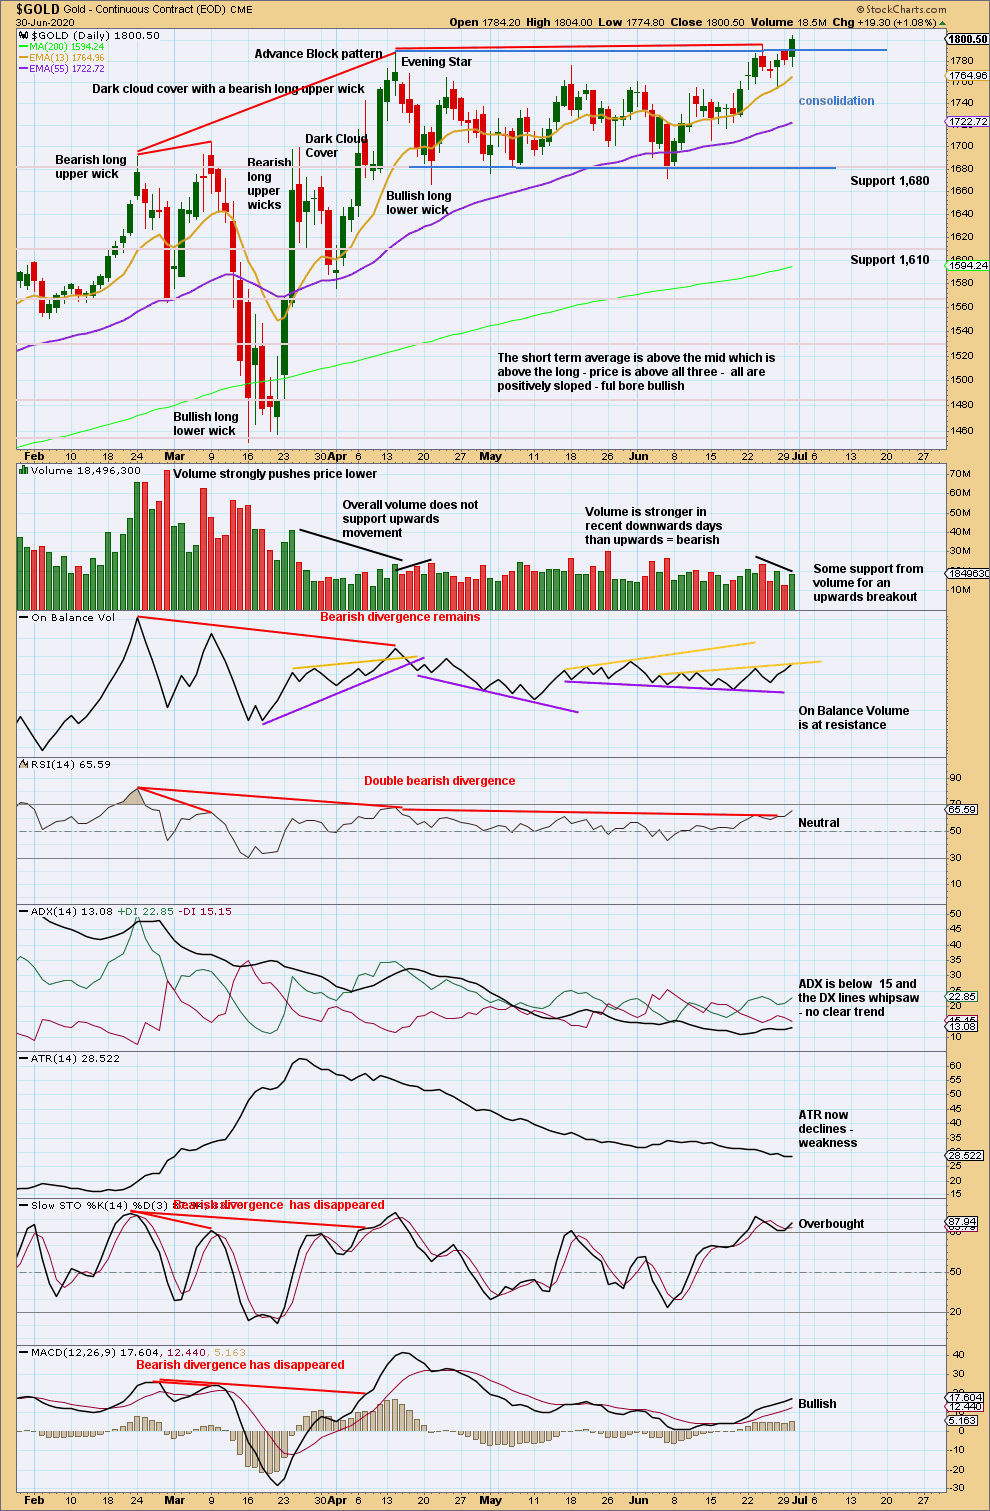
Click chart to enlarge. Chart courtesy of StockCharts.com.
Today price has closed above resistance, which was at 1,788.80. Today has stronger volume than yesterday, but overall volume is declining. There is only a little support from volume for this upwards breakout, so it is slightly suspicious. If On Balance Volume can break above resistance, then more confidence in the upwards breakout may be had. Mid-term bearish divergence between price and RSI remains. This chart supports either of the alternate Elliott wave counts more than the main wave count.
GDX WEEKLY CHART
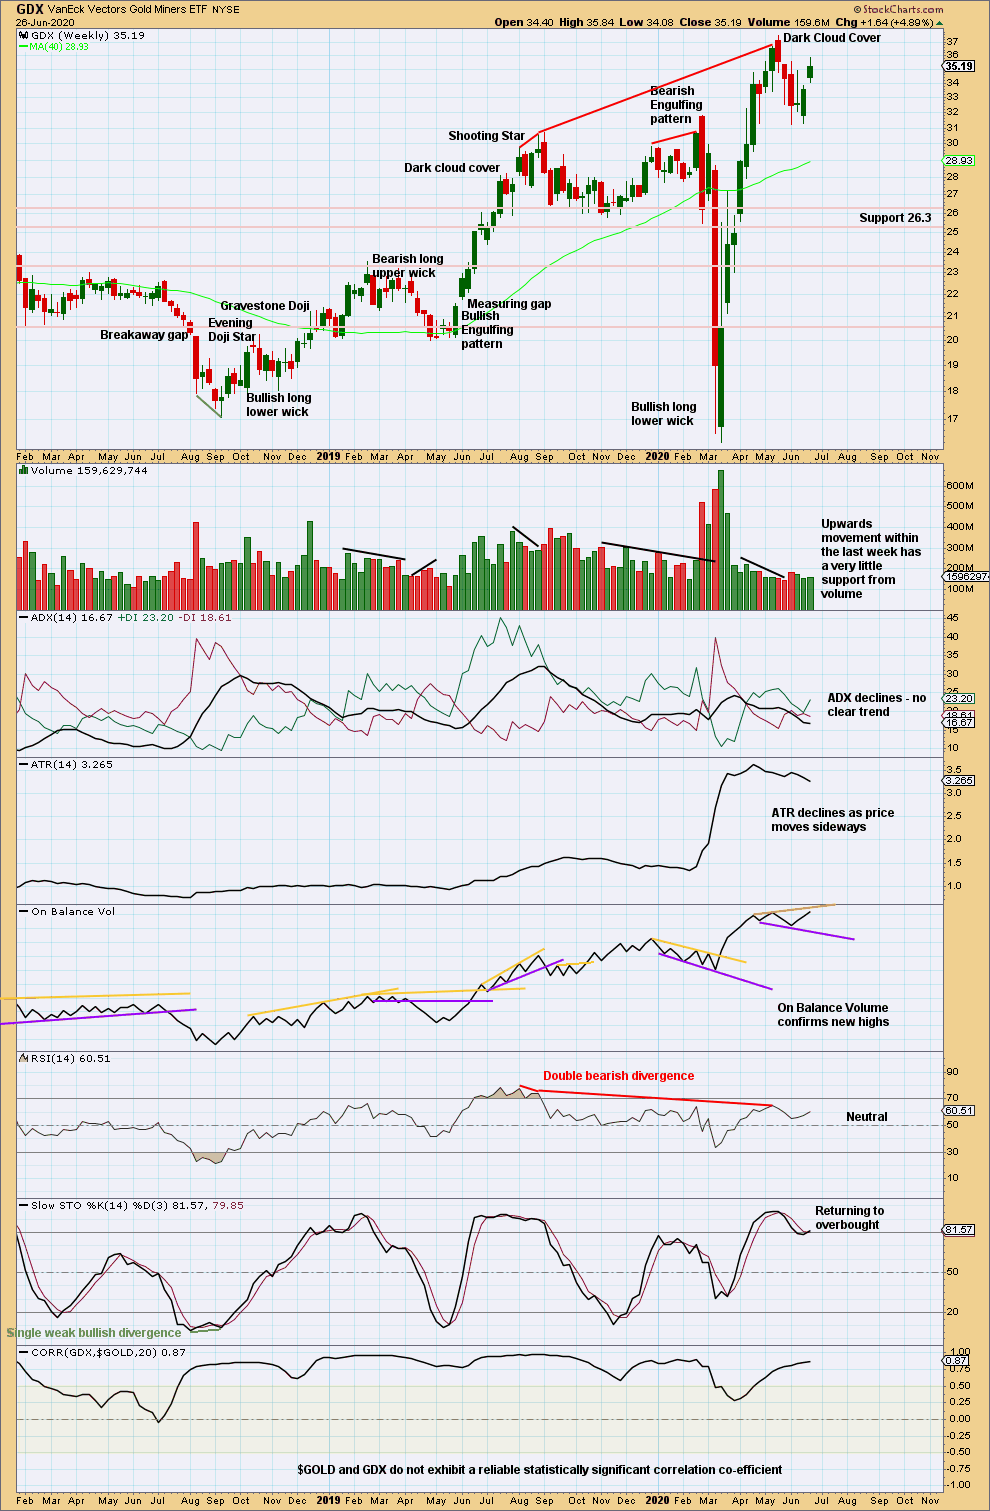
Click chart to enlarge. Chart courtesy of StockCharts.com.
Overall, range last week has decreased and volume remains light. Price is range bound.
GDX DAILY CHART
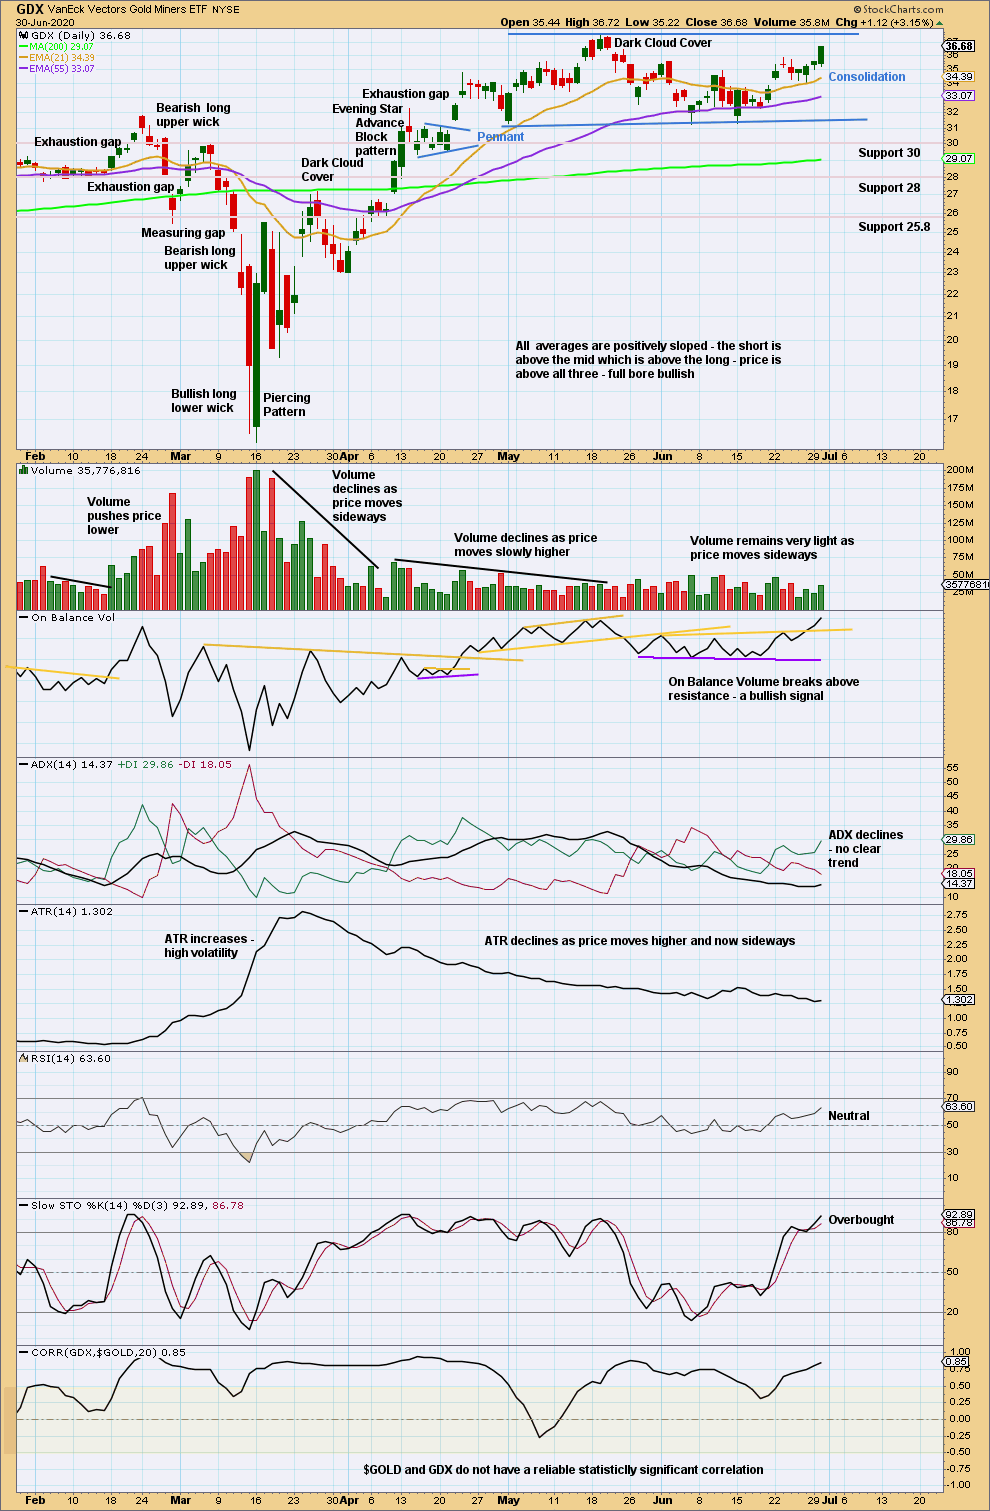
Click chart to enlarge. Chart courtesy of StockCharts.com.
Price is range bound with resistance about 35.55 to 37.50 and support about 31.20 to 31.30. A breakout of this range is required before having confidence in a trend. An upwards breakout should have support from volume for confidence. A downwards breakout does not require volume for support.
A bullish signal from On Balance Volume suggests an upwards breakout may be more likely than a downwards breakout.
Published @ 06:35 p.m. ET.
—
Careful risk management protects your trading account(s).
Follow my two Golden Rules:
1. Always trade with stops.
2. Risk only 1-5% of equity on any one trade.
—
New updates to this analysis are in bold.