
GOLD: Elliott Wave and Technical Analysis | Charts – June 2, 2020
Sideways movement has now continued for three weeks. All three Elliott wave counts remain the same.
Summary: Upwards movement here is still expected because we should assume the trend remains the same until proven otherwise. This trend is extreme and stretched, but it may continue further. At this time, there is not enough technical evidence of a trend change.
The target is at 1,980. This target is valid only while price remains above 1,693.39.
If price breaks below 1,693.39, then expect continuing downwards movement to at least 1,362.
Grand SuperCycle analysis is here.
Monthly charts were last updated here.
MAIN BEARISH ELLIOTT WAVE COUNT
WEEKLY CHART
Click chart to enlarge.
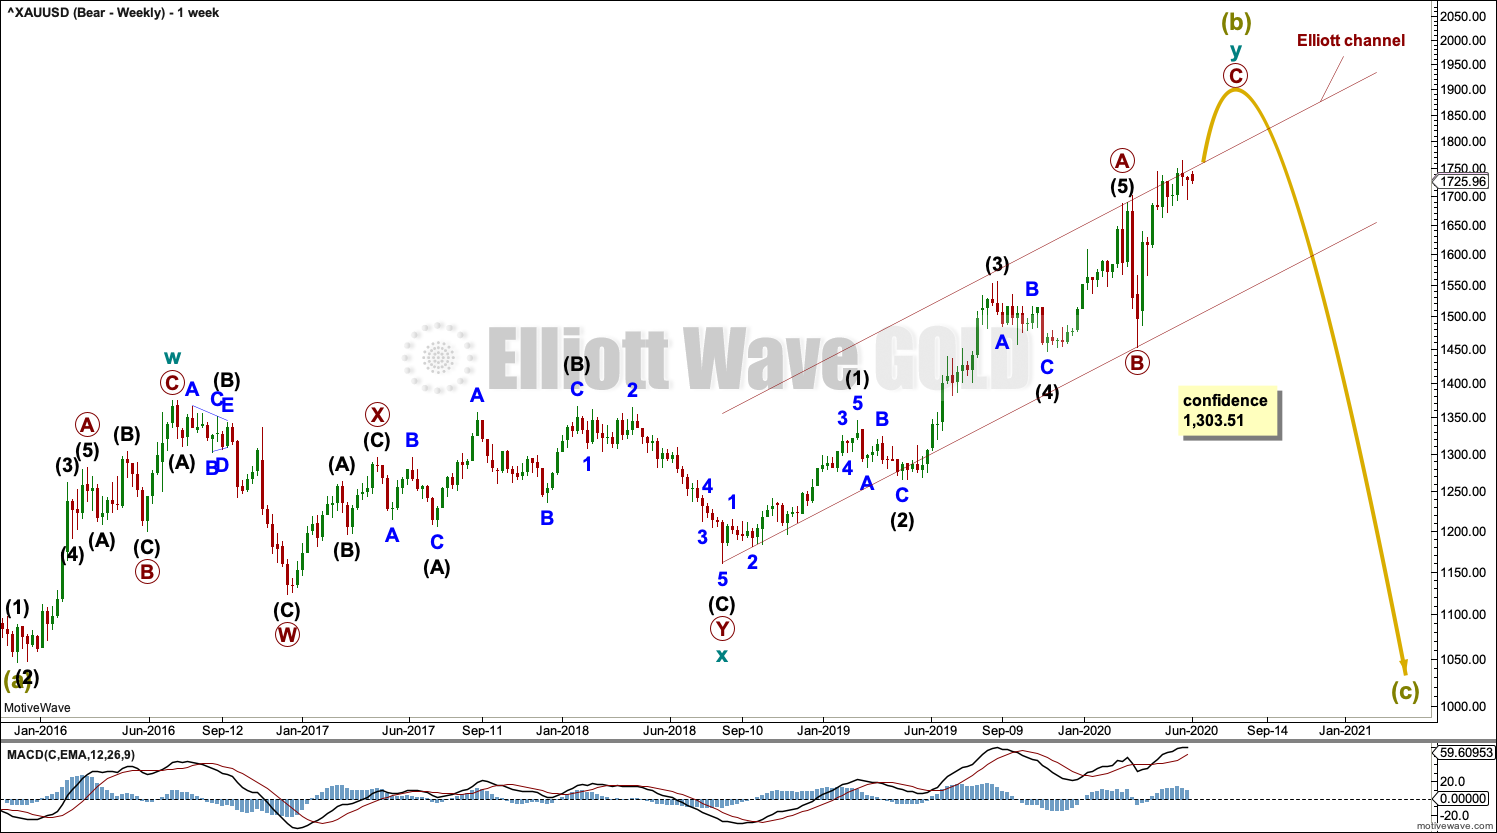
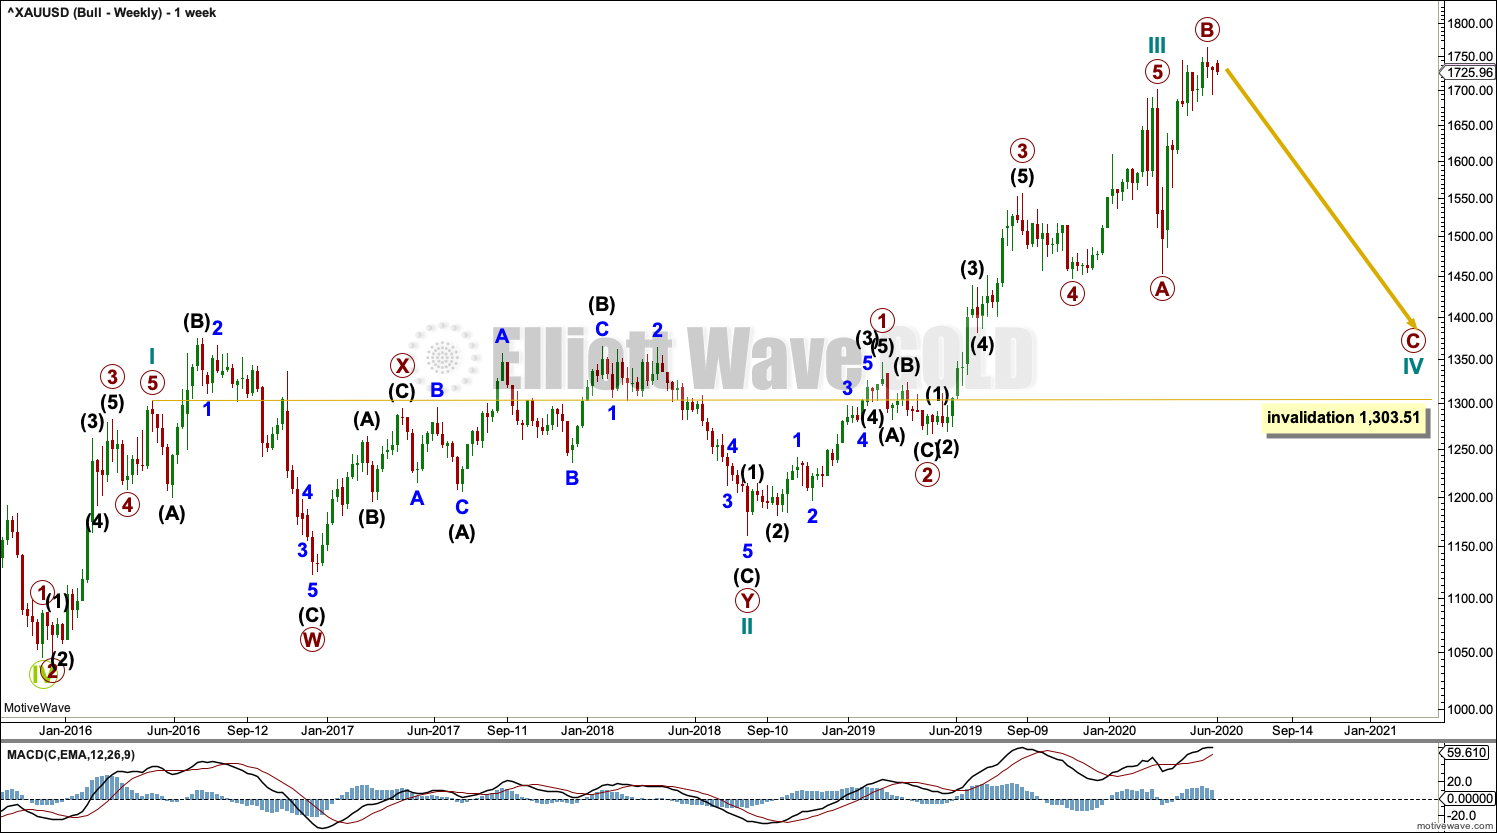
The bigger picture for this main bearish Elliott wave count sees Gold as still within a bear market, in a three steps back pattern that is labelled Grand Super Cycle wave IV on monthly charts.
Super Cycle wave (b) within Grand Super Cycle wave IV may be an incomplete double zigzag.
The first zigzag in the double is labelled cycle wave w. The double is joined by a three in the opposite direction, a combination labelled cycle wave x. The second zigzag in the double is labelled cycle wave y.
The purpose of the second zigzag in a double is to deepen the correction. Cycle wave y has achieved this purpose.
DAILY CHART
Click chart to enlarge.
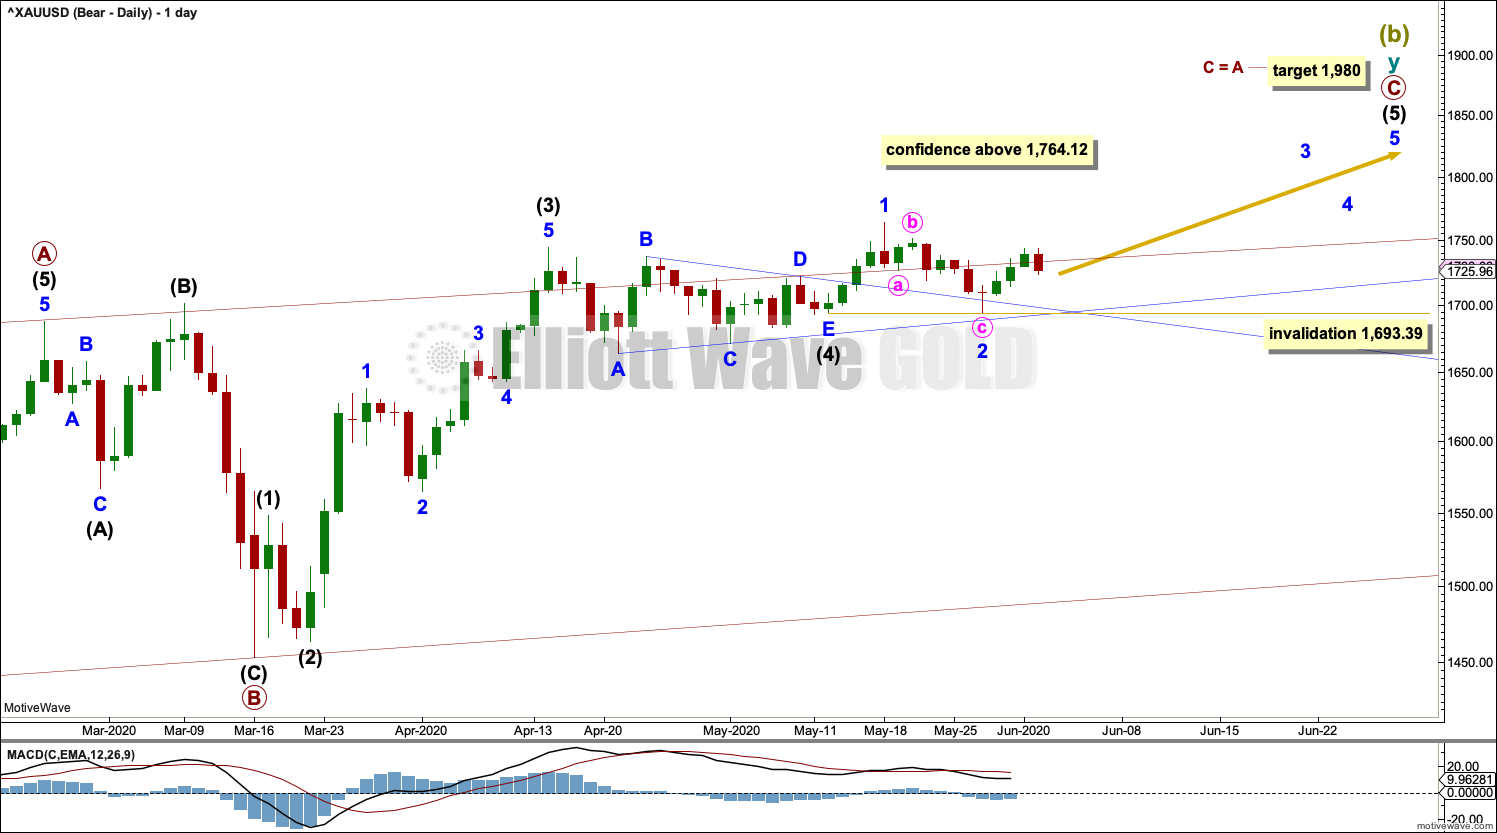
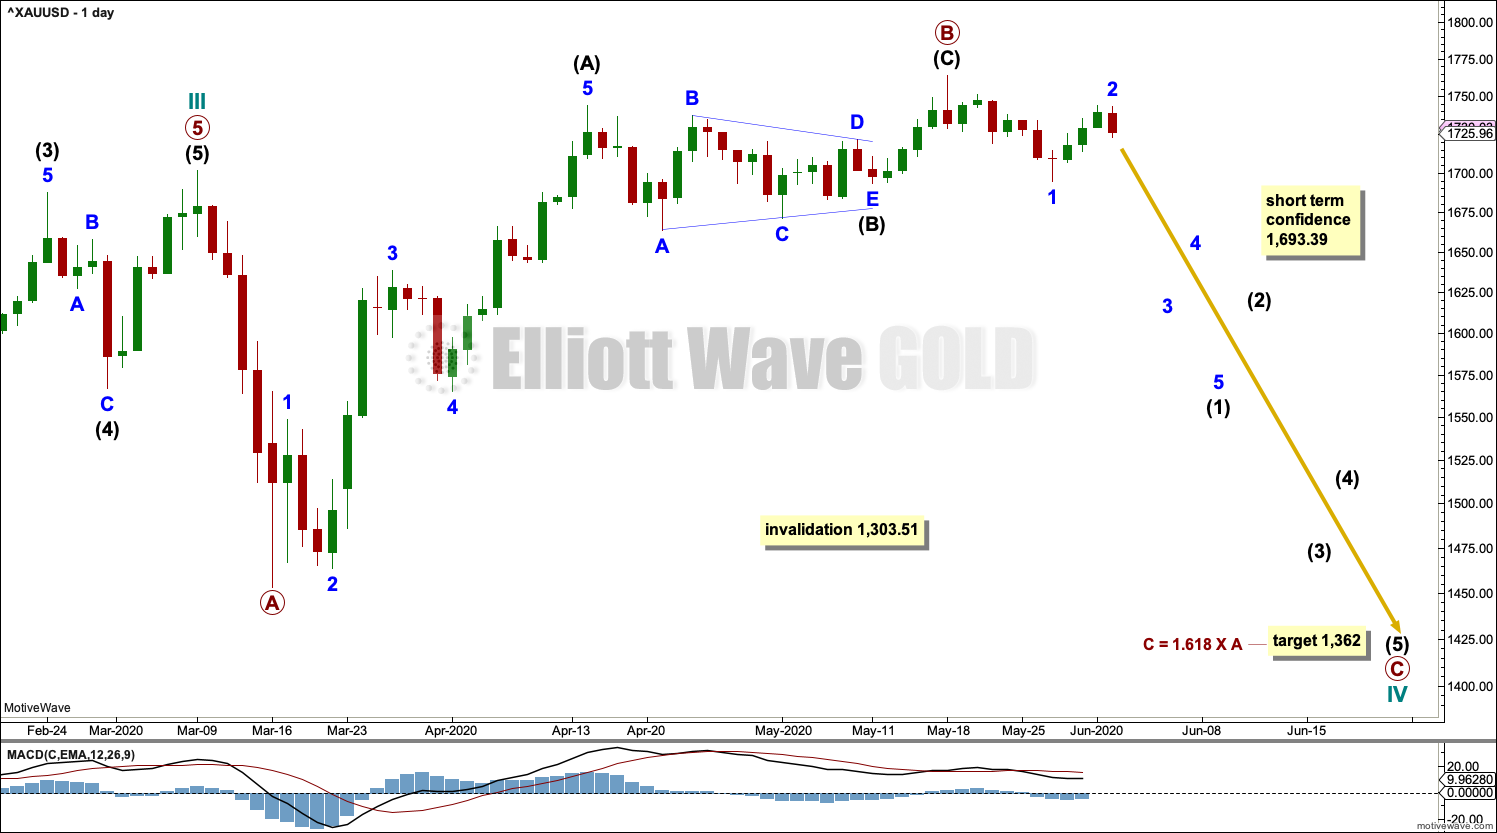
Primary wave C within cycle wave y may be an incomplete five wave impulse. Intermediate waves (1) through to (4) within primary wave C may be complete.
The point in time at which an Elliott wave triangle’s trend lines cross over is sometimes when a trend change occurs; that may now be on Thursday, June 4th. Extend the triangle trend lines from intermediate wave (4) outwards. A trend change may occur on Thursday to either down or sideways.
Intermediate wave (5) must subdivide as a five wave structure upwards. Minor wave 1 within intermediate wave (5) may be complete. Minor wave 2 may not move beyond the start of minor wave 1 below 1,693.39.
A new high above 1,764.12 would invalidate the alternate hourly chart below and provide confidence in an upwards trend.
HOURLY CHART
Click chart to enlarge.
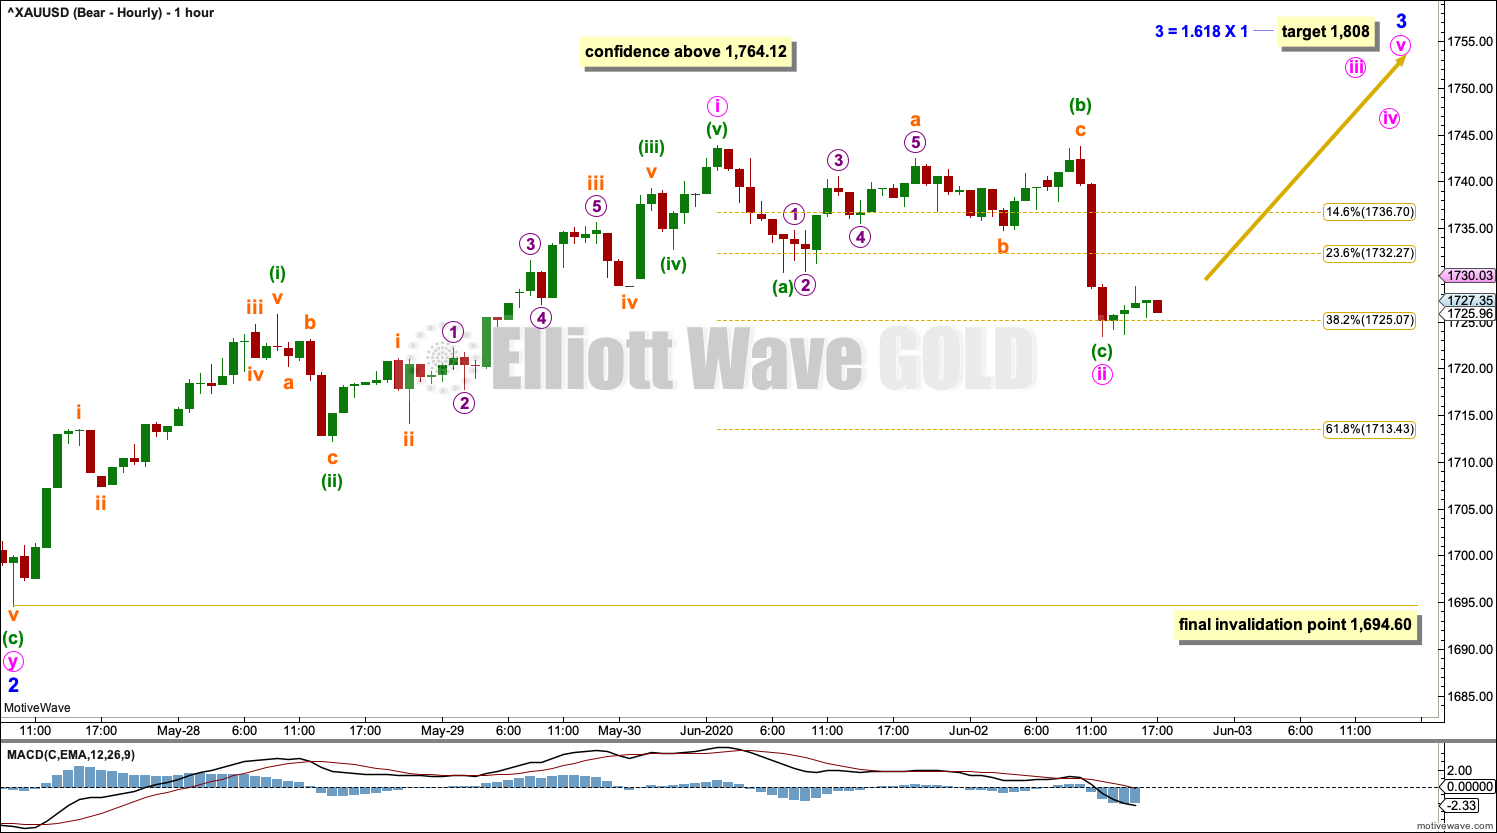
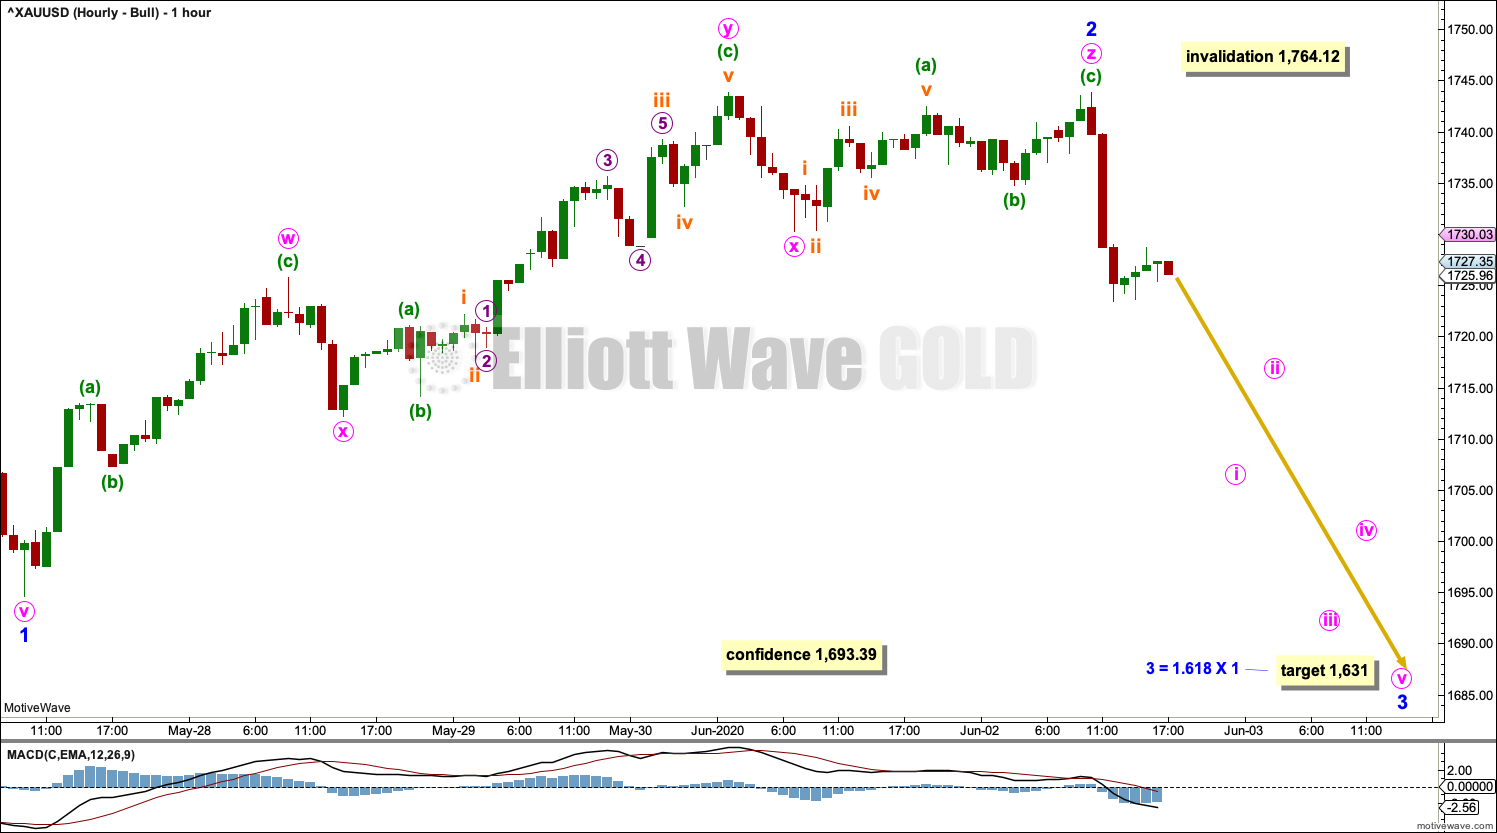
Intermediate wave (5) must subdivide as a five wave motive structure, either an impulse or an ending diagonal. An impulse is much more likely, so that shall be what is expected until and unless overlapping suggests a diagonal.
Minor wave 1 within intermediate wave (5) may be complete.
Minor wave 2 may have continued lower as a double zigzag. Minor wave 3 may now have begun and may only subdivide as an impulse.
Minute wave i and minute wave ii within minor wave 3 may be complete. Minute wave ii may be a complete regular flat correction ending close to the 0.382 Fibonacci ratio of minute wave i.
If minute wave ii continues further as a double flat or double combination, then it may not move beyond the start of minute wave i below 1,694.60.
ALTERNATE HOURLY CHART
Click chart to enlarge.
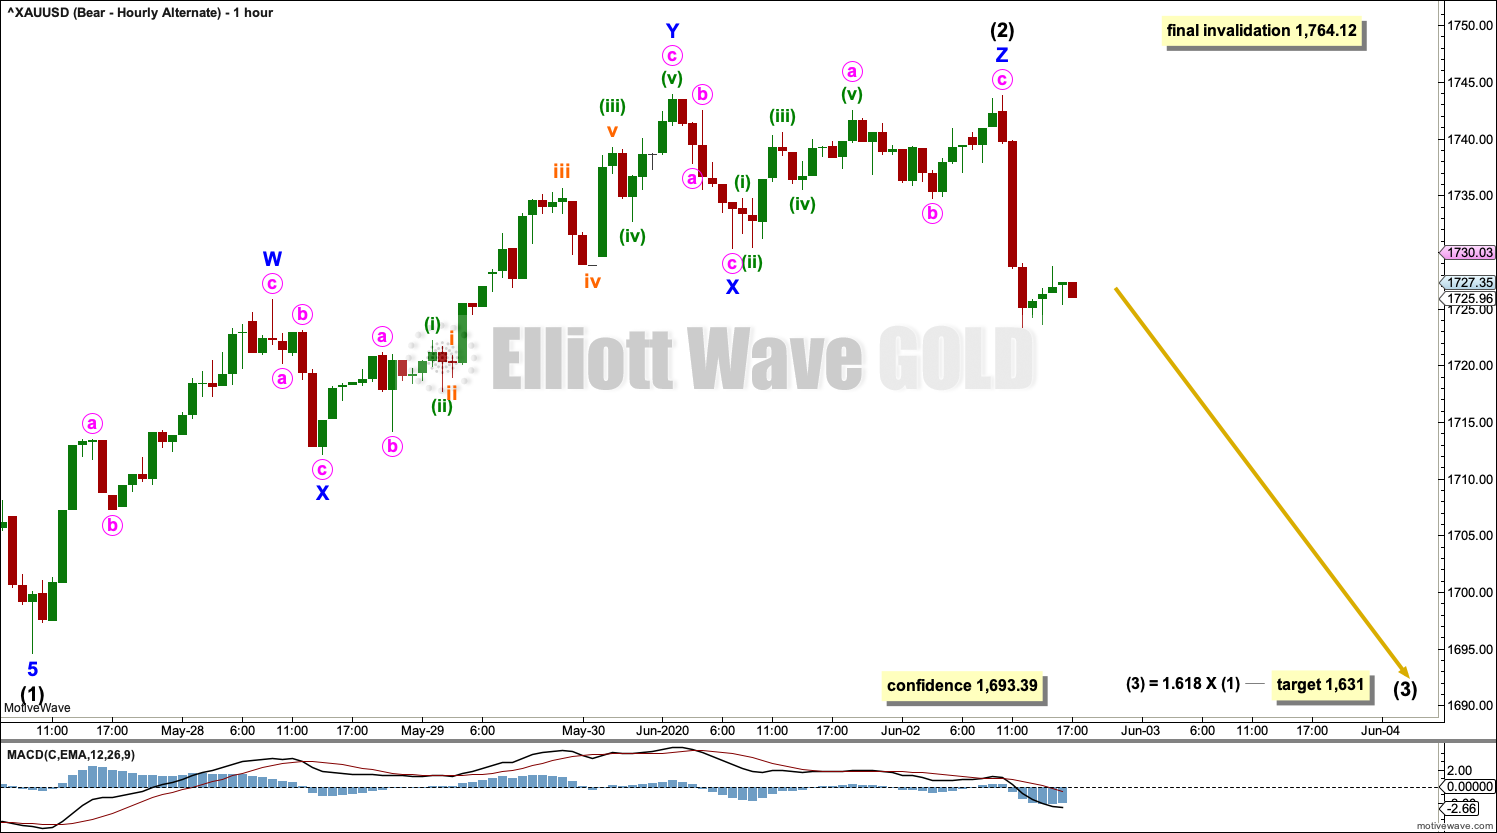
It is again possible that Super Cycle wave (b) may be complete. This wave count requires a new low below 1,693.39 for initial confidence. Further downwards movement and a new low below 1,453.26 would add substantial confidence.
If intermediate wave (5) is complete at the last high, then a new downwards trend to new lows may have just begun. This new downwards trend would be labelled Super Cycle wave (c) at higher time frames.
A first five wave structure downwards may now be complete. It is labelled intermediate wave (1).
Intermediate wave (2) may have continued very slightly higher as a triple zigzag.
Intermediate wave (2) may not move beyond the start of intermediate wave (1) above 1,764.12.
ALTERNATE BULLISH ELLIOTT WAVE COUNT
WEEKLY CHART
Click chart to enlarge.
This wave count sees the the bear market complete at the last major low for Gold on 3 December 2015.
If Gold is in a new bull market, then it should begin with a five wave structure upwards on the weekly chart.
Cycle wave I fits as a five wave impulse with reasonably proportionate corrections for primary waves 2 and 4.
Cycle wave II fits as a double flat. However, within the first flat correction labelled primary wave W, this wave count needs to ignore what looks like an obvious triangle from July to September 2016 (this can be seen labelled as a triangle on the bear wave count above). This movement must be labelled as a series of overlapping first and second waves. Ignoring this triangle reduces the probability of this wave count in Elliott wave terms.
Within the first flat correction labelled primary wave W of the double flat of cycle wave II, intermediate wave (B) is 1.69 the length of intermediate wave (A). This is longer than the common range of up to 1.38, but within an allowable guideline of up to 2. The length of intermediate wave (B) reduces the probability of this wave count.
Cycle wave III may be complete. Cycle wave IV may not move into cycle wave I price territory below 1,303.51.
DAILY CHART
Click chart to enlarge.
Cycle wave IV may be an incomplete expanded flat correction. Primary wave A within the flat correction may have subdivided as a zigzag. Primary wave B may now be a complete zigzag. Primary wave B would be a 1.25 length of primary wave A. This is within the normal range for primary wave B within a flat from 1 to 1.38 times the length of primary wave A.
A target is calculated for primary wave C to end based upon the most common Fibonacci ratio to primary wave A within an expanded flat. Primary wave C must subdivide as a five wave motive structure.
It is also possible that primary wave B could continue higher as a double zigzag. The common range of primary wave B would extend up to 1.38 times the length of primary wave A at 1,795.98. A maximum allowable guideline for primary wave B would be up to 2 times the length of primary wave A at 1,949.96. There is no Elliott wave rule stating a limit for B waves within expanded flat corrections, so there is no rule which may be used to determine an upper invalidation point for this wave count.
HOURLY CHART
Click chart to enlarge.
Primary wave C must subdivide as a five wave motive structure, either an impulse or an ending diagonal. An impulse is more common, so that is what shall be expected.
Minor wave 1 within the new downwards trend may be complete. Minor wave 2 may have continued very slightly higher as a triple zigzag. If minor wave 2 continues higher, then it may not move beyond the start of minor wave 1 above 1,764.12.
TECHNICAL ANALYSIS
WEEKLY CHART
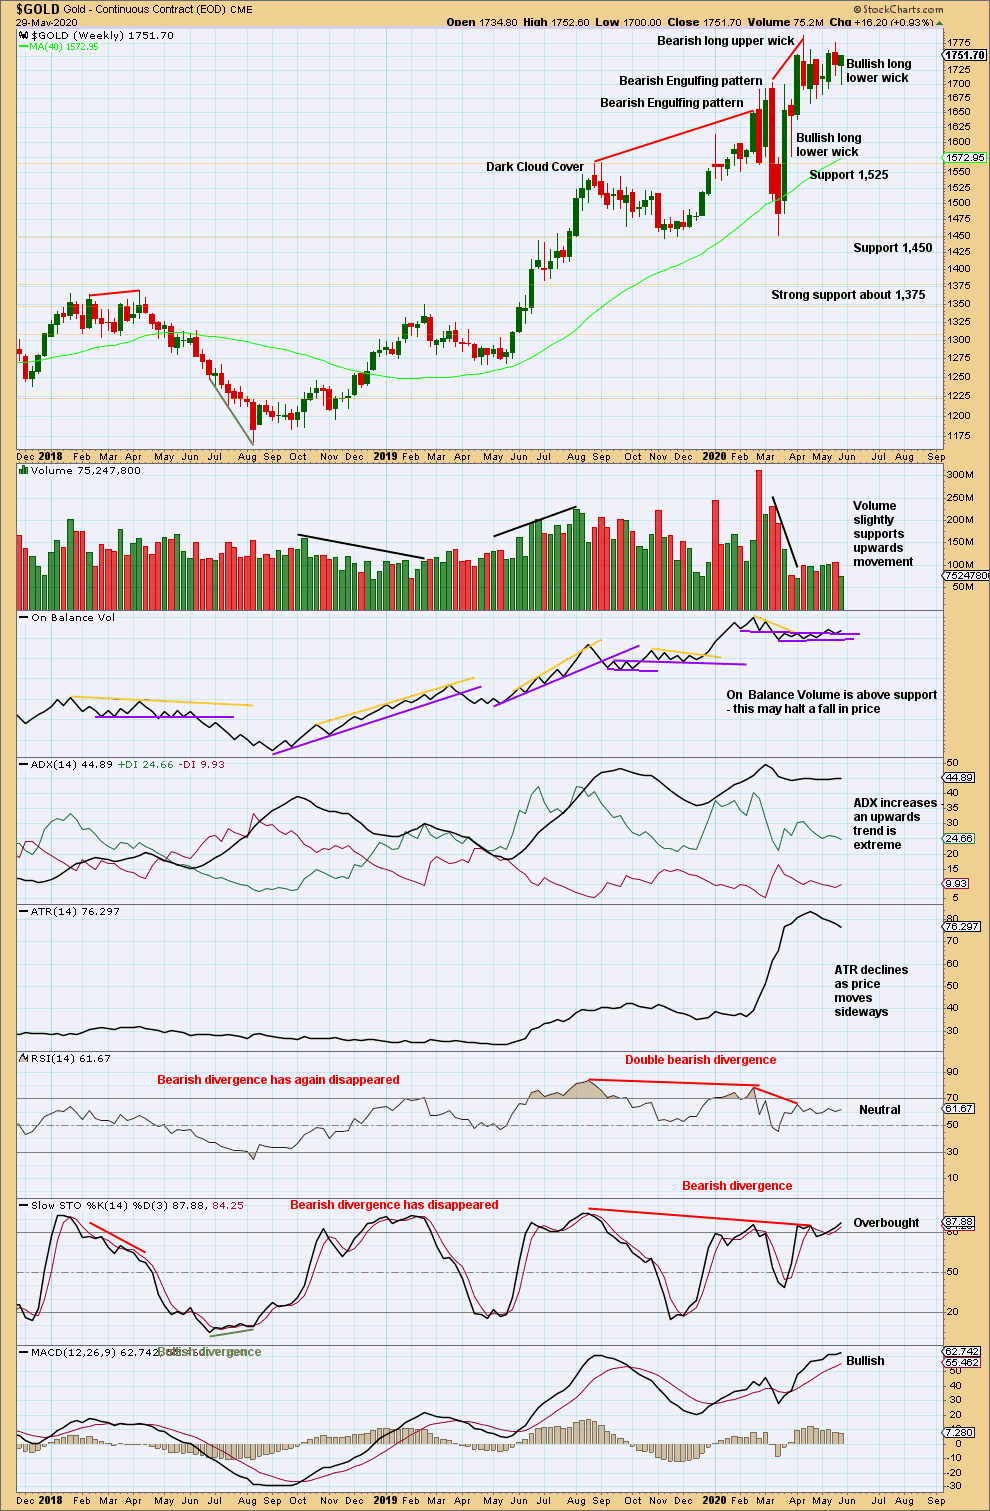
Click chart to enlarge. Chart courtesy of StockCharts.com.
The upwards trend remains extreme. RSI is not yet overbought; there is room for an upwards trend to continue.
DAILY CHART
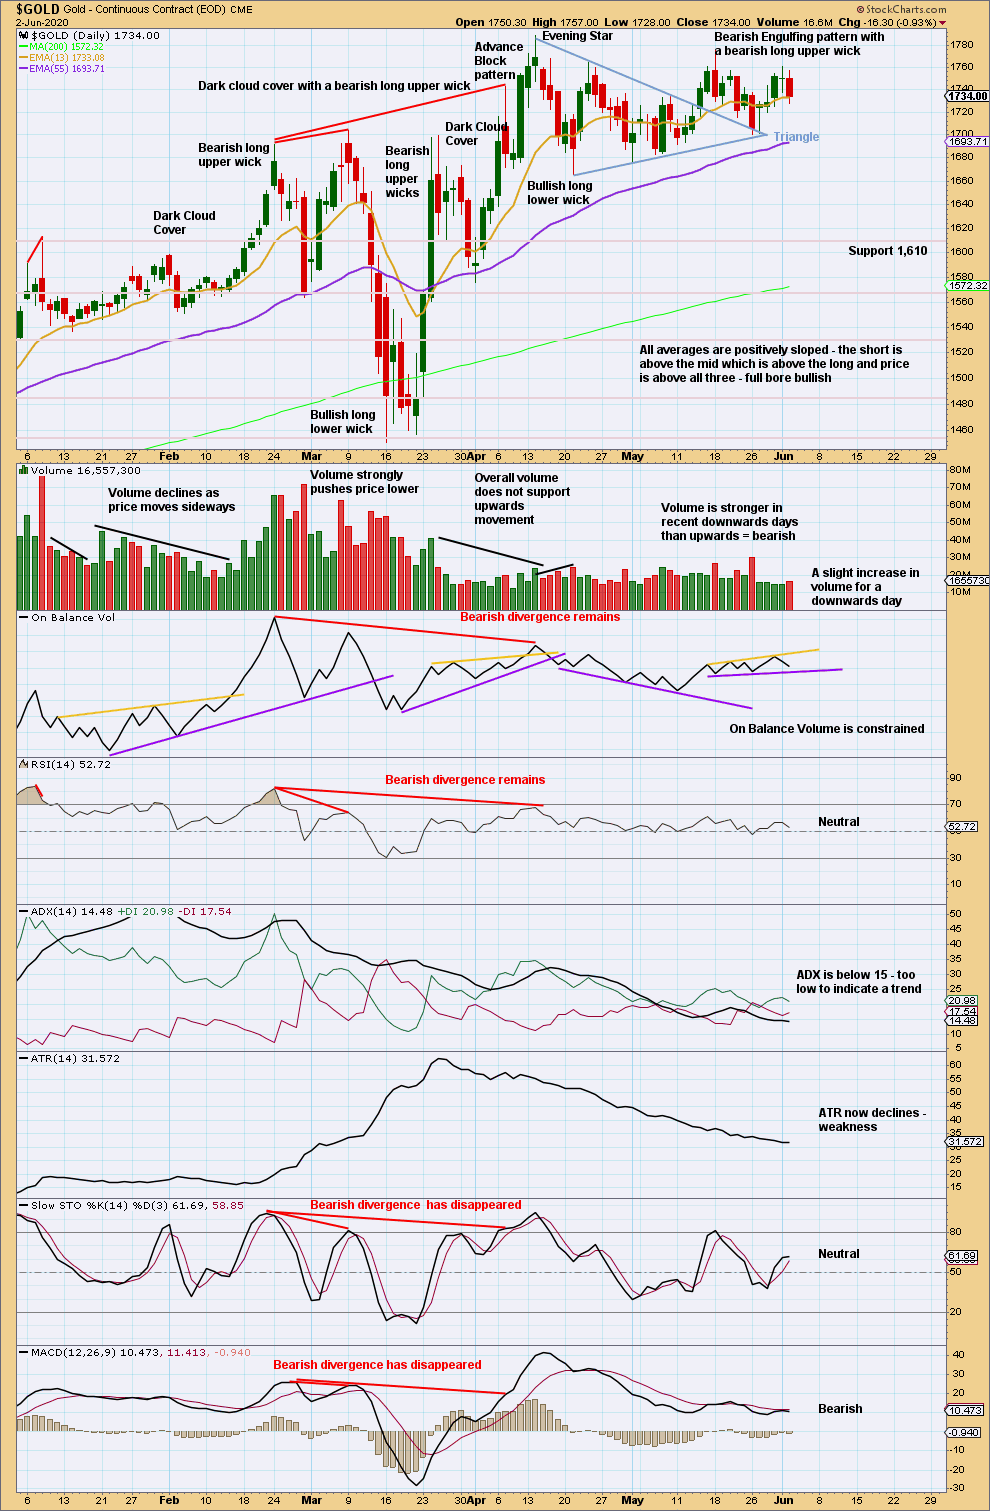
Click chart to enlarge. Chart courtesy of StockCharts.com.
A close below the upper triangle trend line after a breakout that did not have good support from volume suggests a target calculated from the triangle may not be met. With a bearish reversal pattern having support from volume, the risk that price has changed trend here is high.
The short-term volume profile remains bearish. Both price and On Balance Volume are range bound.
GDX WEEKLY CHART
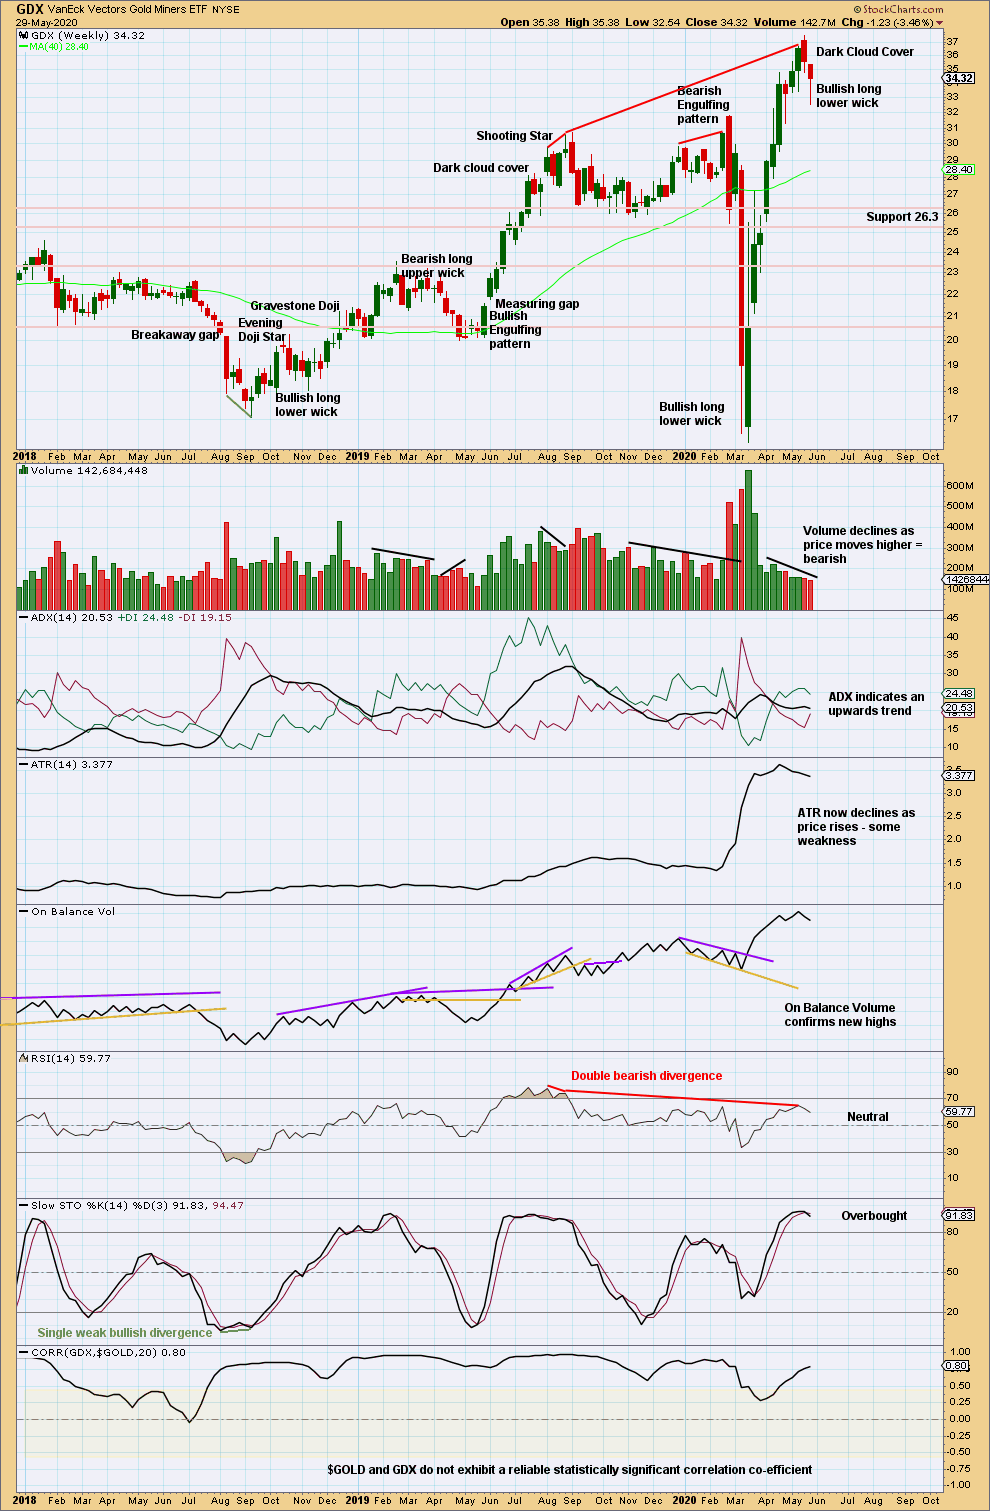
Click chart to enlarge. Chart courtesy of StockCharts.com.
Dark Cloud Cover is a bearish candlestick reversal pattern, but not the strongest reversal pattern (which are Engulfing patterns). With this pattern now followed by a candlestick with a bullish long lower wick, the trend change indicated by Dark Cloud Cover may have been brief.
GDX DAILY CHART
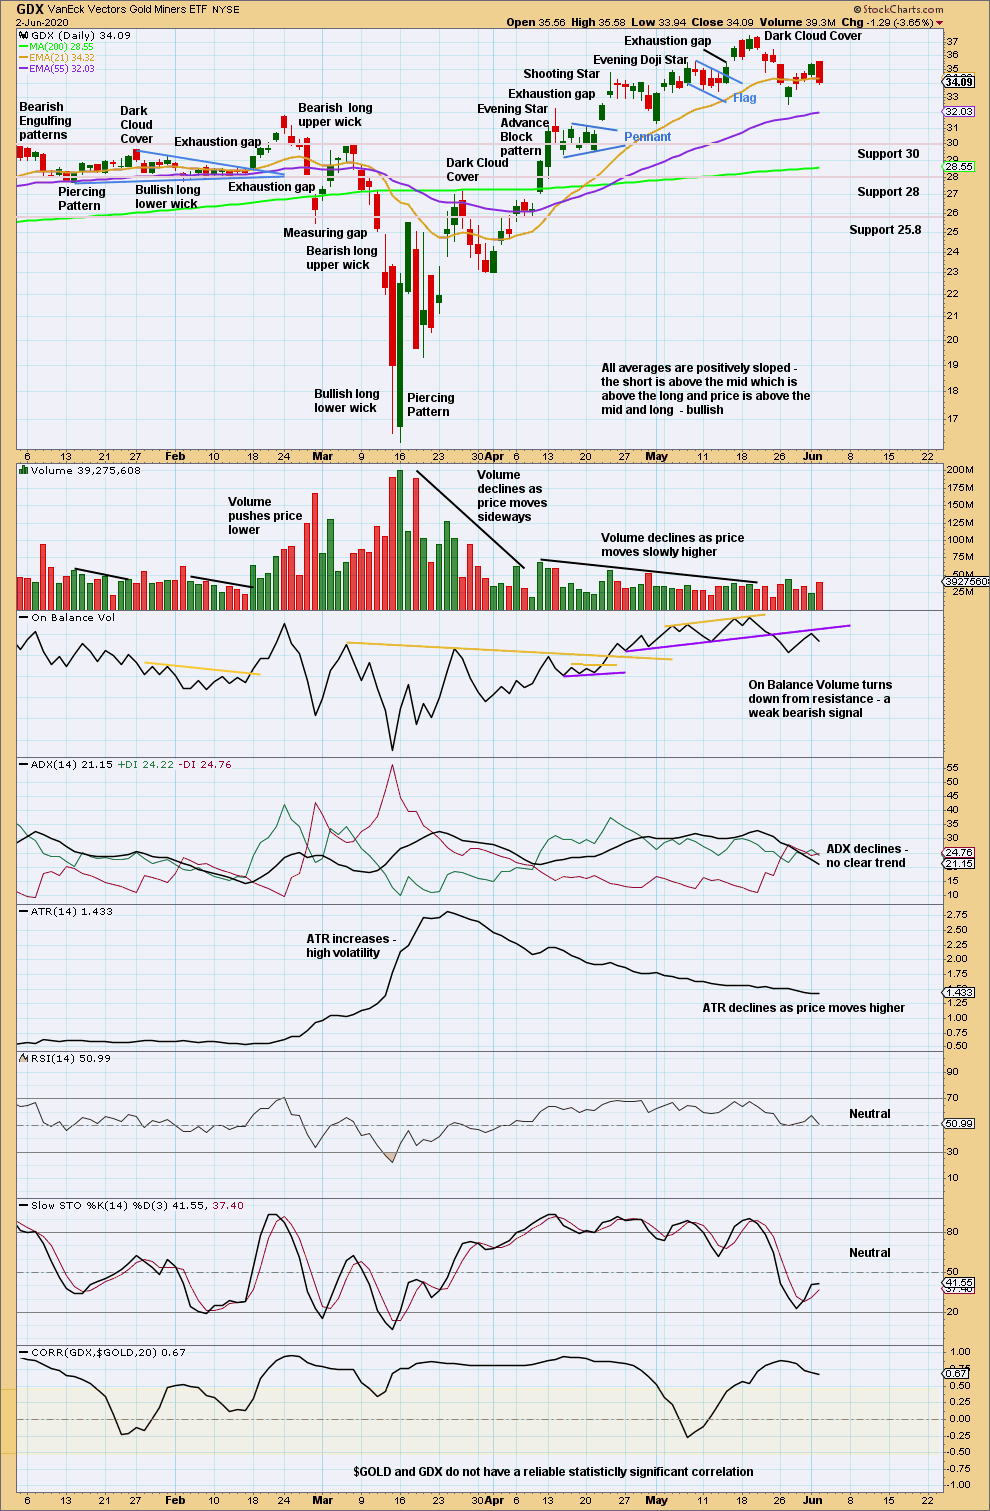
Click chart to enlarge. Chart courtesy of StockCharts.com.
The prior upwards trend reached extreme, but not very extreme. The last gap is closed, but a new swing low below 31.31 has not yet been seen. There is risk here that GDX may have seen a trend change from up to either down or a multi-week sideways consolidation.
Today was a strong downwards day that has some support from volume. It is not considered a Bearish Engulfing pattern because price is moving sideways. A reversal pattern need something to reverse, so it should only be considered in the context of a trend.
Published @ 07:40 p.m. EST.
—
Careful risk management protects your trading account(s).
Follow my two Golden Rules:
1. Always trade with stops.
2. Risk only 1-5% of equity on any one trade.
—
New updates to this analysis are in bold.