
GOLD: Elliott Wave and Technical Analysis | Charts – July 7, 2020
Today price has closed above resistance on an upwards day, which has some support from volume. This effects an upwards breakout, which is what the main Elliott wave count has expected.
Summary: The upwards trend remains intact. The next target is at 1,820 or 1,980.
Grand SuperCycle analysis is here.
Monthly charts were last updated here.
MAIN BEARISH ELLIOTT WAVE COUNT
WEEKLY CHART
Click chart to enlarge.
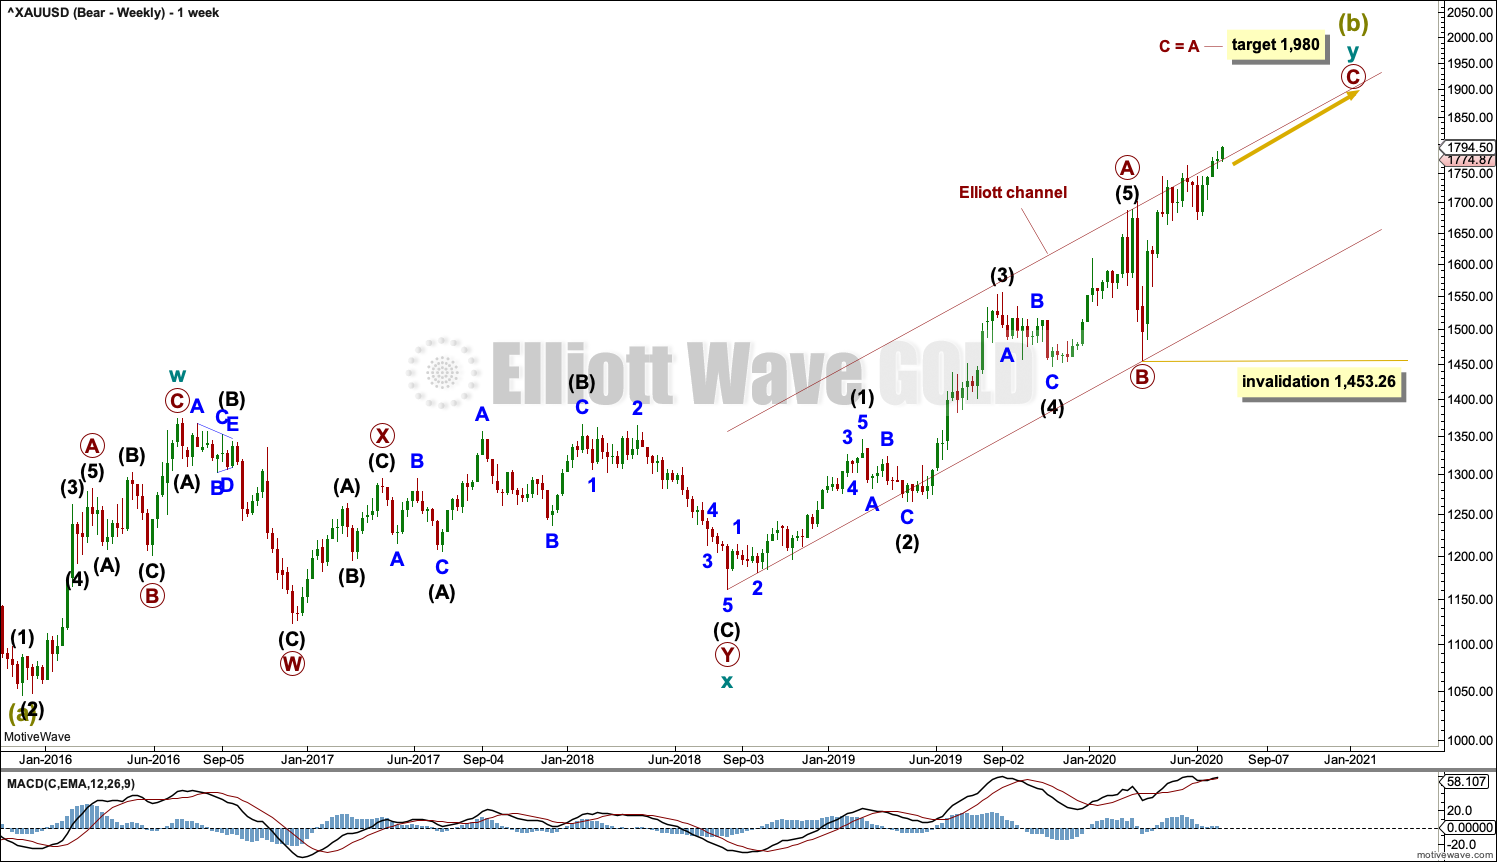
The bigger picture for this main bearish Elliott wave count sees Gold as still within a bear market, in a three steps back pattern that is labelled Grand Super Cycle wave IV on monthly charts.
Super Cycle wave (b) within Grand Super Cycle wave IV may be an incomplete double zigzag. When Super Cycle wave (b) may be complete, then this wave count expects Super Cycle wave (c) to begin and to move price below the end of Super Cycle wave (a) at 1,046.27.
The first zigzag in the double is labelled cycle wave w. The double is joined by a three in the opposite direction, a combination labelled cycle wave x. The second zigzag in the double is labelled cycle wave y.
The purpose of the second zigzag in a double is to deepen the correction. Cycle wave y has achieved this purpose.
We should always assume the trend remains the same until proven otherwise. At this stage, Gold is in a bull market for the mid term.
DAILY CHART
Click chart to enlarge.
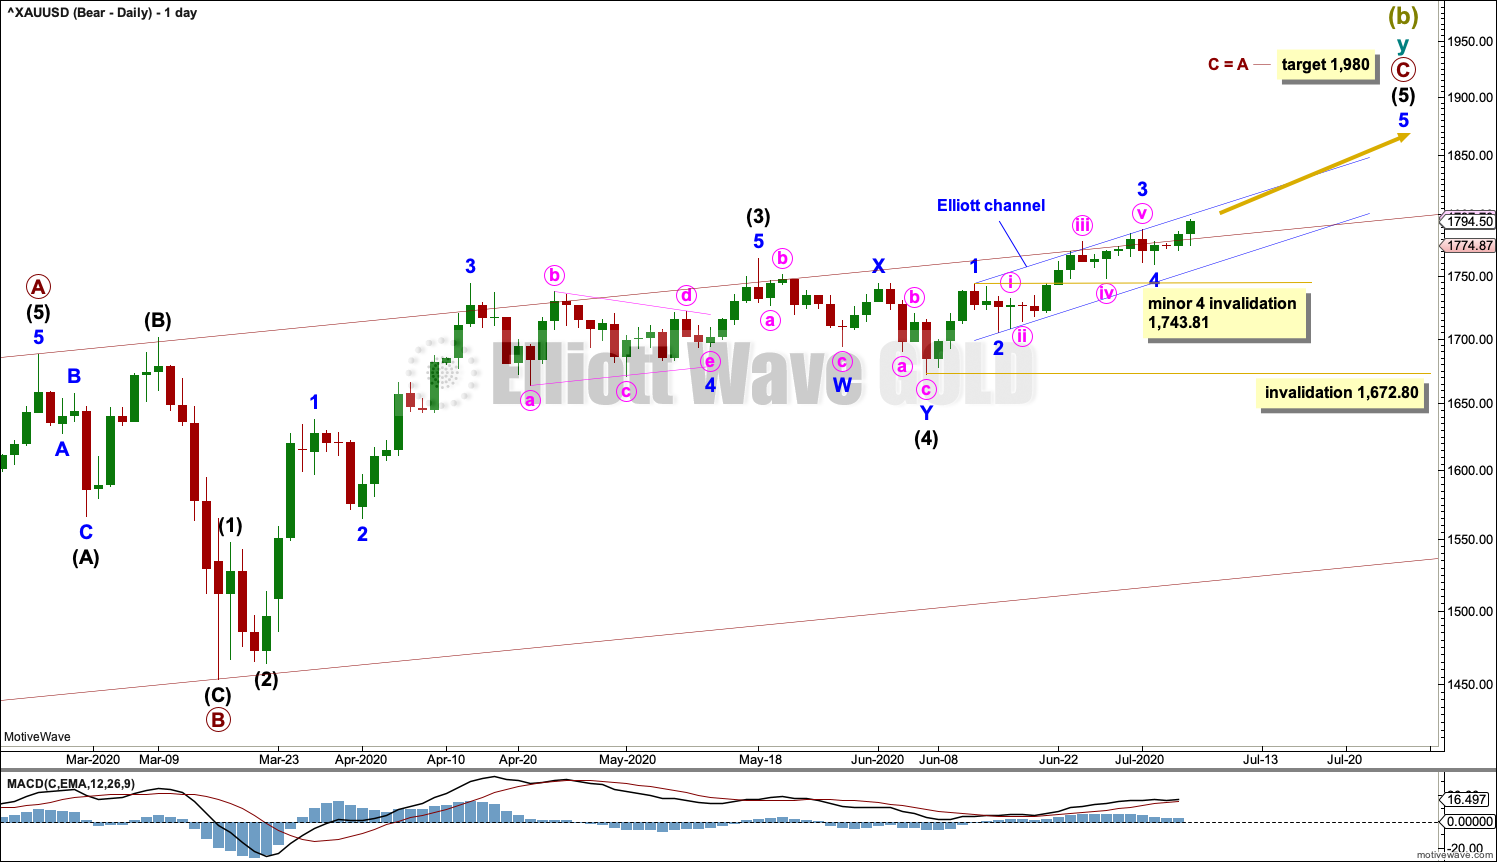
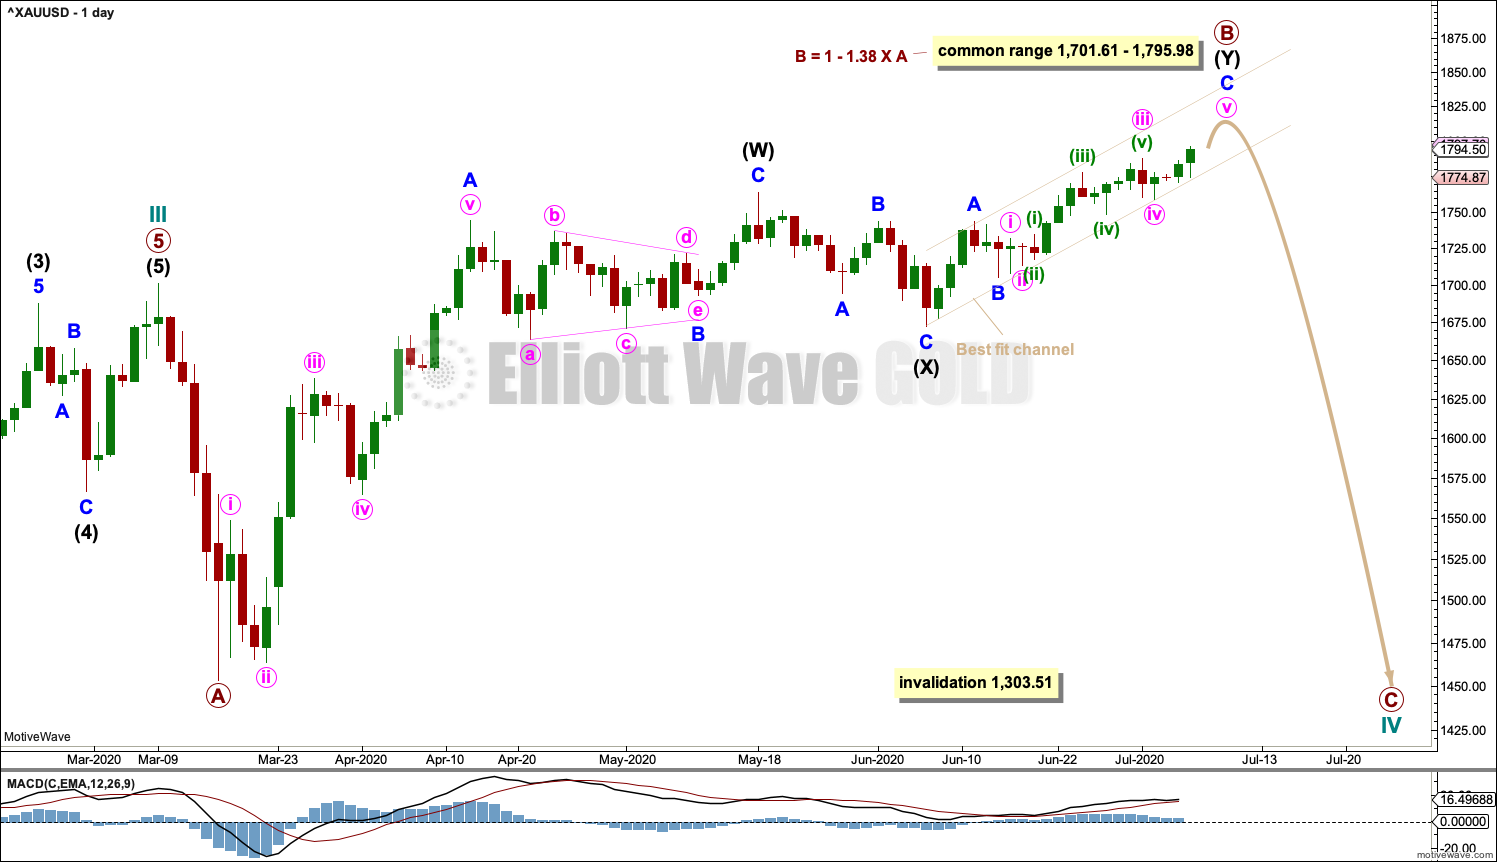
Primary wave C may be an incomplete five wave impulse.
Within the impulse: intermediate waves (1) through to (3) may be complete and intermediate wave (4) may be a double zigzag. No second wave correction within intermediate wave (5) may move beyond its start below 1,672.80.
Minor waves 1 through to 4 within intermediate wave (5) may now be complete. If it is yet to arrive, then minor wave 4 may not move into minor wave 1 price territory below 1,743.81.
It is also possible to move the degree of labelling within intermediate wave (5) all down one degree. If minor wave 1 only is nearing an end, then minor wave 2 may not move beyond its start below 1,672.60.
Redraw the channel about intermediate wave (5) using Elliott’s technique: draw the first trend line from the ends of minor waves 1 to 3, then place a parallel copy on the end of minor wave 2. The strongest portion of minute wave iii within minor wave 3 slightly overshoots the channel, which is typical. The lower edge of this channel may provide support for pullbacks along the way up.
HOURLY CHART
Click chart to enlarge.
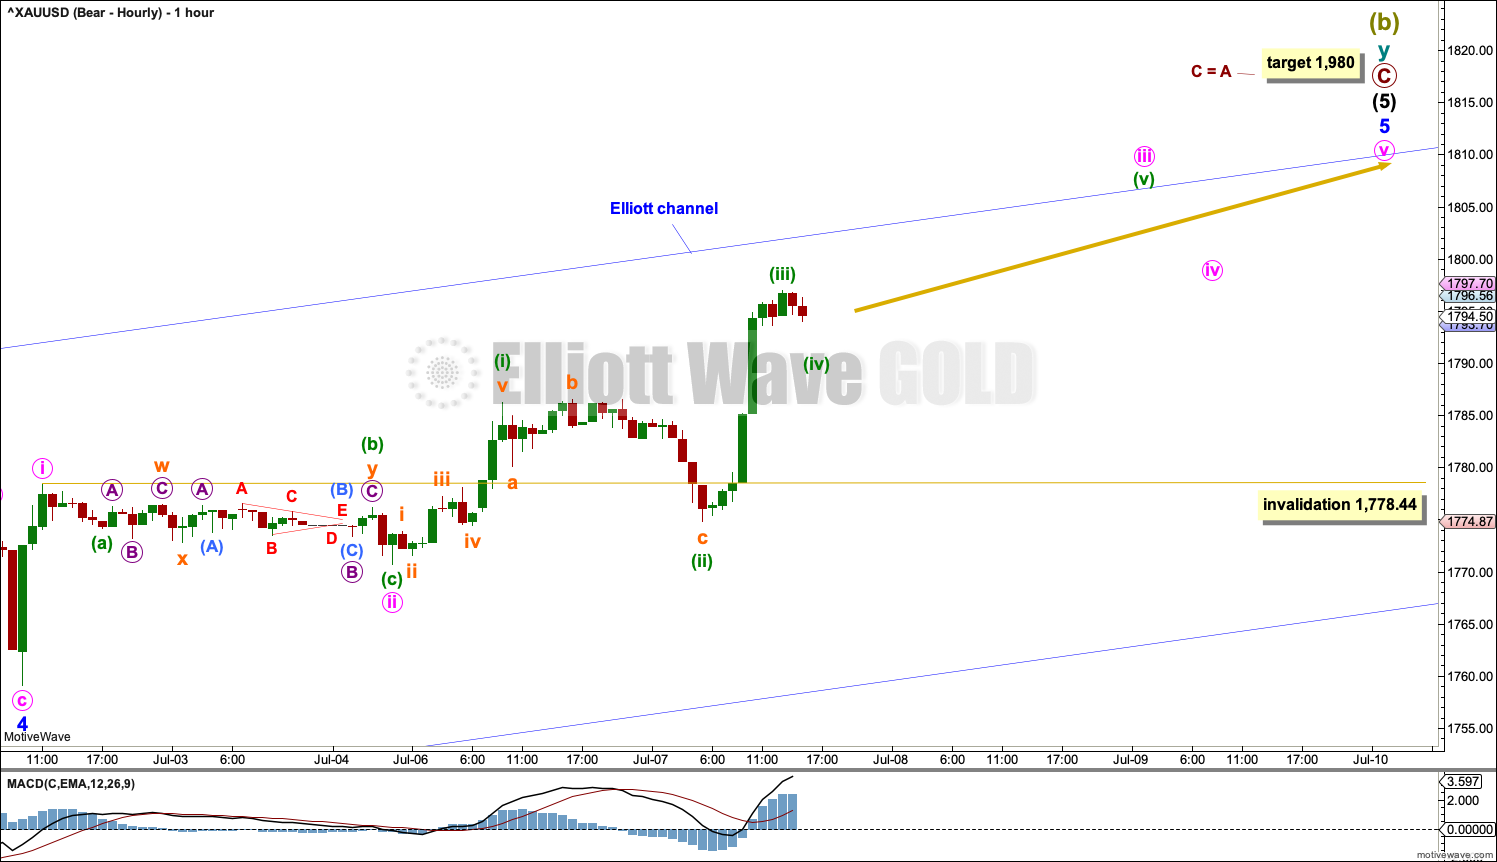
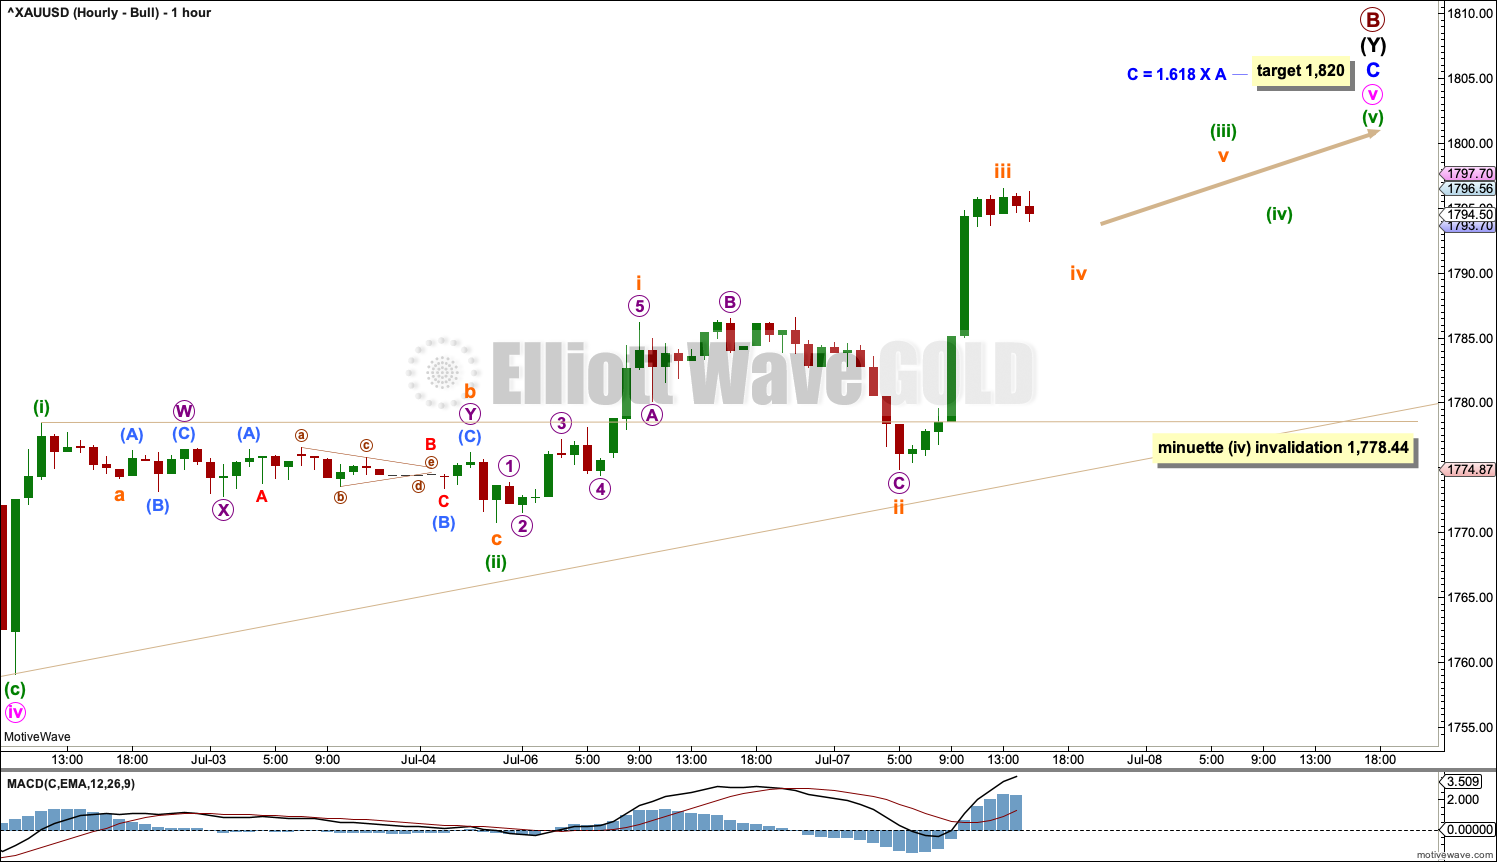
The hourly chart now shows the end of minor wave 4 and all of minor wave 5 so far.
Minor wave 5 may be unfolding as an impulse. Minute wave iii within minor wave 5 may only subdivide as an impulse. Minute wave iv may not move into minute wave i price territory below 1,778.44.
The target remains the same and expects minor wave 5 to be extended.
ALTERNATE BEARISH ELLIOTT WAVE COUNT
This alternate wave count is today invalidated with a new high above 1,787.97, so it is discarded.
ALTERNATE BULLISH ELLIOTT WAVE COUNT
WEEKLY CHART
Click chart to enlarge.
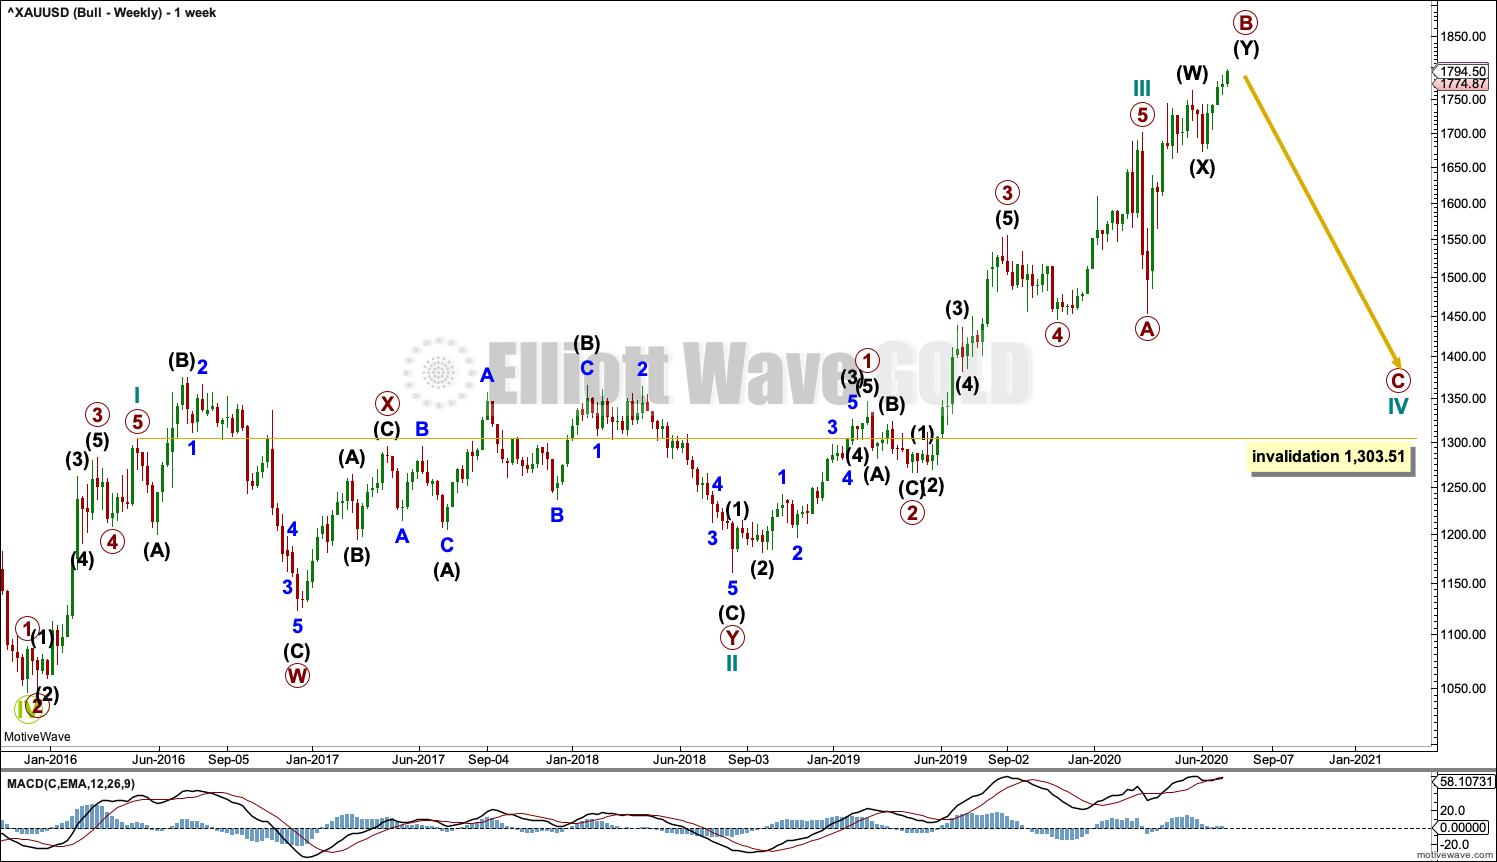
This wave count sees the the bear market complete at the last major low for Gold on 3 December 2015.
If Gold is in a new bull market, then it should begin with a five wave structure upwards on the weekly chart.
Cycle wave I fits as a five wave impulse with reasonably proportionate corrections for primary waves 2 and 4.
Cycle wave II fits as a double flat. However, within the first flat correction labelled primary wave W, this wave count needs to ignore what looks like an obvious triangle from July to September 2016 (this can be seen labelled as a triangle on the bear wave count above). This movement must be labelled as a series of overlapping first and second waves. Ignoring this triangle reduces the probability of this wave count in Elliott wave terms.
Within the first flat correction labelled primary wave W of the double flat of cycle wave II, intermediate wave (B) is 1.69 the length of intermediate wave (A). This is longer than the common range of up to 1.38, but within an allowable guideline of up to 2. The length of intermediate wave (B) reduces the probability of this wave count.
Cycle wave III may be complete. Cycle wave IV may not move into cycle wave I price territory below 1,303.51.
DAILY CHART
Click chart to enlarge.
Cycle wave IV may be an incomplete expanded flat correction. Primary wave A within the flat correction may have subdivided as a zigzag. Primary wave B may be continuing higher as a double zigzag.
The common range of primary wave B would extend up to 1.38 times the length of primary wave A at 1,795.98. A maximum allowable guideline for primary wave B would be up to 2 times the length of primary wave A at 1,949.96. There is no Elliott wave rule stating a limit for B waves within expanded flat corrections, so there is no rule which may be used to determine an upper invalidation point for this wave count.
If primary wave B is complete at the last high, then it would be 1.35 times the length of primary wave A, which is within the most common range.
The best fit channel about intermediate wave (Y) is today slightly adjusted to contain recent lows. Copy the channel over to the hourly chart. Assume upwards movement may continue while price remains within the channel. If the channel is breached, then assume intermediate wave (Y) may be over.
HOURLY CHART
Click chart to enlarge.
Both wave counts now see an impulse continuing higher. Targets are different and the degree of labelling is different.
TECHNICAL ANALYSIS
WEEKLY CHART
Click chart to enlarge. Chart courtesy of StockCharts.com.
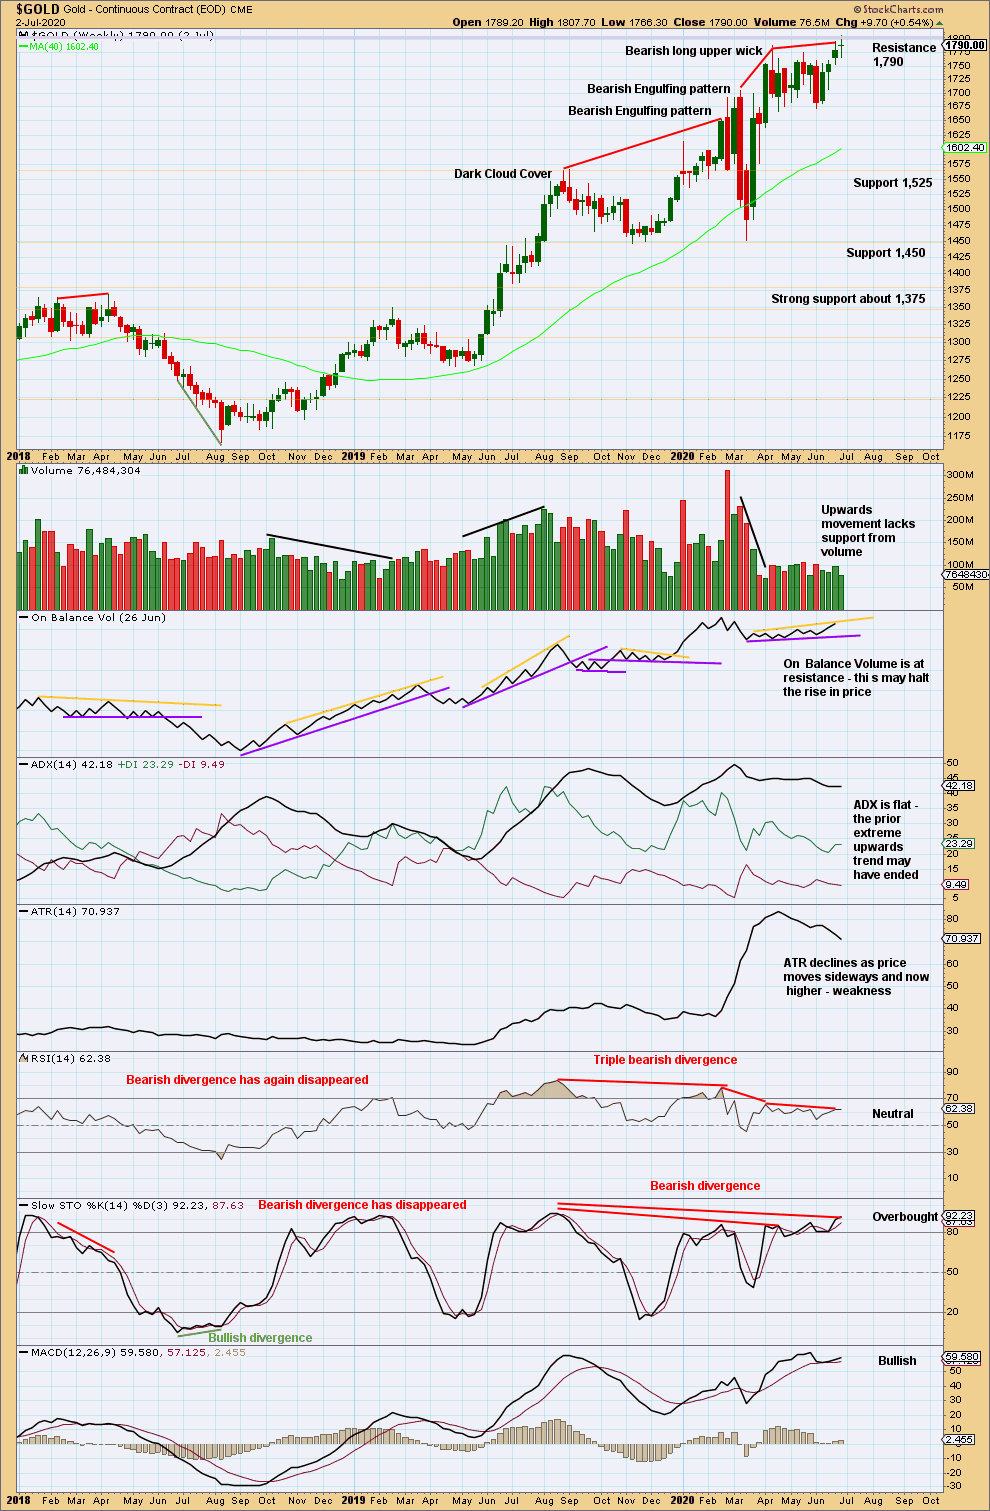
Price remains within a consolidation with support about 1,665 to 1,680.
There is now strong triple bearish divergence between price and RSI. This supports either the alternate bearish Elliott wave count or the bullish Elliott wave count.
DAILY CHART
Click chart to enlarge. Chart courtesy of StockCharts.com.
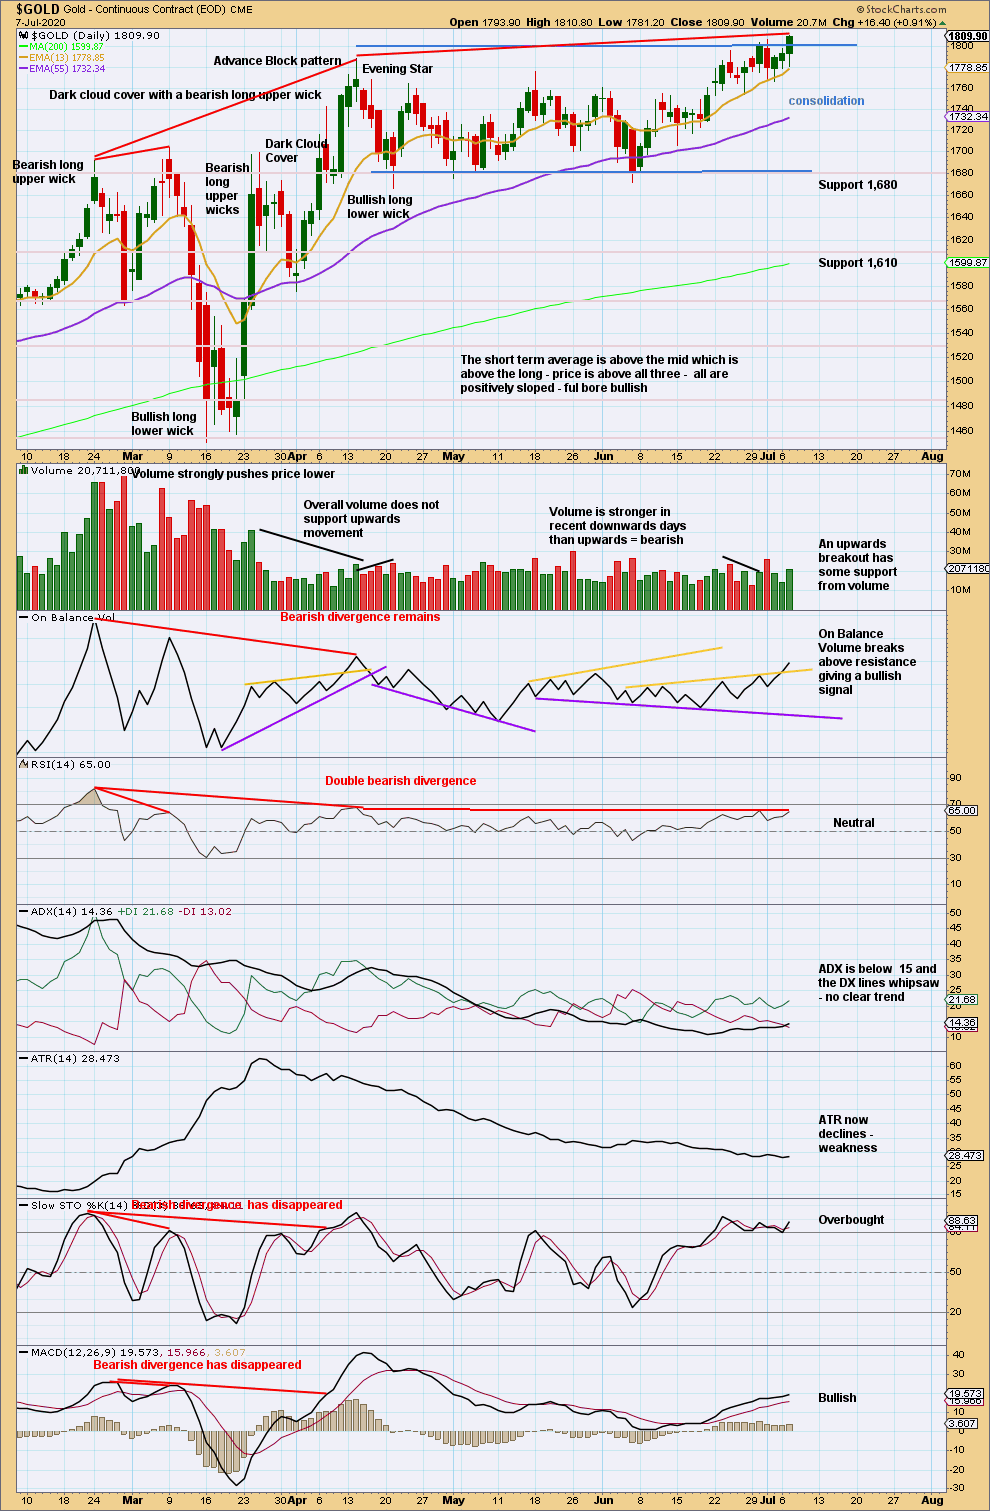
The consolidation zone spans from resistance about 1,800 to support about 1,680.
Today has effected an upwards breakout, which has some support from volume. Price has closed above resistance. The close is almost at the high for the session and the candlestick has a long lower wick, so more upwards movement may be expected tomorrow. A target calculated from the width of the consolidation is at 1,930.
GDX WEEKLY CHART
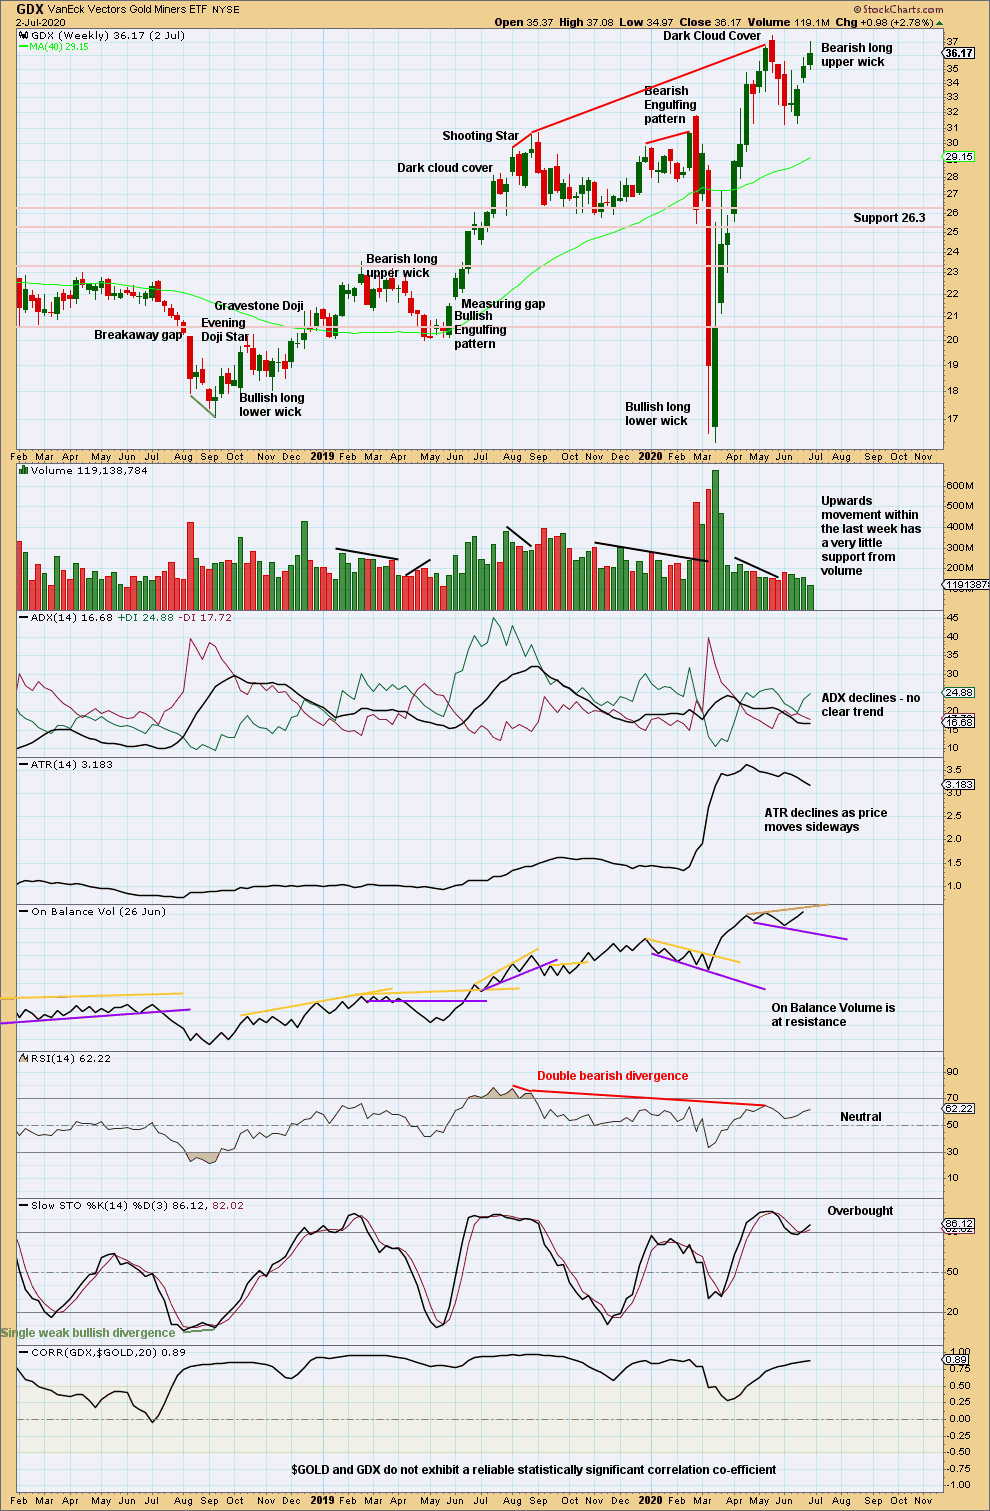
Click chart to enlarge. Chart courtesy of StockCharts.com.
Overall, range and volume are declining as price moves higher. Price is range bound.
GDX DAILY CHART
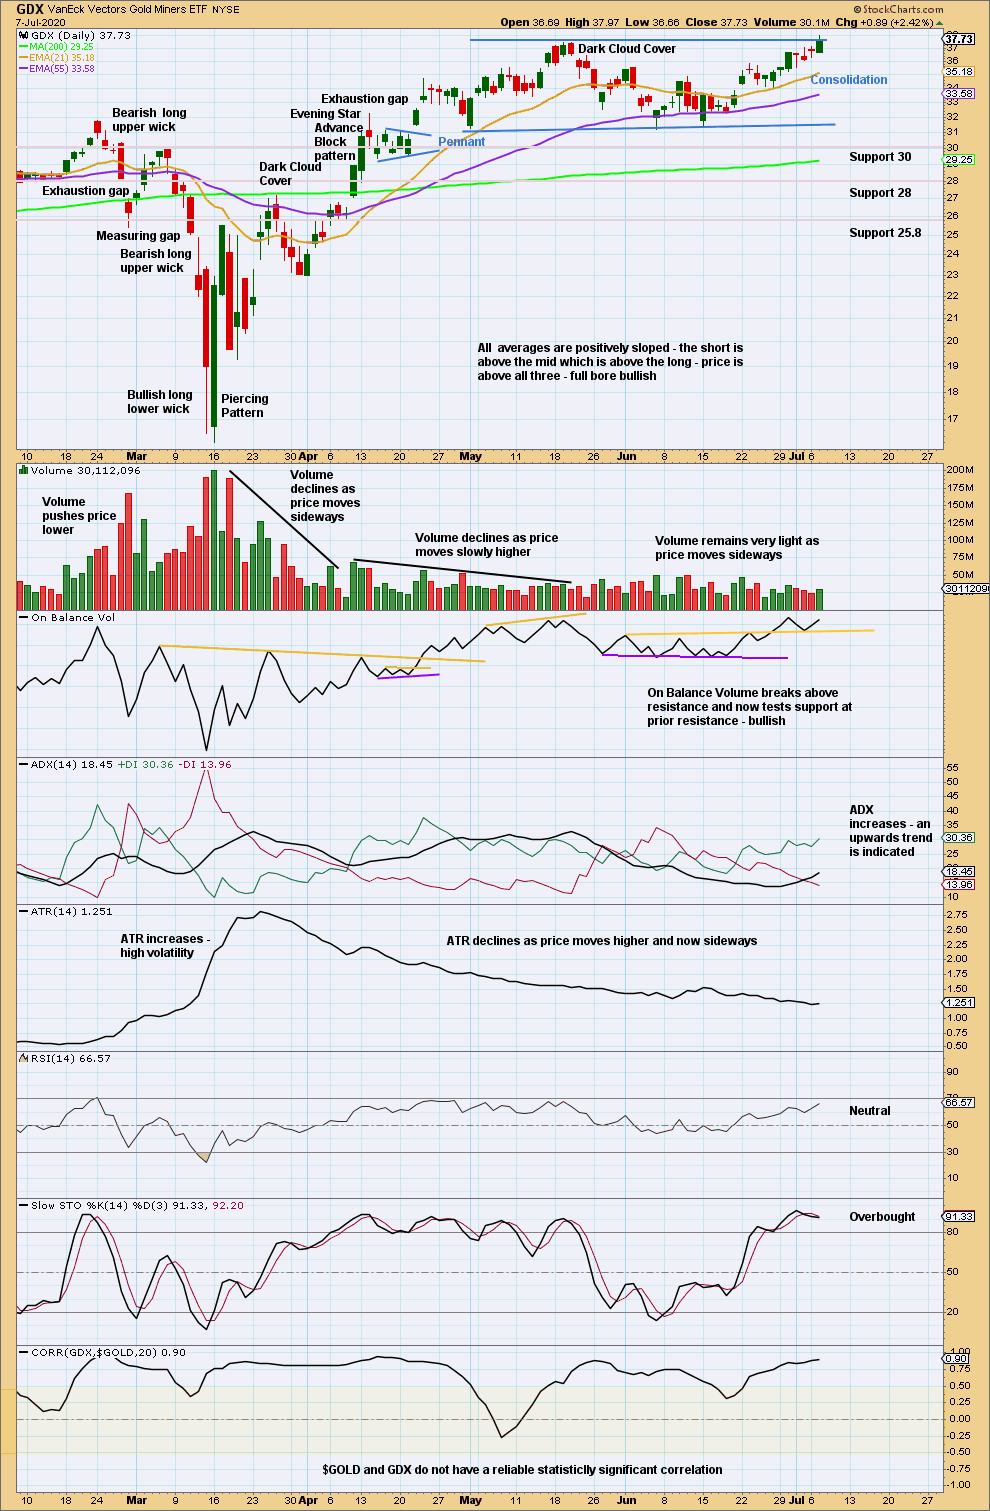
Click chart to enlarge. Chart courtesy of StockCharts.com.
Price is range bound with resistance about 35.55 to 37.50 and support about 31.20 to 31.30. A breakout of this range is required before having confidence in a trend. An upwards breakout should have support from volume for confidence. Today price has not closed above resistance. For GDX there is still no breakout.
If price does break out upwards, then a target would be at 43.82.
On Balance Volume has given bullish signals suggesting an upwards breakout may come soon.
Published @ 07:11 p.m. ET.
—
Careful risk management protects your trading account(s).
Follow my two Golden Rules:
1. Always trade with stops.
2. Risk only 1-5% of equity on any one trade.
—
New updates to this analysis are in bold.