
GOLD: Elliott Wave and Technical Analysis | Charts – July 16, 2020
Price remains above support at prior resistance. Today two specific price points are given to indicate a trend change.
Summary: The upwards trend may still remain intact. The next target is at 1,820 or 1,980.
For the short term, a new low now below 1,792.78 would be a very early indication that there may be a high in place, at least for the short term. A new low below 1,672.80 would indicate a sustainable high in place.
Grand SuperCycle analysis is here.
Monthly charts were last updated here.
MAIN ELLIOTT WAVE COUNT
WEEKLY CHART
Click chart to enlarge.
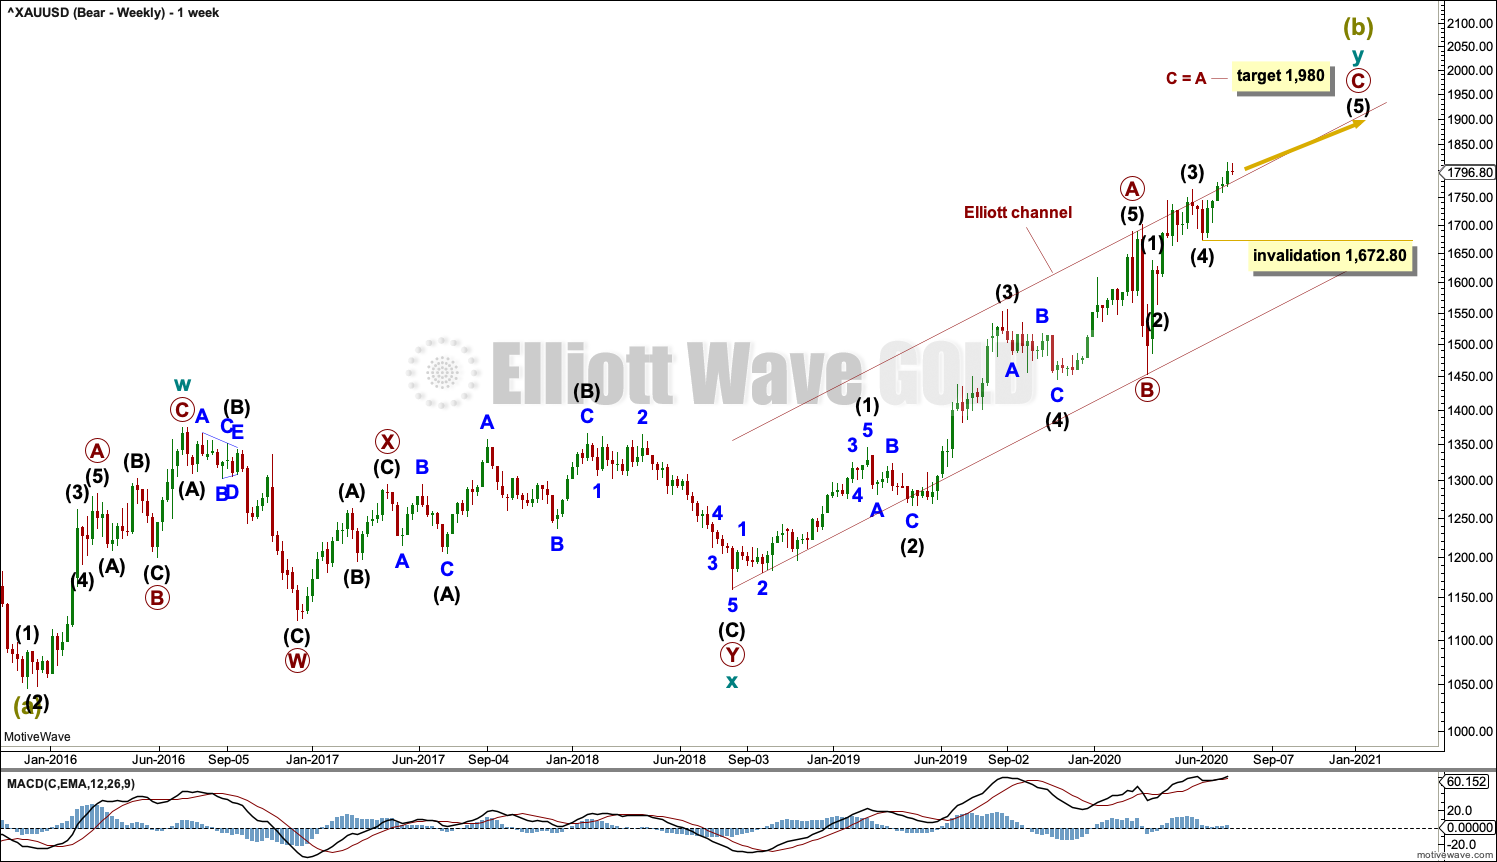
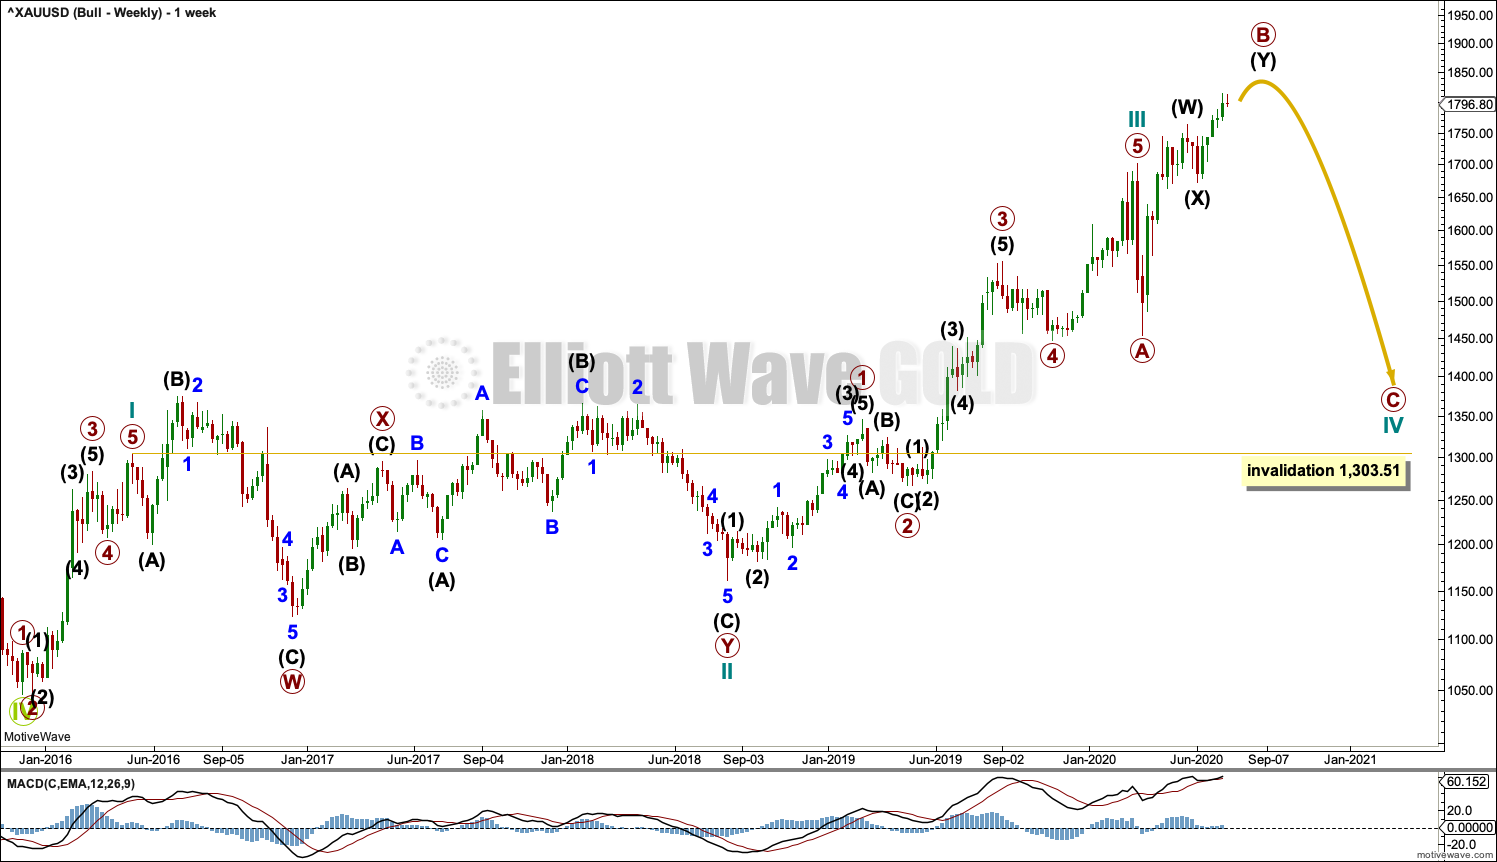
The bigger picture for this main bearish Elliott wave count sees Gold as still within a bear market, in a three steps back pattern that is labelled Grand Super Cycle wave IV on monthly charts.
Super Cycle wave (b) within Grand Super Cycle wave IV may be an incomplete double zigzag. When Super Cycle wave (b) may be complete, then this wave count expects Super Cycle wave (c) to begin and to move price below the end of Super Cycle wave (a) at 1,046.27.
The first zigzag in the double is labelled cycle wave w. The double is joined by a three in the opposite direction, a combination labelled cycle wave x. The second zigzag in the double is labelled cycle wave y.
The purpose of the second zigzag in a double is to deepen the correction. Cycle wave y has achieved this purpose.
No second wave correction within intermediate wave (5) may move beyond its start below 1,672.80.
We should always assume the trend remains the same until proven otherwise. At this stage, Gold is in a bull market for the mid term.
MAIN DAILY CHART
Click chart to enlarge.
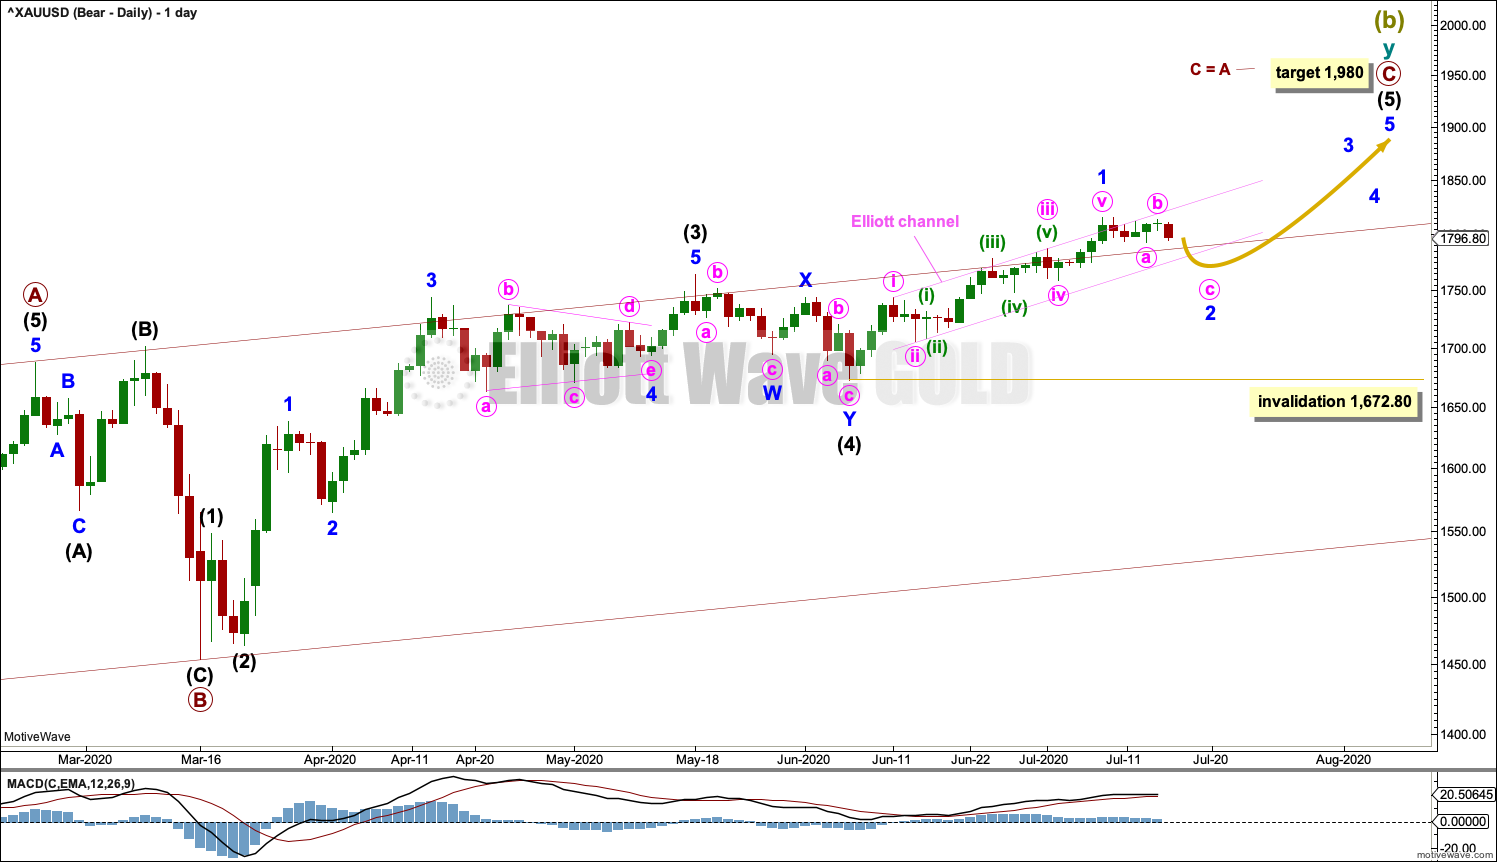
Intermediate wave (5) may extending.
Minor wave 1 within intermediate wave (5) may be complete at the last high. Minor wave 2 may now be nearing completion.
When minor wave 2 may be complete, then the upwards trend may resume with some strength and support from volume for minor wave 3.
Minor wave 2 may not move beyond the start of minor wave 1 below 1,672.80.
HOURLY CHART
Click chart to enlarge.
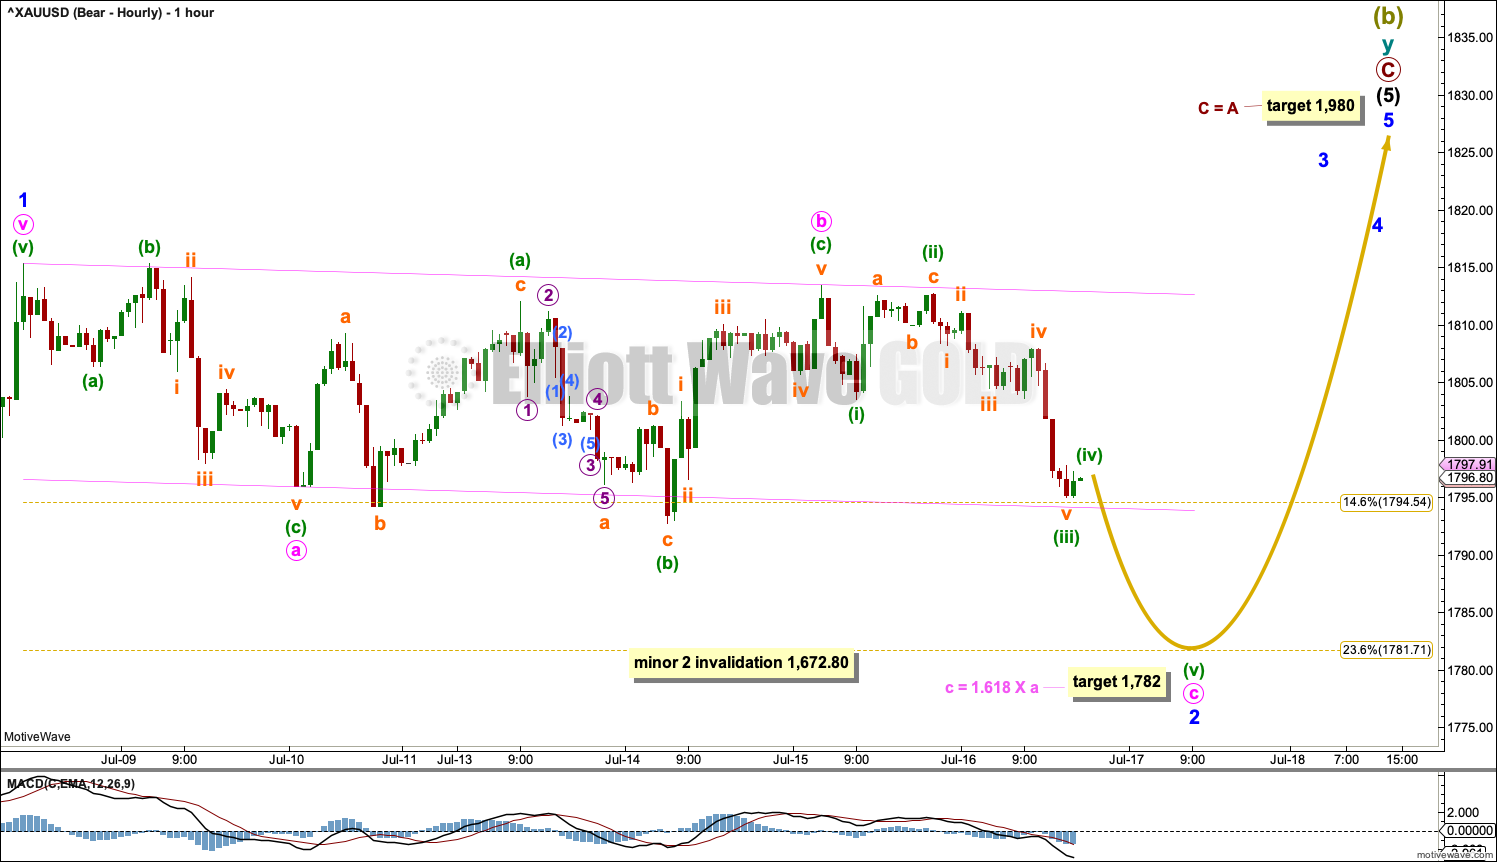
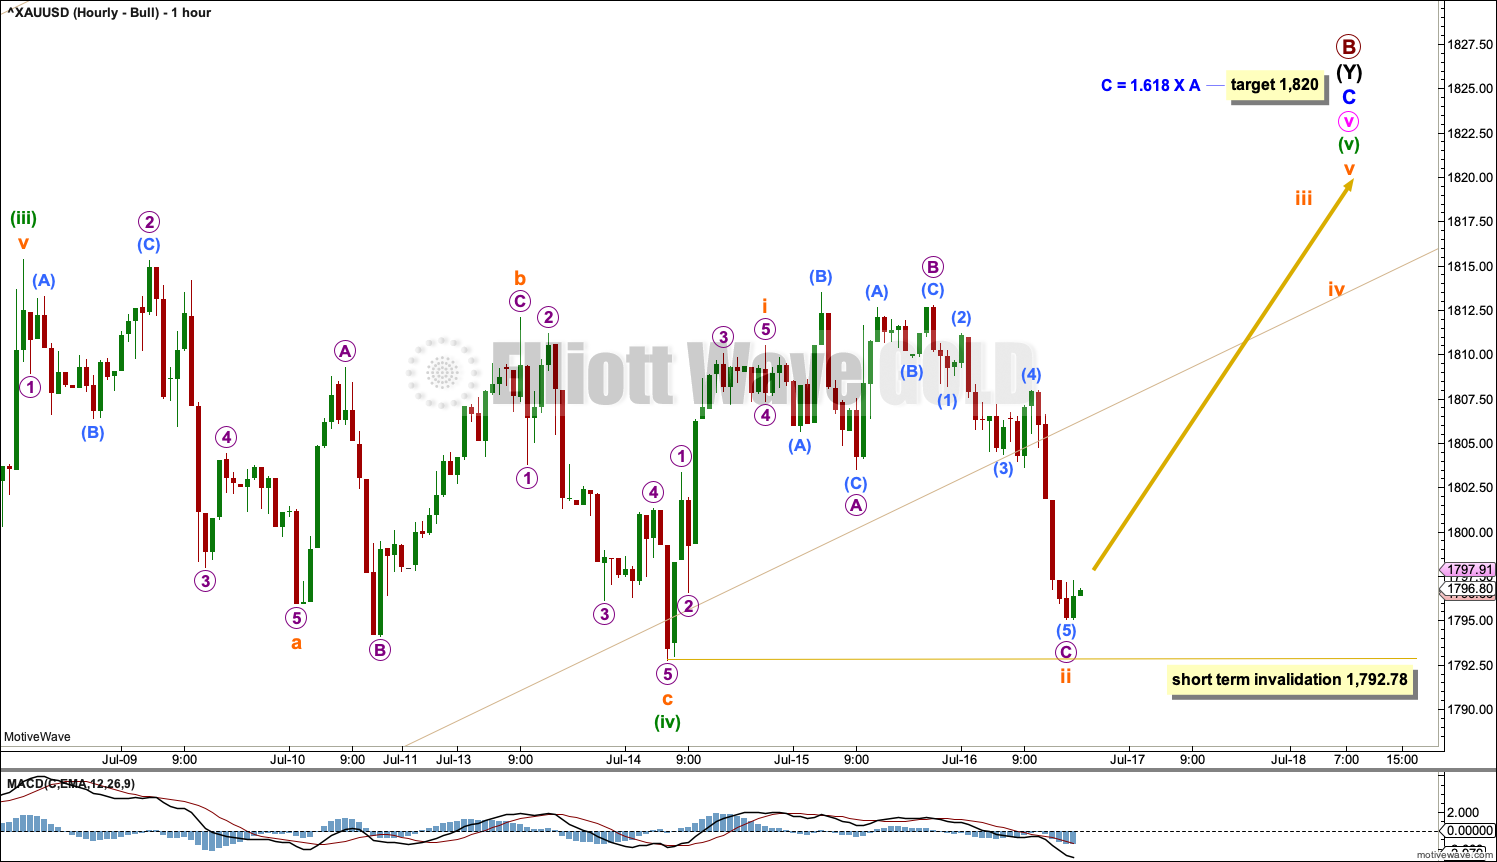
The hourly chart shows all of minor wave 2 so far. Minor wave 2 fits as a regular flat correction. If the target for minor wave 2 to end is wrong, then it may be too low. Price may find support about the lower edge of the pink channel that contains minor wave 2.
In the short term within minute wave c, minuette wave (iv) may not move into minuette wave (i) price territory above 1,803.53. A new high above 1,803.53 in the short term would be an indication that minor wave 2 should be over and minor wave 3 should have begun.
A breach of the upper edge of the pink channel would be an indication that minor wave 2 should be over and then minor wave 3 should be underway.
ALTERNATE DAILY CHART
Click chart to enlarge.
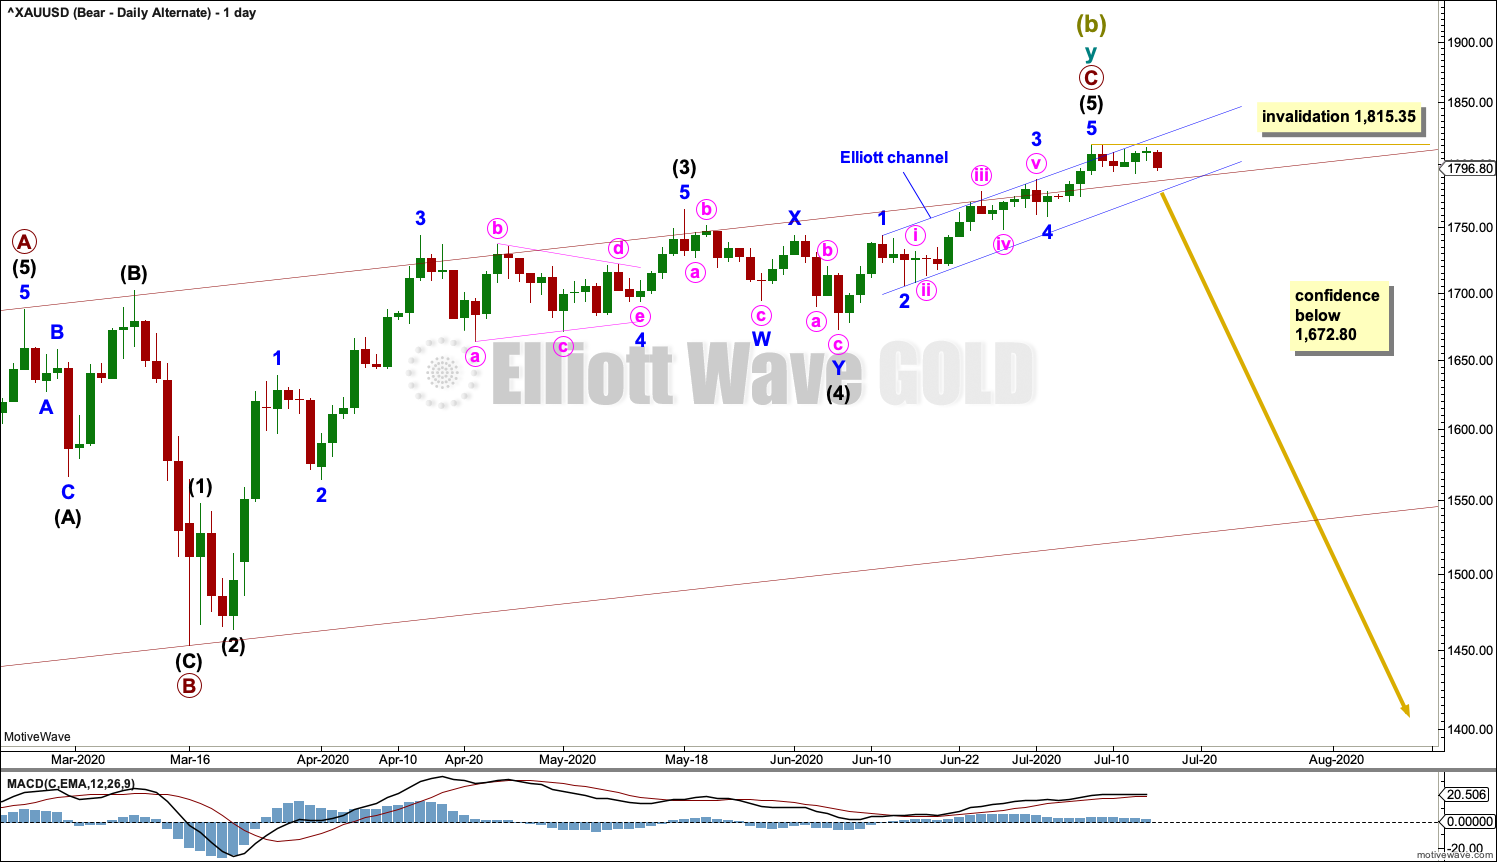
This wave count is the same as the first main daily chart up to the low labelled intermediate wave (4). Thereafter, the degree of labelling within intermediate wave (5) is moved up one degree. It is possible that intermediate wave (5) may be over.
This wave count requires a new low below 1,672.80 before confidence may be had in it.
If Super Cycle wave (b) is over, then within a new downwards trend no second wave correction may move beyond its start above 1,815.35.
ALTERNATE BULLISH ELLIOTT WAVE COUNT
WEEKLY CHART
Click chart to enlarge.
This wave count sees the the bear market complete at the last major low for Gold on 3 December 2015.
If Gold is in a new bull market, then it should begin with a five wave structure upwards on the weekly chart.
Cycle wave I fits as a five wave impulse with reasonably proportionate corrections for primary waves 2 and 4.
Cycle wave II fits as a double flat. However, within the first flat correction labelled primary wave W, this wave count needs to ignore what looks like an obvious triangle from July to September 2016 (this can be seen labelled as a triangle on the bear wave count above). This movement must be labelled as a series of overlapping first and second waves. Ignoring this triangle reduces the probability of this wave count in Elliott wave terms.
Within the first flat correction labelled primary wave W of the double flat of cycle wave II, intermediate wave (B) is 1.69 the length of intermediate wave (A). This is longer than the common range of up to 1.38, but within an allowable guideline of up to 2. The length of intermediate wave (B) reduces the probability of this wave count.
Cycle wave III may be complete. Cycle wave IV may not move into cycle wave I price territory below 1,303.51.
DAILY CHART
Click chart to enlarge.
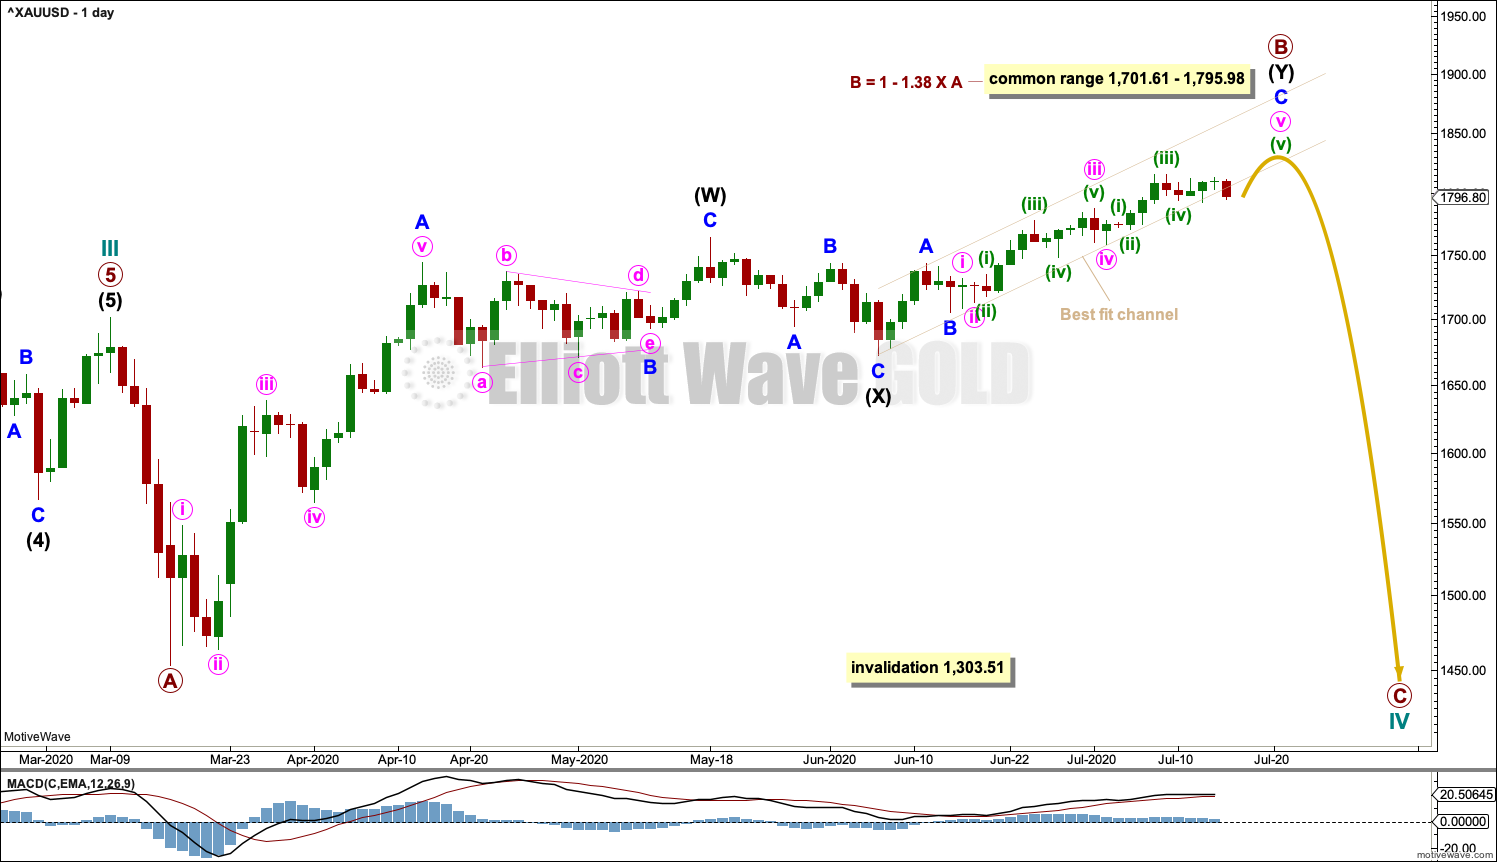
Cycle wave IV may be an incomplete expanded flat correction. Primary wave A within the flat correction may have subdivided as a zigzag. Primary wave B may be continuing higher as a double zigzag.
The common range of primary wave B would extend up to 1.38 times the length of primary wave A at 1,795.98. A maximum allowable guideline for primary wave B would be up to 2 times the length of primary wave A at 1,949.96. There is no Elliott wave rule stating a limit for B waves within expanded flat corrections, so there is no rule which may be used to determine an upper invalidation point for this wave count.
Primary wave B is now beyond the most common range, but remains within allowable limits. It may be over now with only one very slight new high.
The best fit channel about intermediate wave (Y) is slightly adjusted to contain recent lows. Assume upwards movement may continue while price remains within the channel. If the channel is breached, then assume intermediate wave (Y) may be over.
HOURLY CHART
Click chart to enlarge.
It is possible that minute wave v is incomplete and may require one final high.
While price remains above 1,792.78, then the upwards trend may still be in place. A new low below 1,792.78 would see a trend change for this wave count; if that happens, then the end of primary wave B would be labelled on the 9th of July. A target would be calculated for primary wave C.
TECHNICAL ANALYSIS
WEEKLY CHART
Click chart to enlarge. Chart courtesy of StockCharts.com.
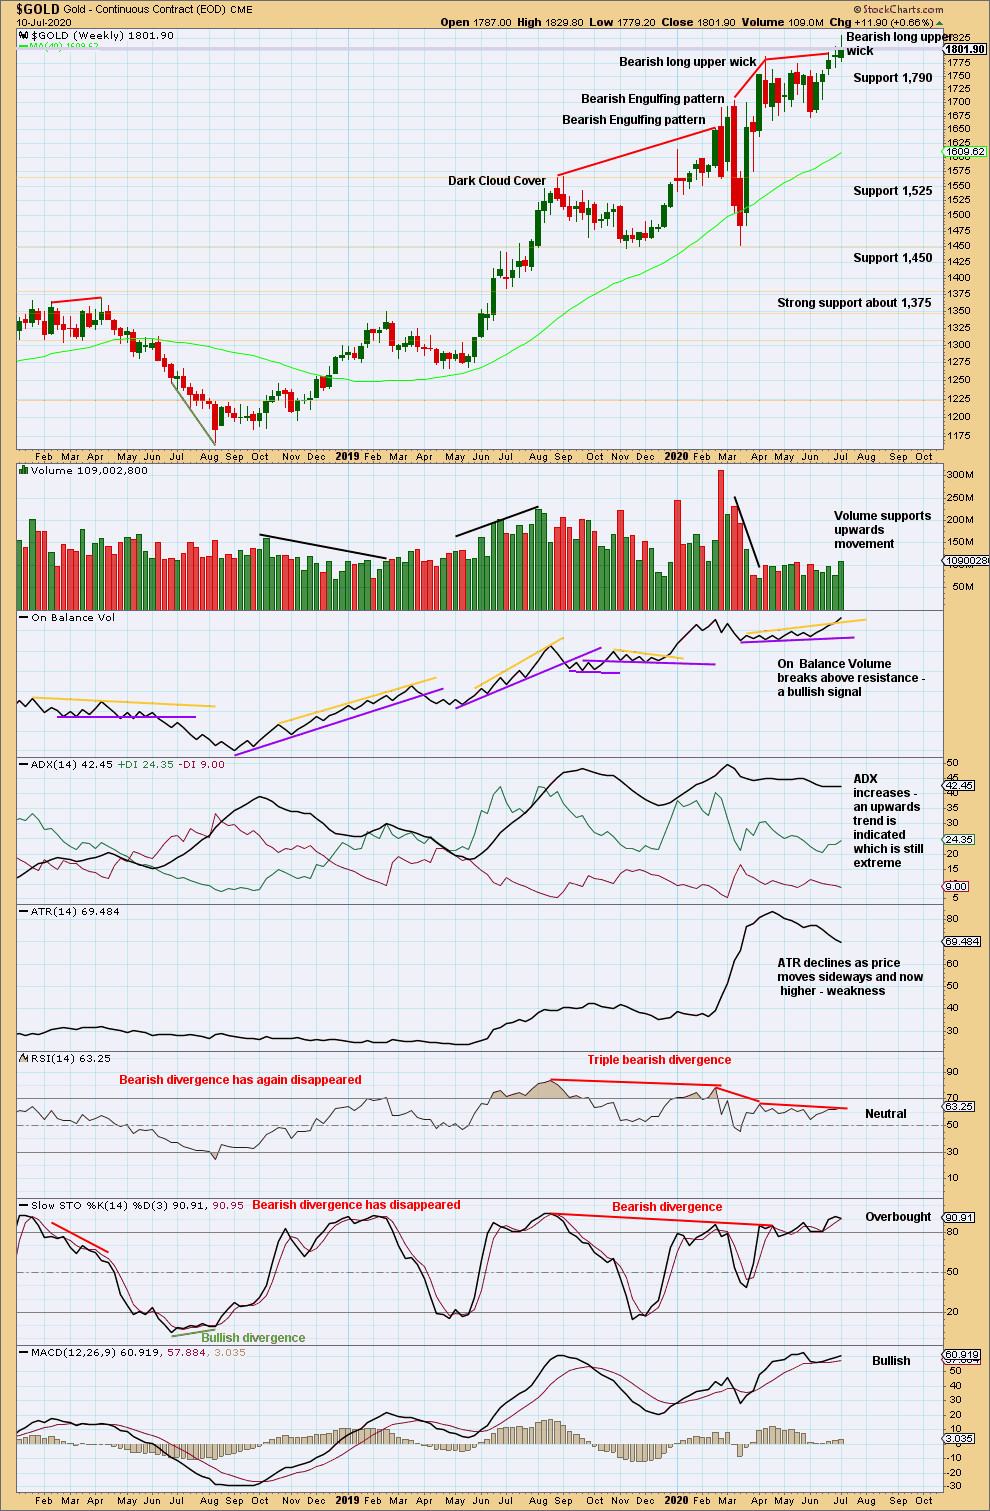
An upwards breakout has support from volume and a bullish signal from On Balance Volume.
A bearish upper wick and extreme ADX are warnings that this breakout may still be false, so a trend change may occur. Risk management during extreme conditions is essential.
DAILY CHART
Click chart to enlarge. Chart courtesy of StockCharts.com.
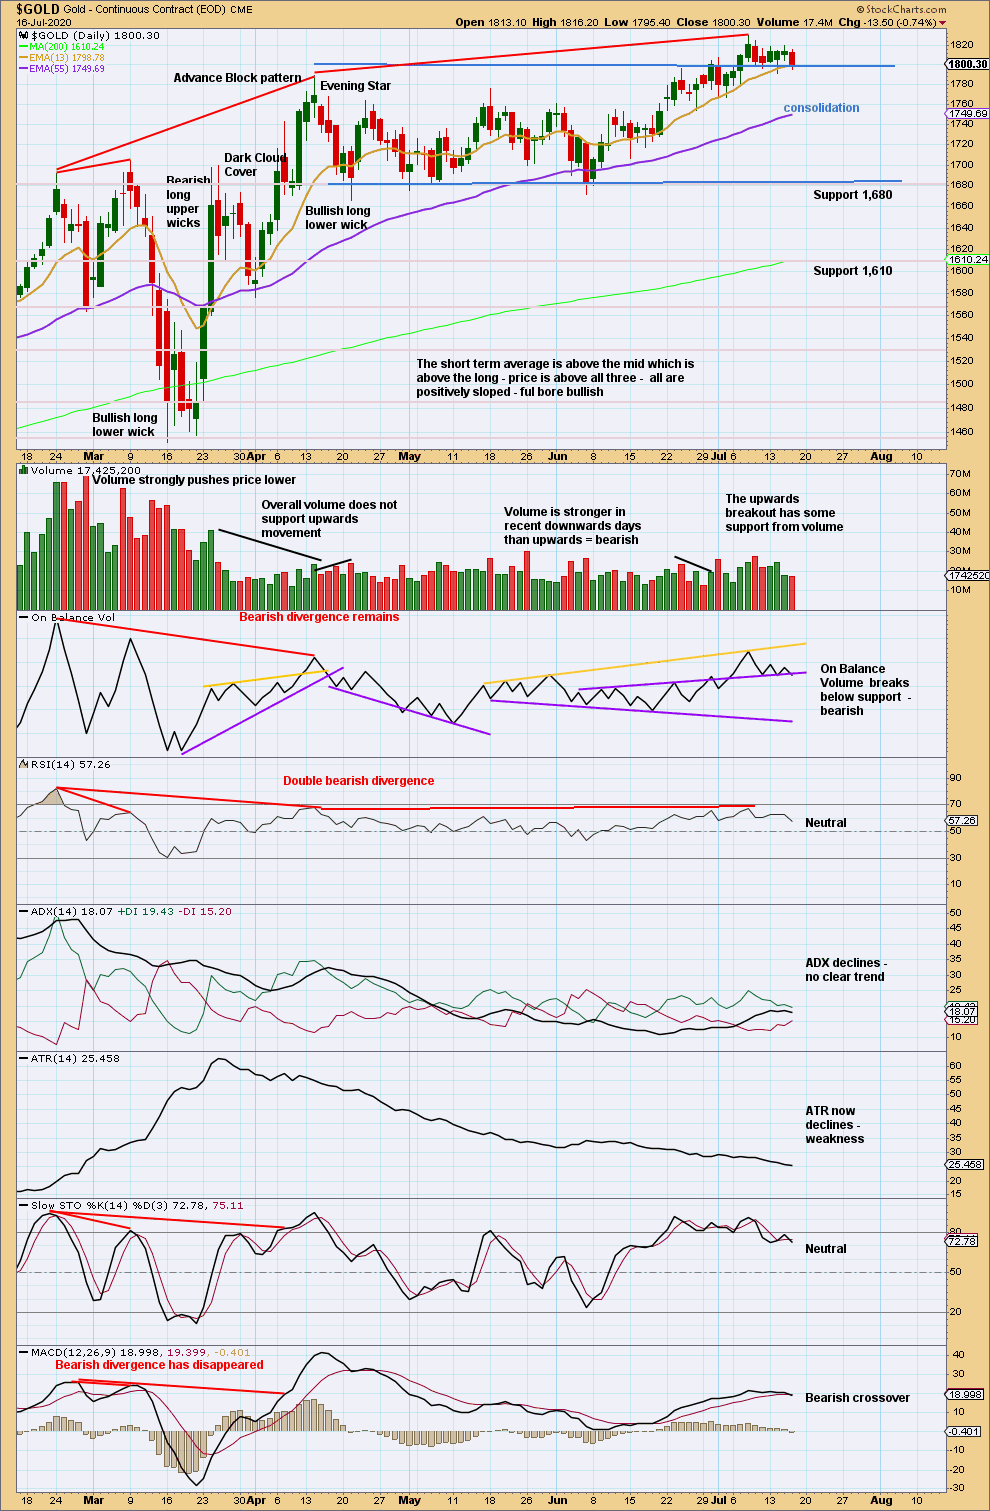
The consolidation zone spans from resistance about 1,800 to support about 1,680.
An upwards breakout has some support from volume. Price has closed above resistance. A target calculated from the width of the consolidation is at 1,930.
RSI is not yet overbought. ADX is not extreme. There is room for this trend to continue.
This signal today from On Balance Volume is not as clear as it could be. It may be best to wait one more session to see if the break below support is clearer. If it is, then that would offer early support to the alternate bearish wave count.
GDX WEEKLY CHART
Click chart to enlarge. Chart courtesy of StockCharts.com.
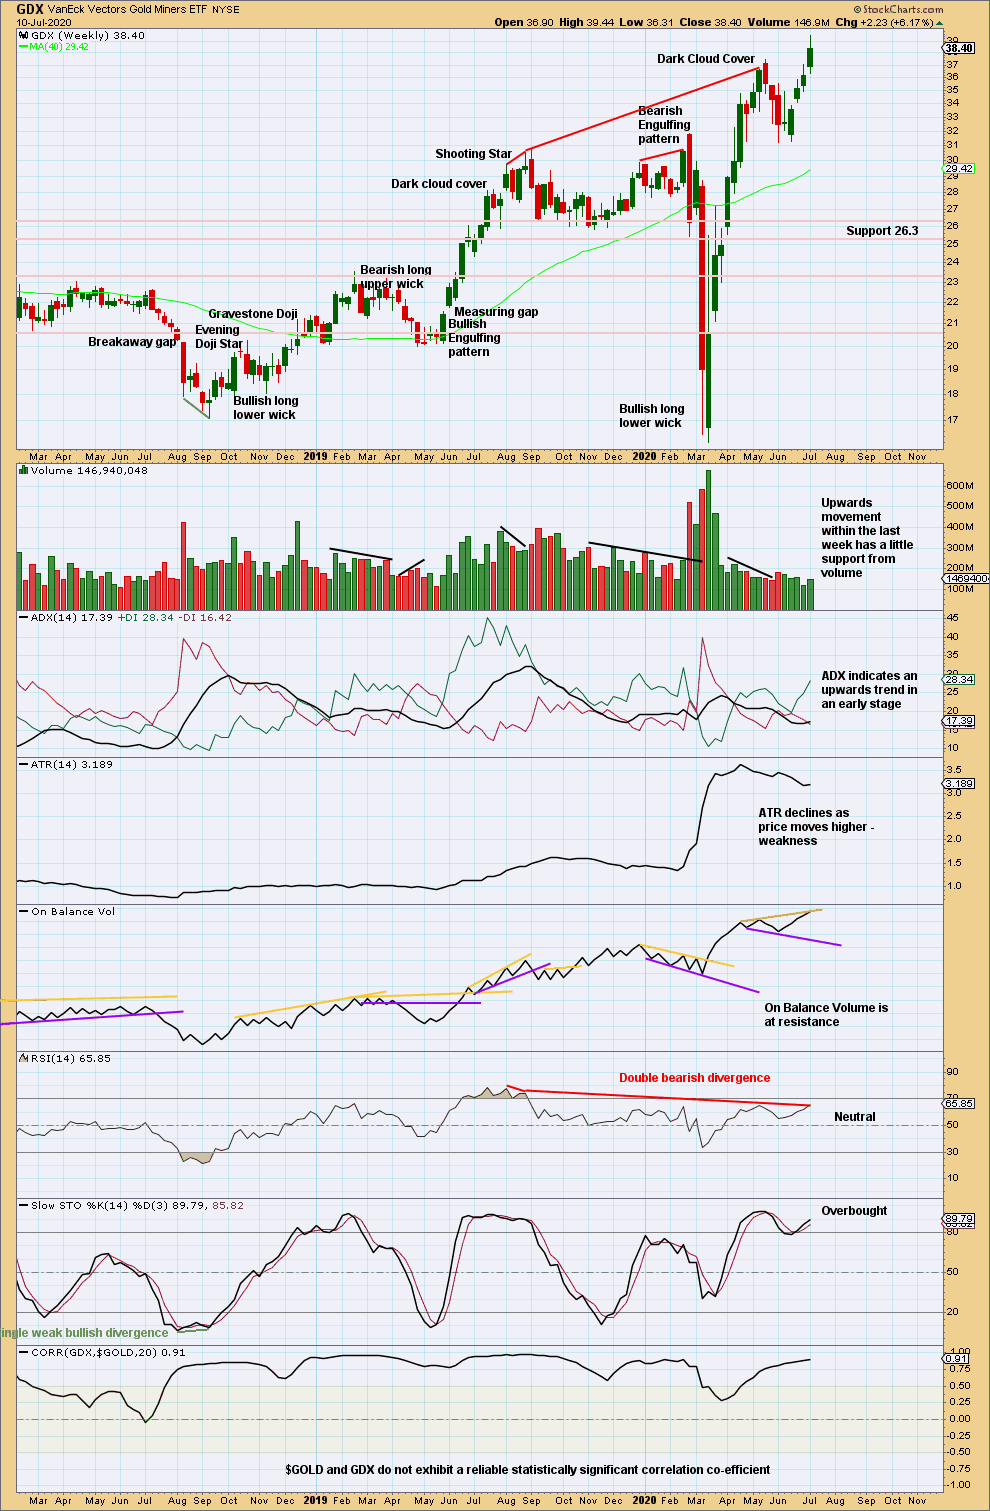
Bearish divergence with RSI is a warning to proceed with caution.
GDX DAILY CHART
Click chart to enlarge. Chart courtesy of StockCharts.com.
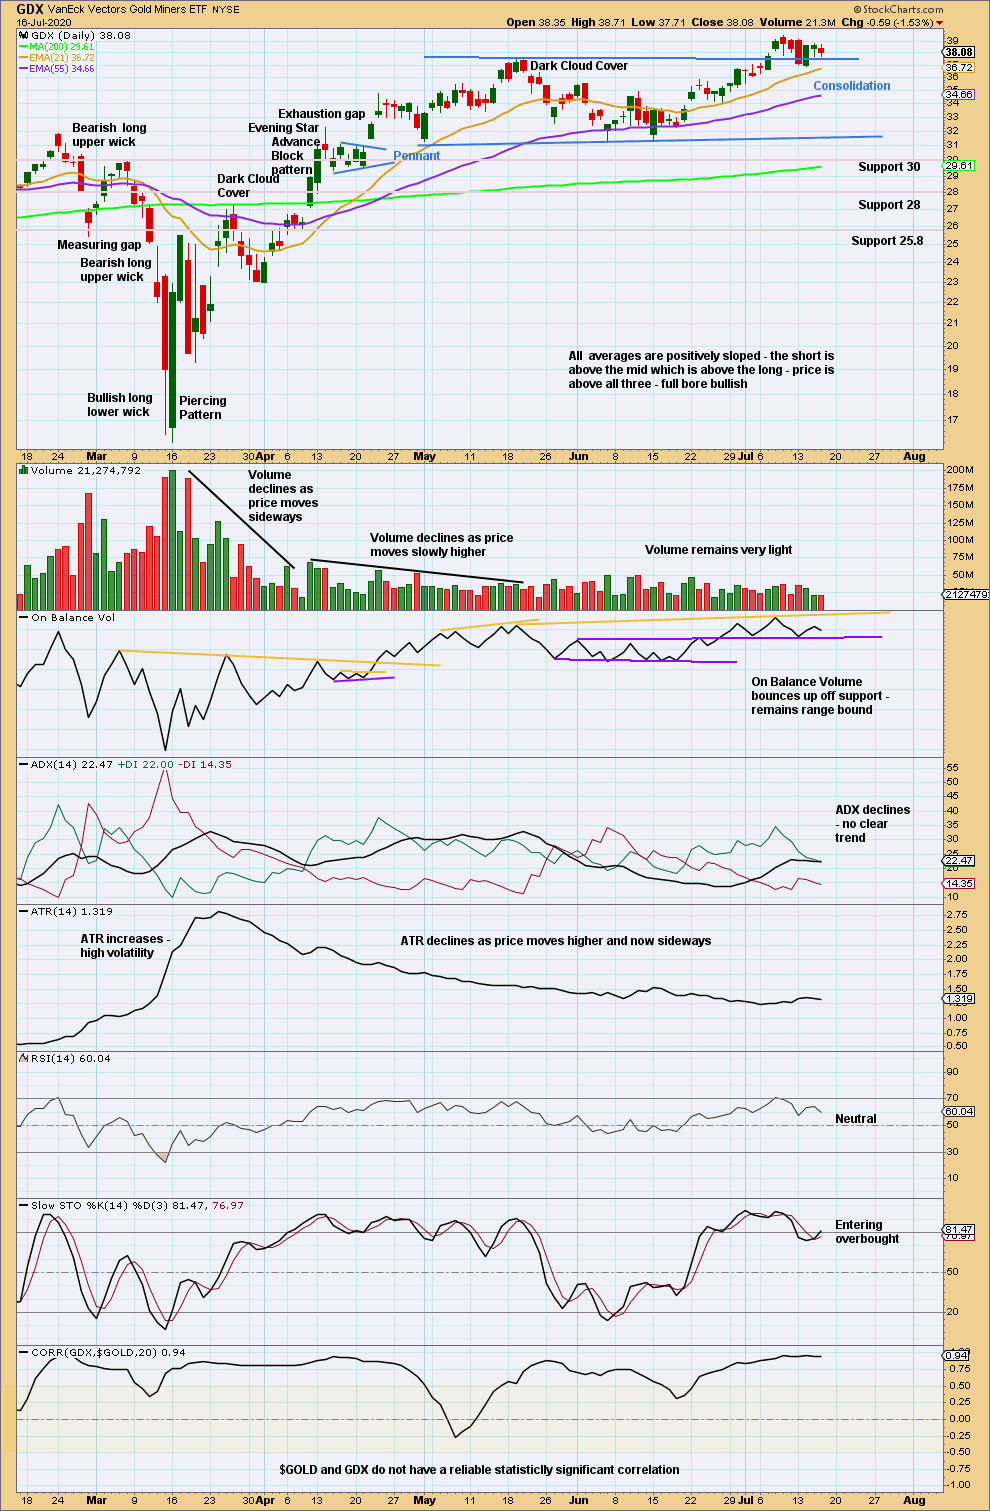
A close back above the prior consolidation zone switches the view that the breakout may have been valid and may be followed by upwards movement. While price remains above support at prior resistance and On Balance Volume remains above support, upwards movement may be expected as reasonably likely. A target calculated from the width of the consolidation zone is at 43.78.
Published @ 06:46 p.m. ET.
—
Careful risk management protects your trading account(s).
Follow my two Golden Rules:
1. Always trade with stops.
2. Risk only 1-5% of equity on any one trade.
—
New updates to this analysis are in bold.