
GOLD: Elliott Wave and Technical Analysis | Charts – July 22, 2020
Members were warned yesterday that a blow off top may form. An increase in upwards momentum fits this expectation.
Summary: The upwards trend is intact. A new short-term target is at 1,884 or 1,909 for a third wave to end, which may end with strength.
The next target is at 1,980 or 2,250.
Grand SuperCycle analysis is here.
Monthly charts were last updated here.
MAIN ELLIOTT WAVE COUNT
WEEKLY CHART
Click chart to enlarge.
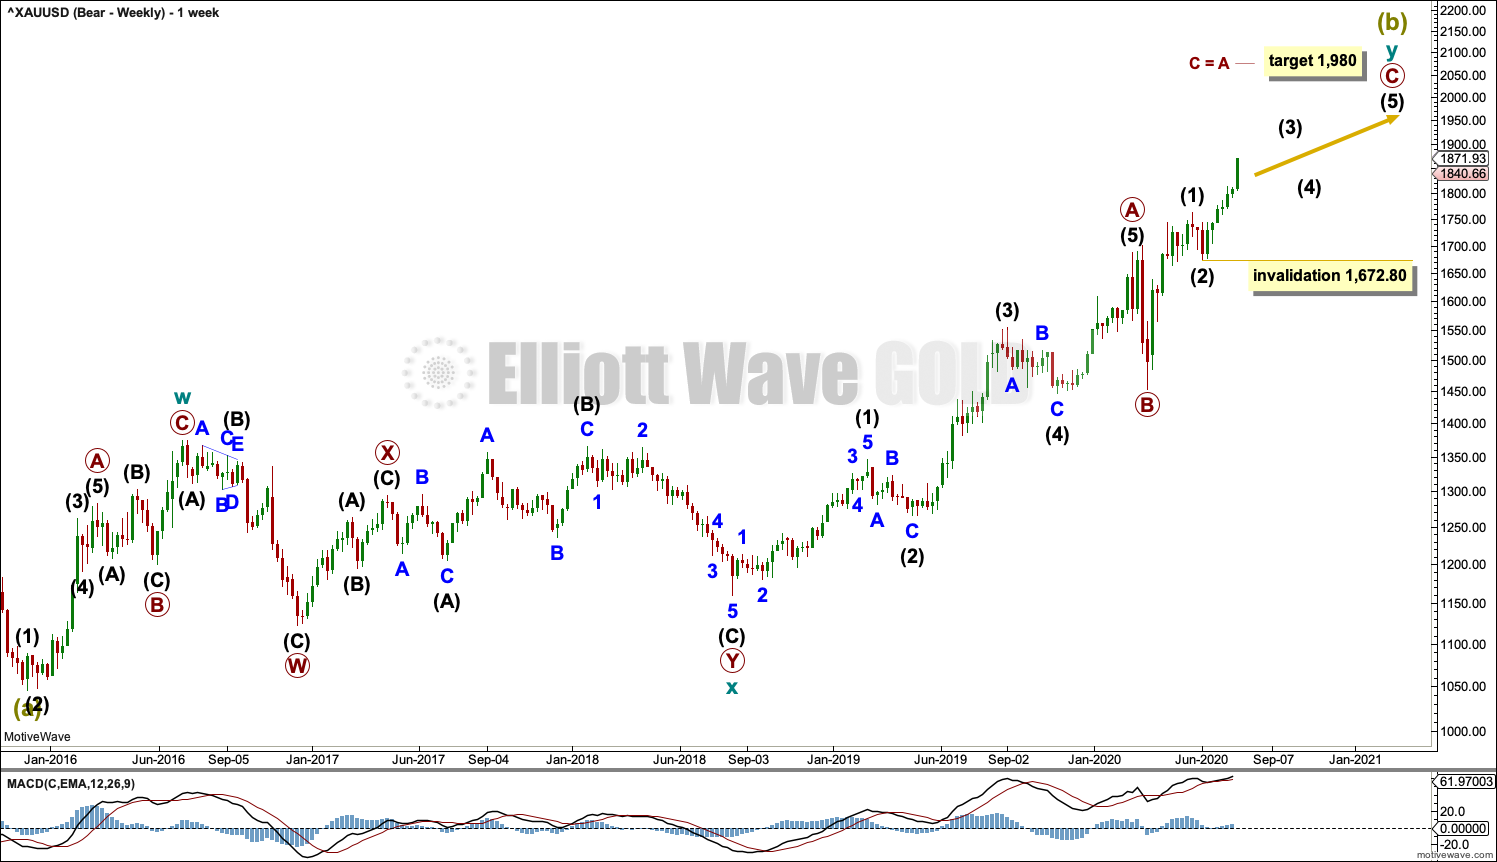
The bigger picture for this main bearish Elliott wave count sees Gold as still within a bear market, in a three steps back pattern that is labelled Grand Super Cycle wave IV on monthly charts.
Super Cycle wave (b) within Grand Super Cycle wave IV may be an incomplete double zigzag. When Super Cycle wave (b) may be complete, then this wave count expects Super Cycle wave (c) to begin and to move price below the end of Super Cycle wave (a) at 1,046.27.
The first zigzag in the double is labelled cycle wave w. The double is joined by a three in the opposite direction, a combination labelled cycle wave x. The second zigzag in the double is labelled cycle wave y.
The purpose of the second zigzag in a double is to deepen the correction. Cycle wave y has achieved this purpose.
Primary wave C within cycle wave y may be subdividing as an impulse. Intermediate waves (1) and (2) within primary wave C may be complete. Intermediate wave (3) may be nearing completion. No second wave correction within intermediate wave (3) may move beyond the start of its first wave below 1,672.80.
We should always assume the trend remains the same until proven otherwise. At this stage, Gold is in a bull market for the mid term.
MAIN DAILY CHART
Click chart to enlarge.
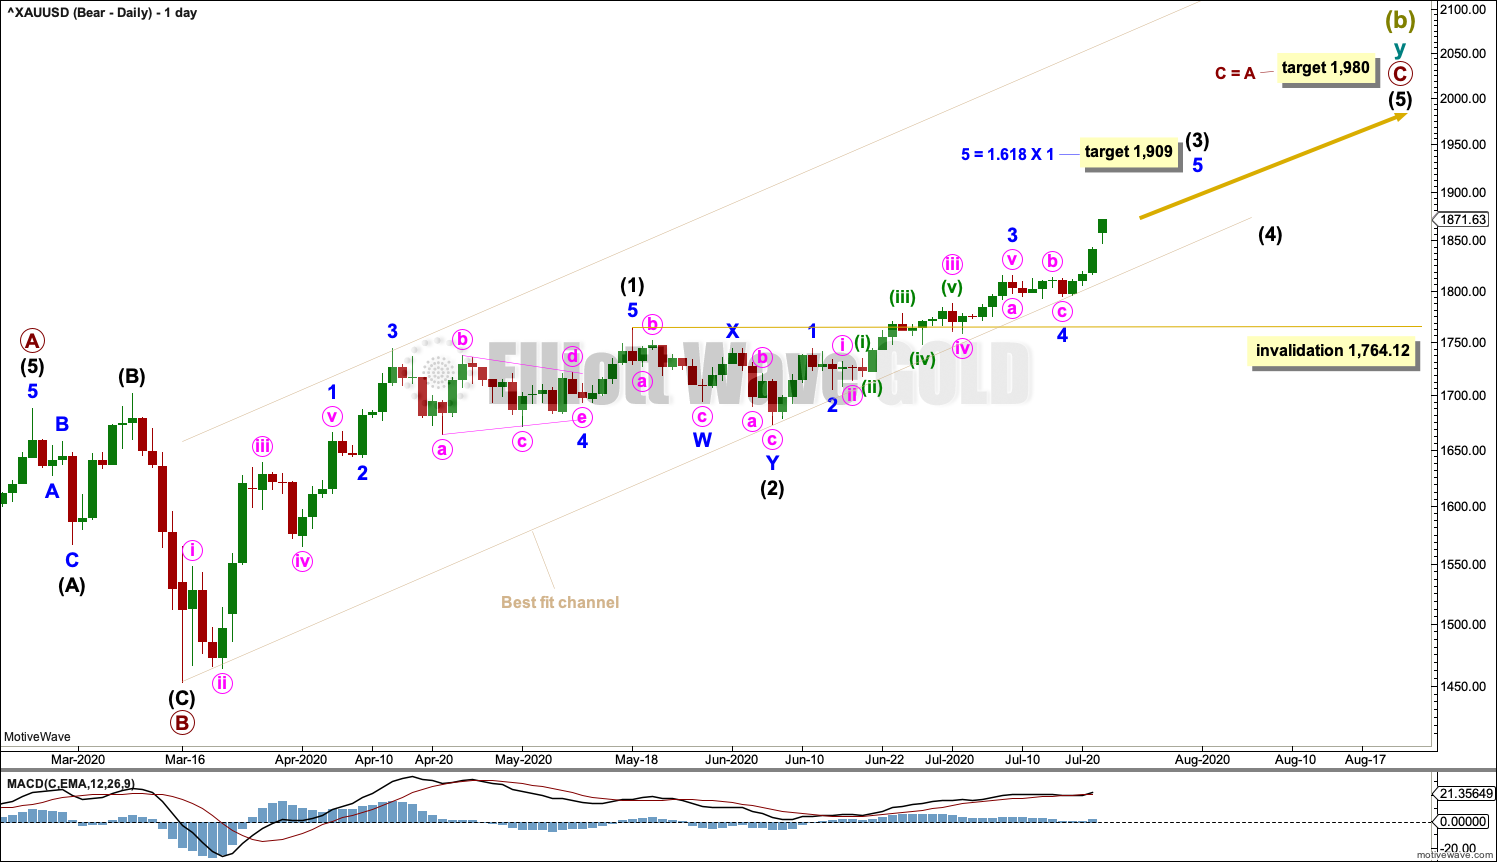
The daily chart shows detail of primary wave C as an incomplete impulse.
Intermediate waves (1) and (2) within primary wave C may be complete. Intermediate wave (3) may be incomplete. A new target is calculated today for intermediate wave (3) to end.
Intermediate wave (4) may not move into intermediate wave (1) price territory below 1,764.12.
Draw a best fit channel about primary wave C as shown. The lower edge of the channel may continue to provide support to corrections along the way up.
HOURLY CHART
Click chart to enlarge.
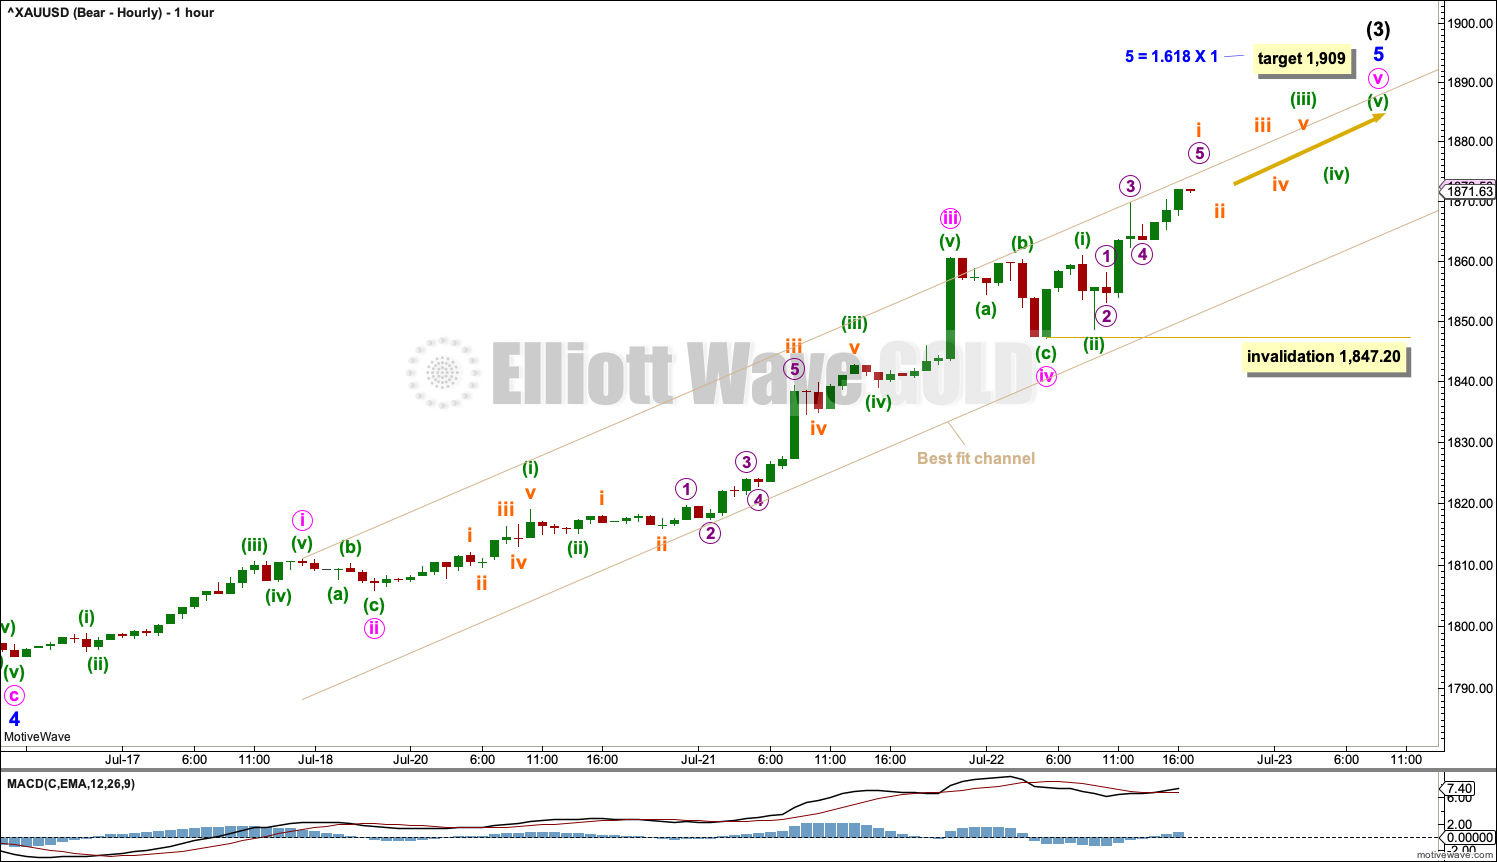
The hourly chart focusses on the detail of minor wave 5 within intermediate wave (3).
Minor wave 5 may be an incomplete impulse. Minute waves i through to iv within minor wave 5 may be complete.
Minute wave v to end minor wave 5 to end intermediate wave (3) may end with a blow off top.
No second wave correction within minute wave v may move beyond its start below 1,847.20.
ALTERNATE BULLISH ELLIOTT WAVE COUNT
WEEKLY CHART
Click chart to enlarge.
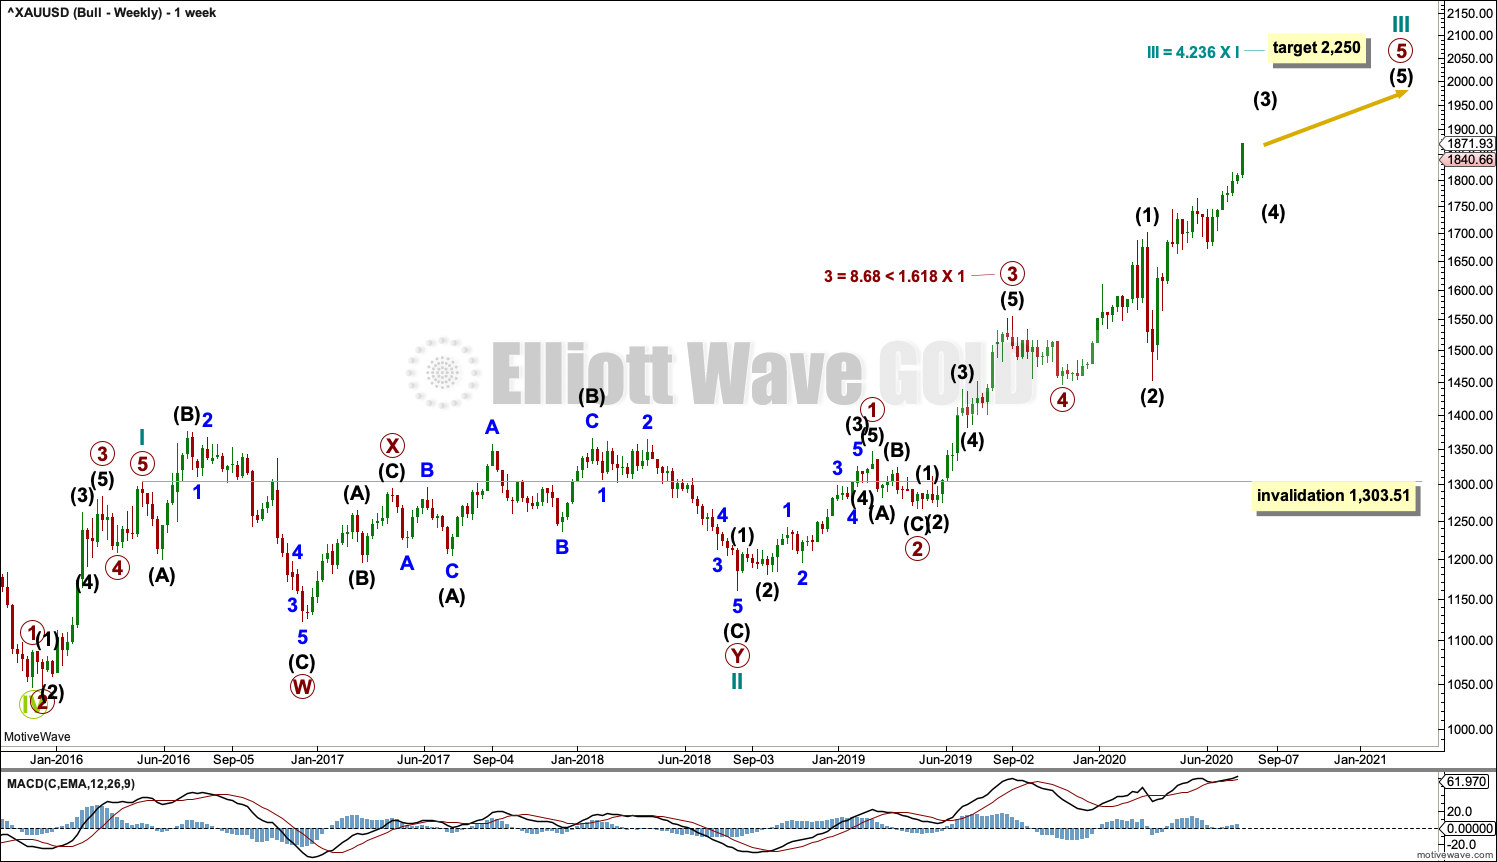
This wave count sees the the bear market complete at the last major low for Gold on 3 December 2015.
If Gold is in a new bull market, then it should begin with a five wave structure upwards on the weekly chart.
Cycle wave I fits as a five wave impulse with reasonably proportionate corrections for primary waves 2 and 4.
Cycle wave II fits as a double flat. However, within the first flat correction labelled primary wave W, this wave count needs to ignore what looks like an obvious triangle from July to September 2016 (this can be seen labelled as a triangle on the bear wave count above). This movement must be labelled as a series of overlapping first and second waves. Ignoring this triangle reduces the probability of this wave count in Elliott wave terms.
Within the first flat correction labelled primary wave W of the double flat of cycle wave II, intermediate wave (B) is 1.69 the length of intermediate wave (A). This is longer than the common range of up to 1.38, but within an allowable guideline of up to 2. The length of intermediate wave (B) reduces the probability of this wave count.
Cycle wave III may be incomplete. A new target for cycle wave III is calculated today. Cycle wave IV may not move into cycle wave I price territory below 1,303.51.
DAILY CHART
Click chart to enlarge.
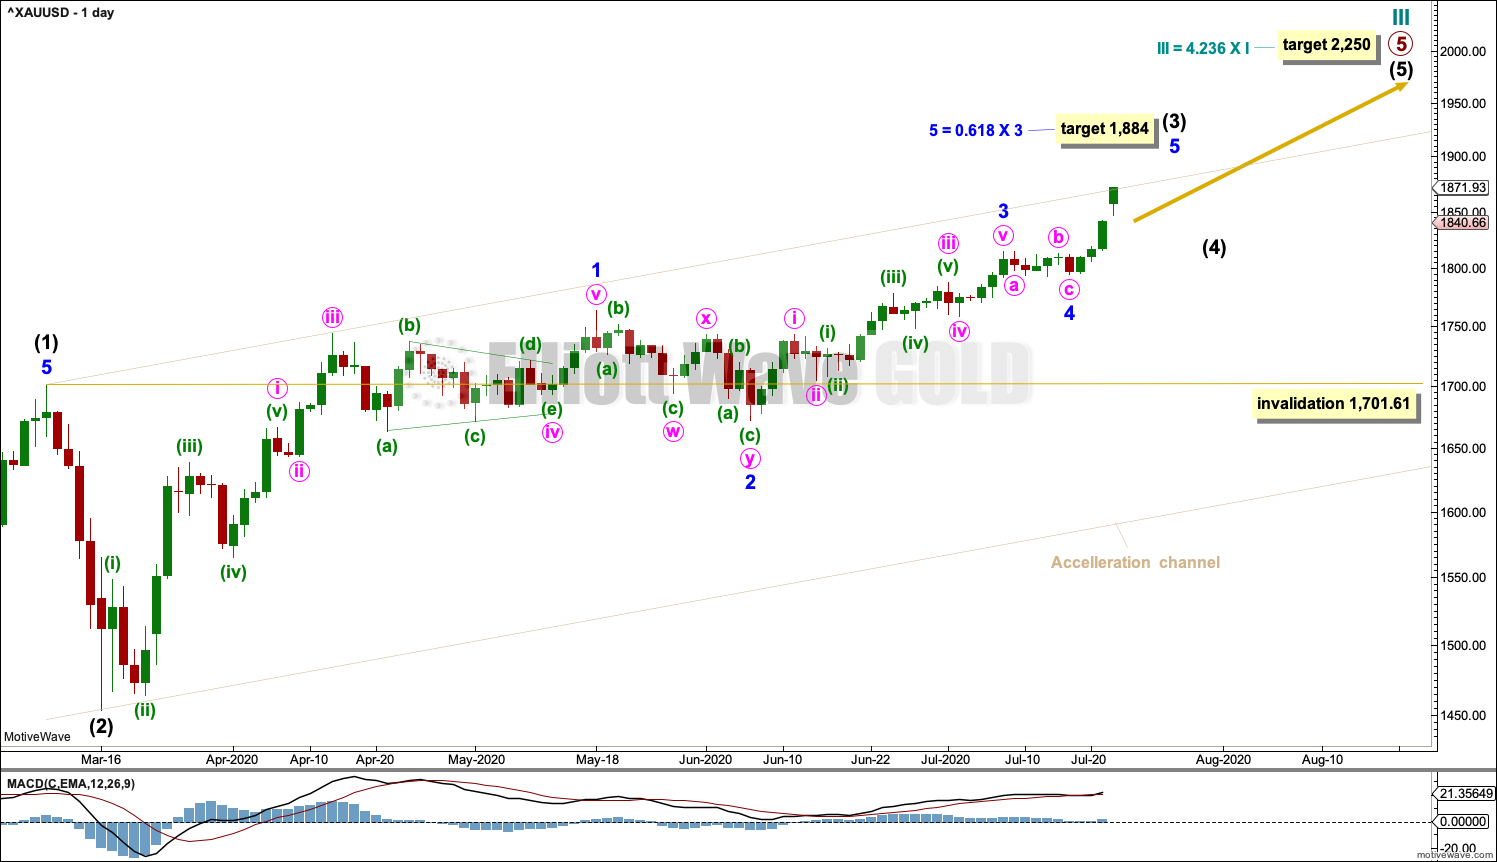
Cycle wave III may be continuing higher. The daily chart focusses on the end of primary wave 5 within cycle wave III.
Draw an acceleration channel about primary wave 5 as shown. Keep redrawing the channel as price continues higher. When intermediate wave (3) is over, then intermediate wave (4) may find support about the lower edge of the channel.
Intermediate wave (4) may not move into intermediate wave (1) price territory below 1,701.61.
A short-term target is calculated for intermediate wave (3).
HOURLY CHART
Click chart to enlarge.
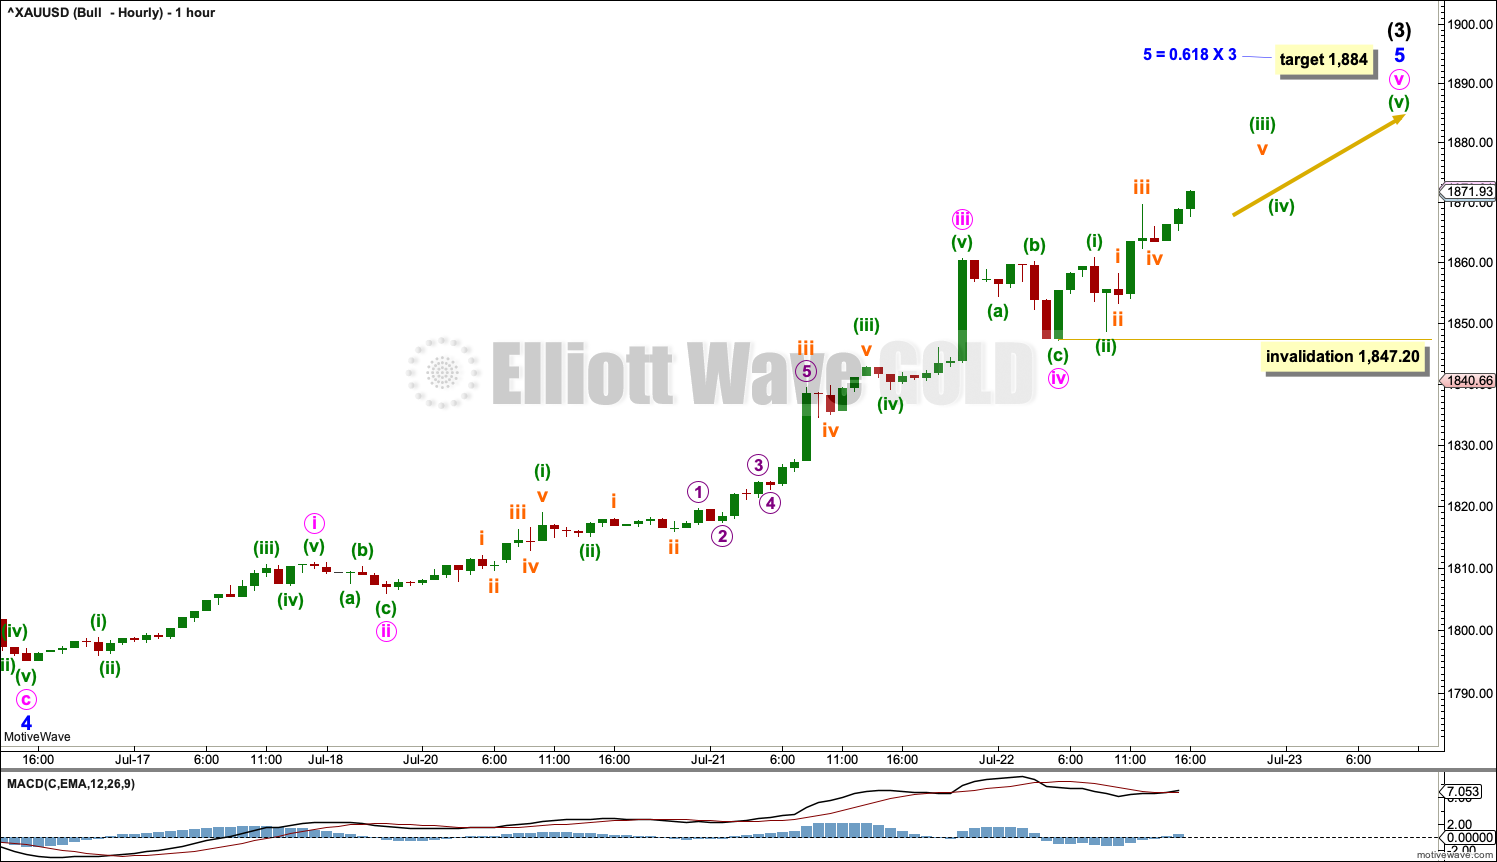
The hourly chart focusses on minor wave 5 within intermediate wave (3) within primary wave 5 within cycle wave III.
Minor wave 5 may subdivide as an impulse. Minute wave iv within the impulse may not move into minute wave i price territory below 1,810.92.
At this stage, both bull and bear wave counts are the same at the hourly chart level.
TECHNICAL ANALYSIS
WEEKLY CHART
Click chart to enlarge. Chart courtesy of StockCharts.com.
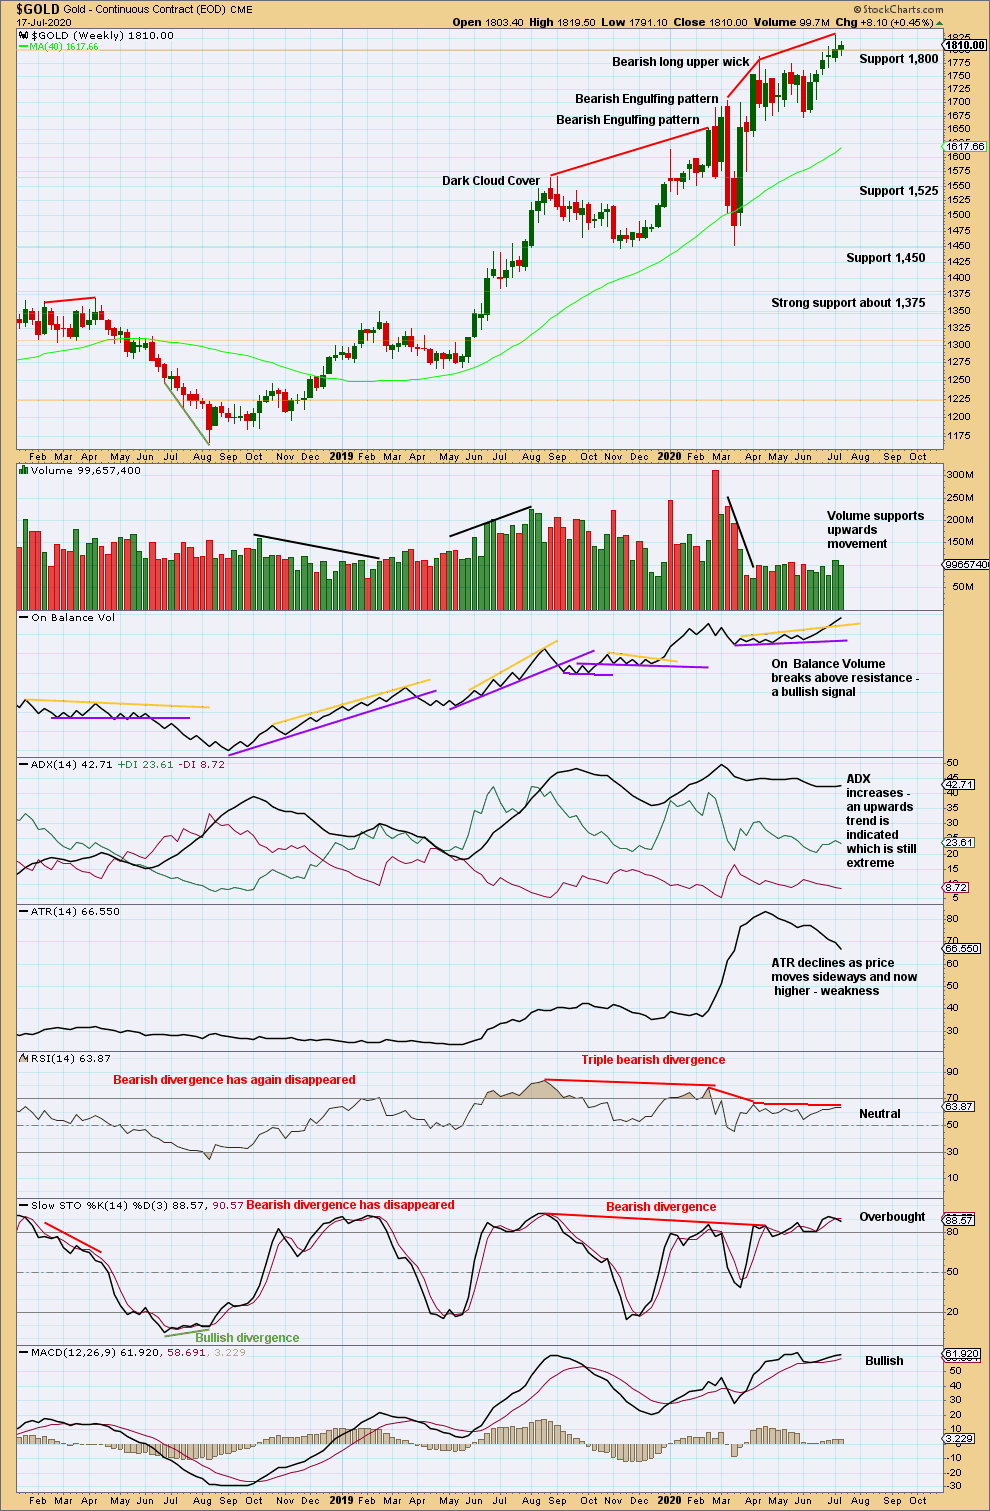
An upwards breakout has support from volume and a bullish signal from On Balance Volume.
Extreme ADX and bearish divergence between price and RSI are warnings that this breakout may still be false, so a trend change may occur. Risk management during extreme conditions is essential.
DAILY CHART
Click chart to enlarge. Chart courtesy of StockCharts.com.
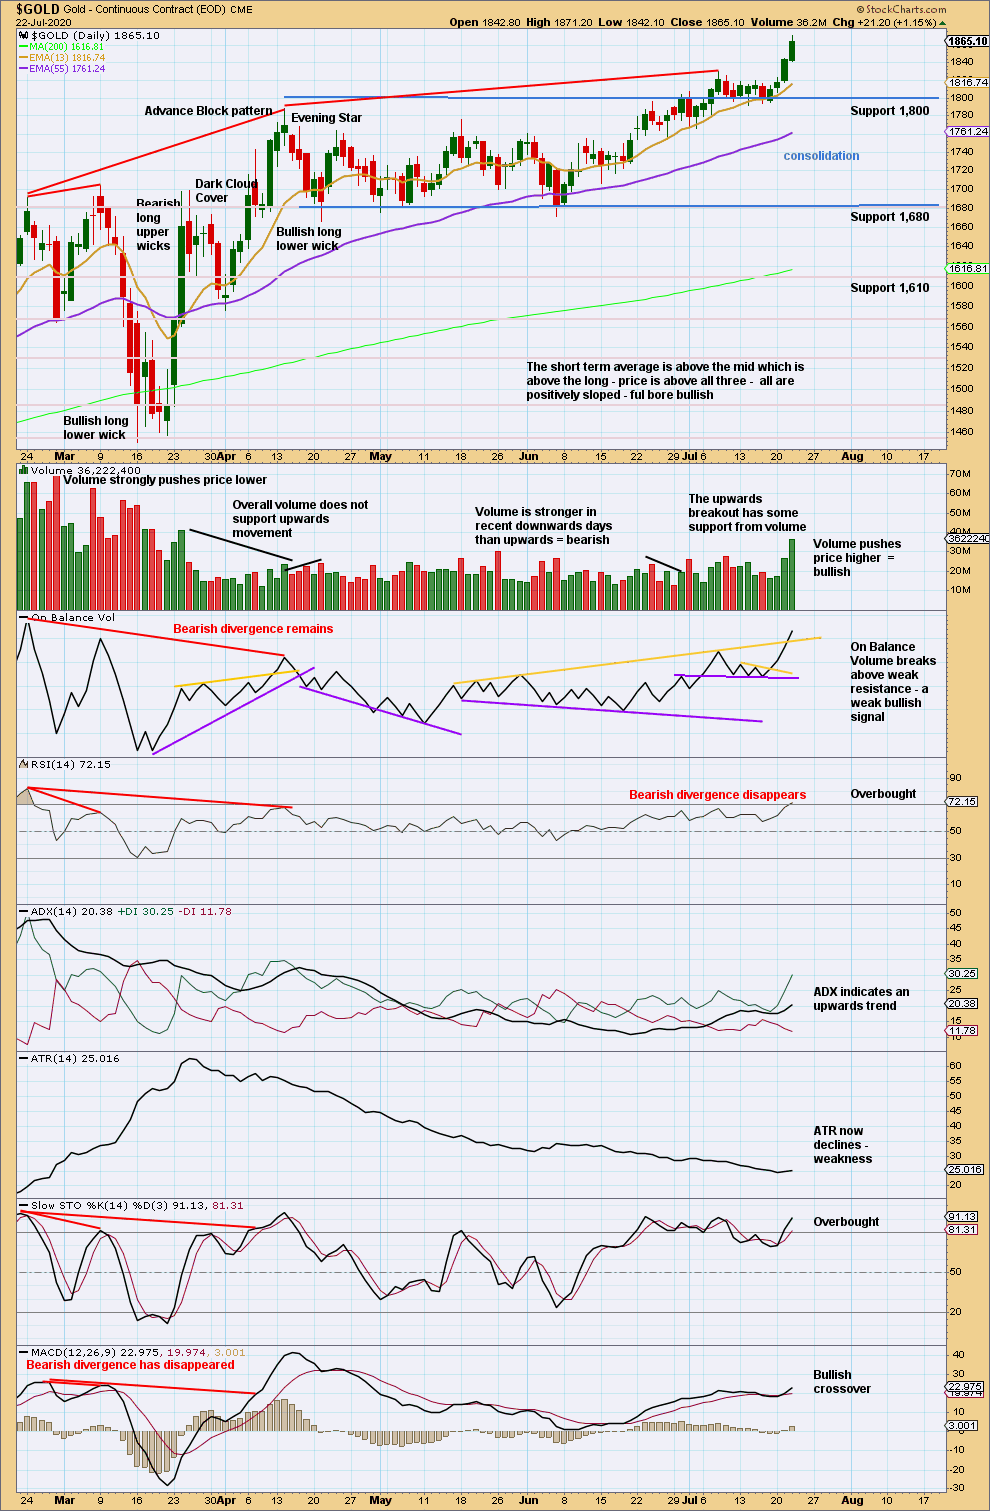
The consolidation zone spans from resistance about 1,800 to support about 1,680.
An upwards breakout has some support from volume. Price has closed above resistance. A target calculated from the width of the consolidation is at 1,930.
RSI is just now overbought; it may reach more deeply overbought while price continues higher. ADX is not extreme. There is room for this trend to continue.
Volume and range continues to increase. The trend has strength.
GDX WEEKLY CHART
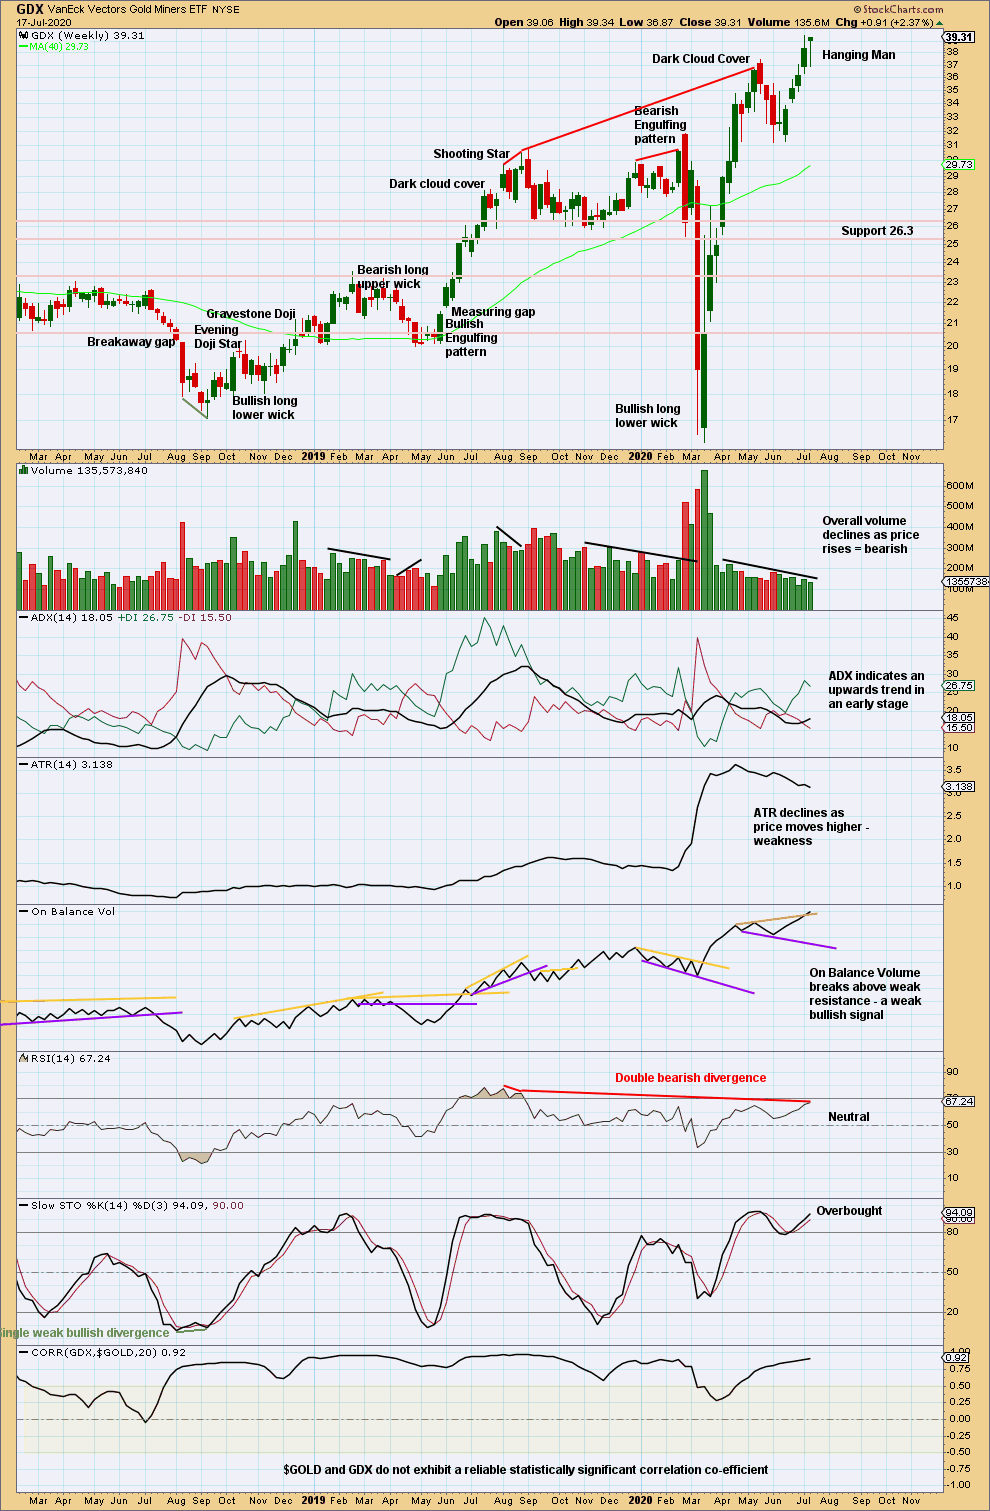
Click chart to enlarge. Chart courtesy of StockCharts.com.
The bullish implications of the long lower wick on a Hanging Man candlestick pattern mean it needs bearish confirmation in the following candlestick before some confidence may be had in it as a reversal pattern. This makes a Hanging Man essentially a two candlestick pattern.
A possible reversal pattern with a bearish volume profile and bearish divergence between price and RSI is a warning that the risk of a trend change here is high.
GDX DAILY CHART
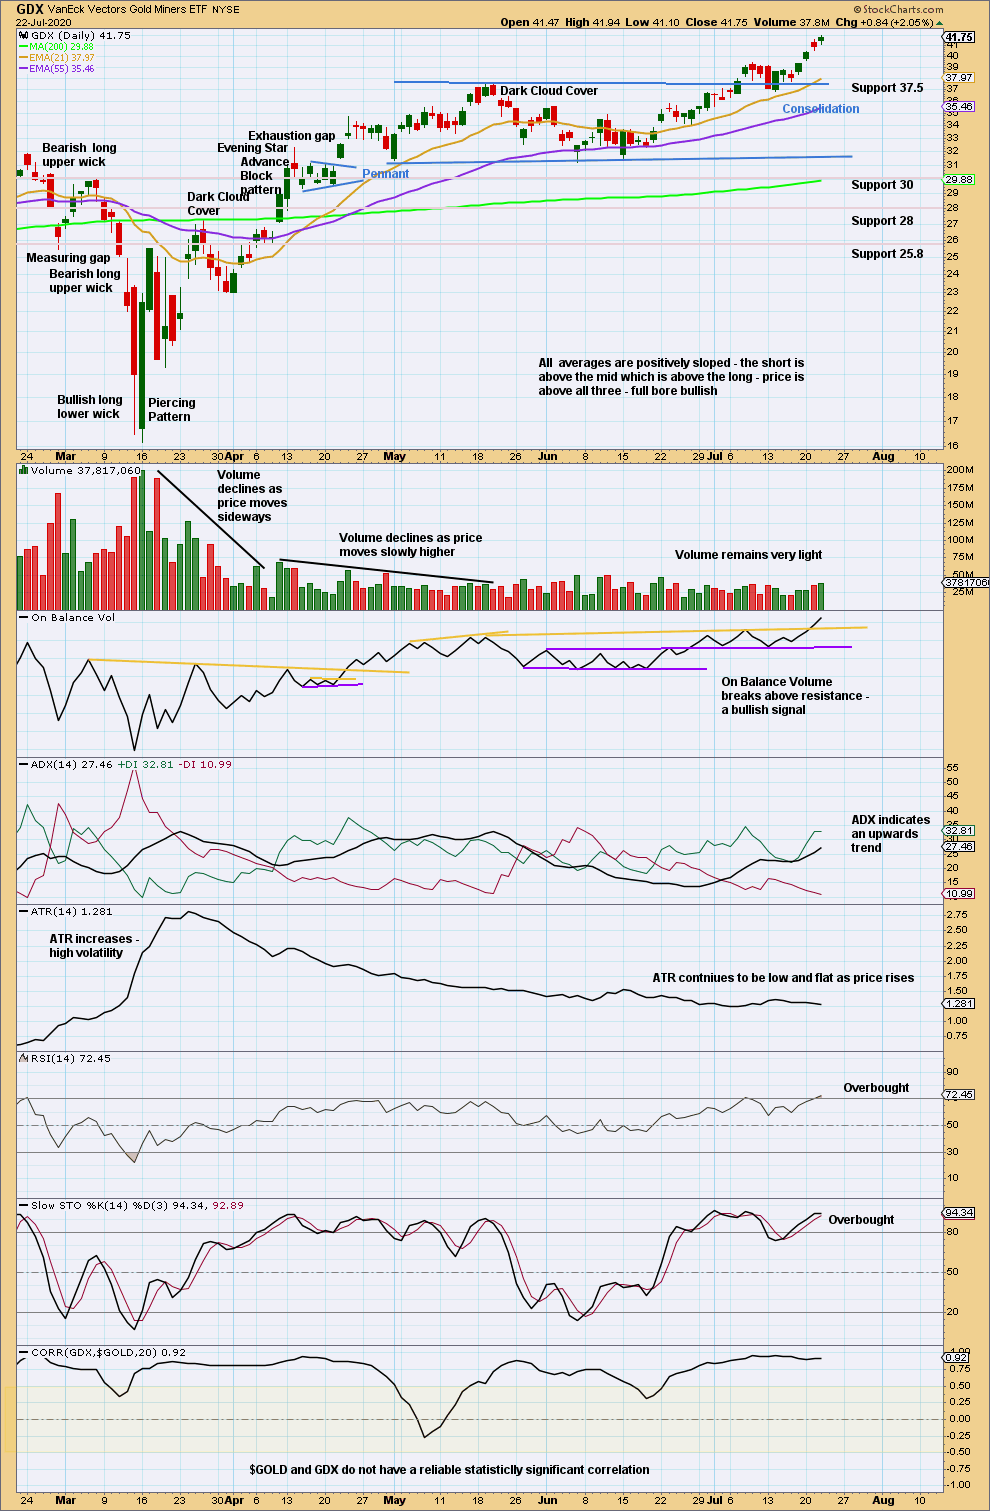
Click chart to enlarge. Chart courtesy of StockCharts.com.
A target calculated from the width of the consolidation zone is at 43.78.
Published @ 05:45 p.m. ET.
—
Careful risk management protects your trading account(s).
Follow my two Golden Rules:
1. Always trade with stops.
2. Risk only 1-5% of equity on any one trade.
—
New updates to this analysis are in bold.