
GOLD: Elliott Wave and Technical Analysis | Charts – July 27, 2020
Summary: The next target is at 1,984 for a third wave to end, which may end with strength. If price reaches this target and either the structure is incomplete or price keeps rising through it, then the next target would be at 2,175.
If the channel on the hourly chart is breached by a full hourly candlestick below and not touching the channel, then that may be taken as earliest indication of a potential trend change. A new low below 1,897.08 would add further confidence.
The next longer term target is at 2,306 or 2,250.
Grand SuperCycle analysis is here.
Monthly charts were last updated here.
MAIN ELLIOTT WAVE COUNT
WEEKLY CHART
Click chart to enlarge.
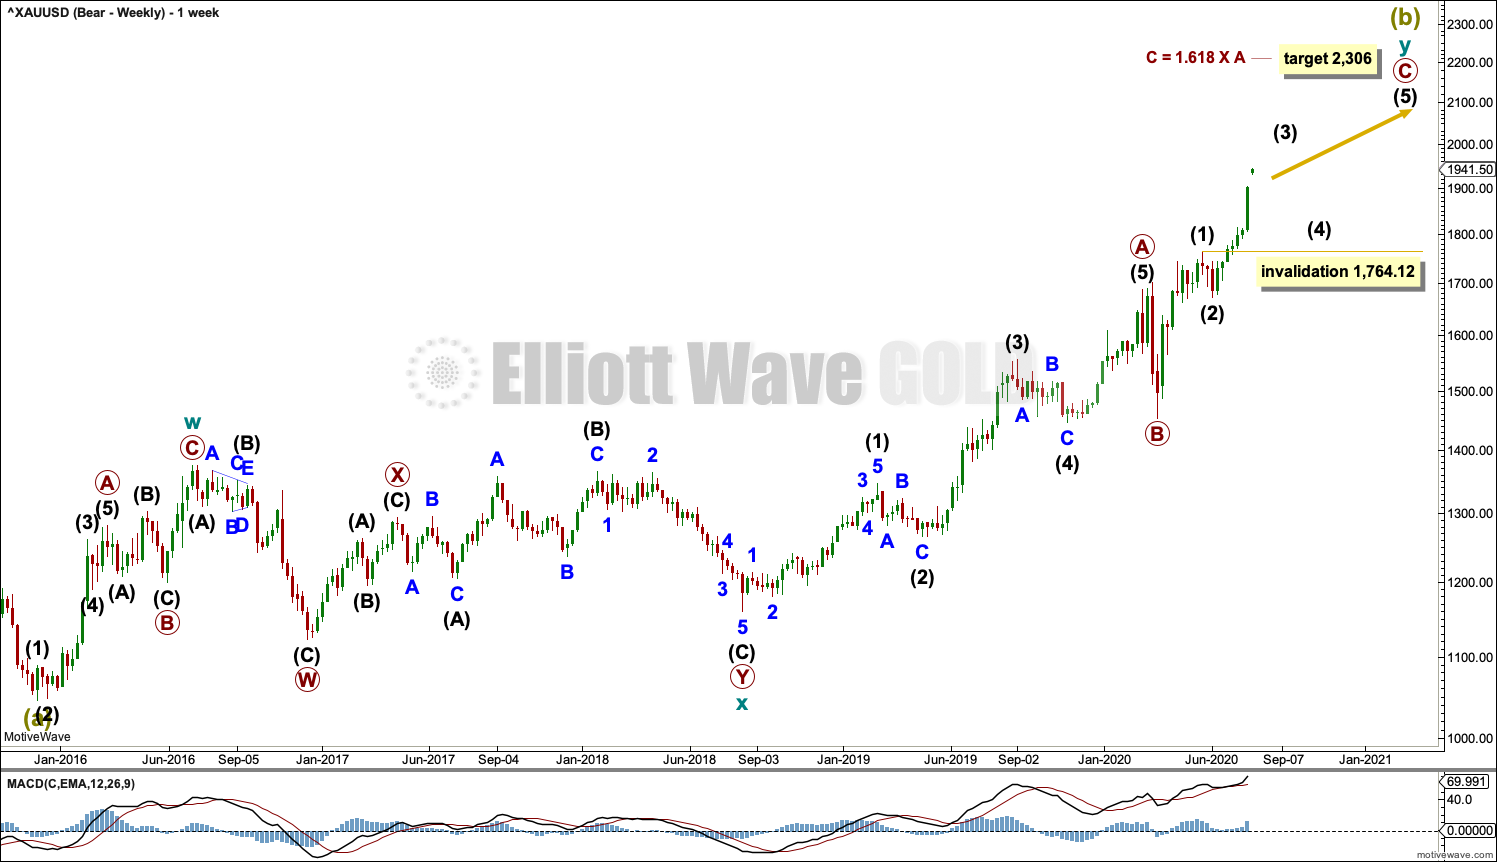
The bigger picture for this main bearish Elliott wave count sees Gold as still within a bear market, in a three steps back pattern that is labelled Grand Super Cycle wave IV on monthly charts.
Super Cycle wave (b) within Grand Super Cycle wave IV may be an incomplete double zigzag. When Super Cycle wave (b) may be complete, then this wave count expects Super Cycle wave (c) to begin and to move price below the end of Super Cycle wave (a) at 1,046.27.
The first zigzag in the double is labelled cycle wave w. The double is joined by a three in the opposite direction, a combination labelled cycle wave x. The second zigzag in the double is labelled cycle wave y.
The purpose of the second zigzag in a double is to deepen the correction. Cycle wave y has achieved this purpose.
Primary wave C within cycle wave y may be subdividing as an impulse. Intermediate waves (1) and (2) within primary wave C may be complete. Intermediate wave (3) may be nearing completion. No second wave correction within intermediate wave (3) may move beyond the start of its first wave below 1,672.80.
We should always assume the trend remains the same until proven otherwise. At this stage, Gold is in a bull market for the mid term.
MAIN DAILY CHART
Click chart to enlarge.
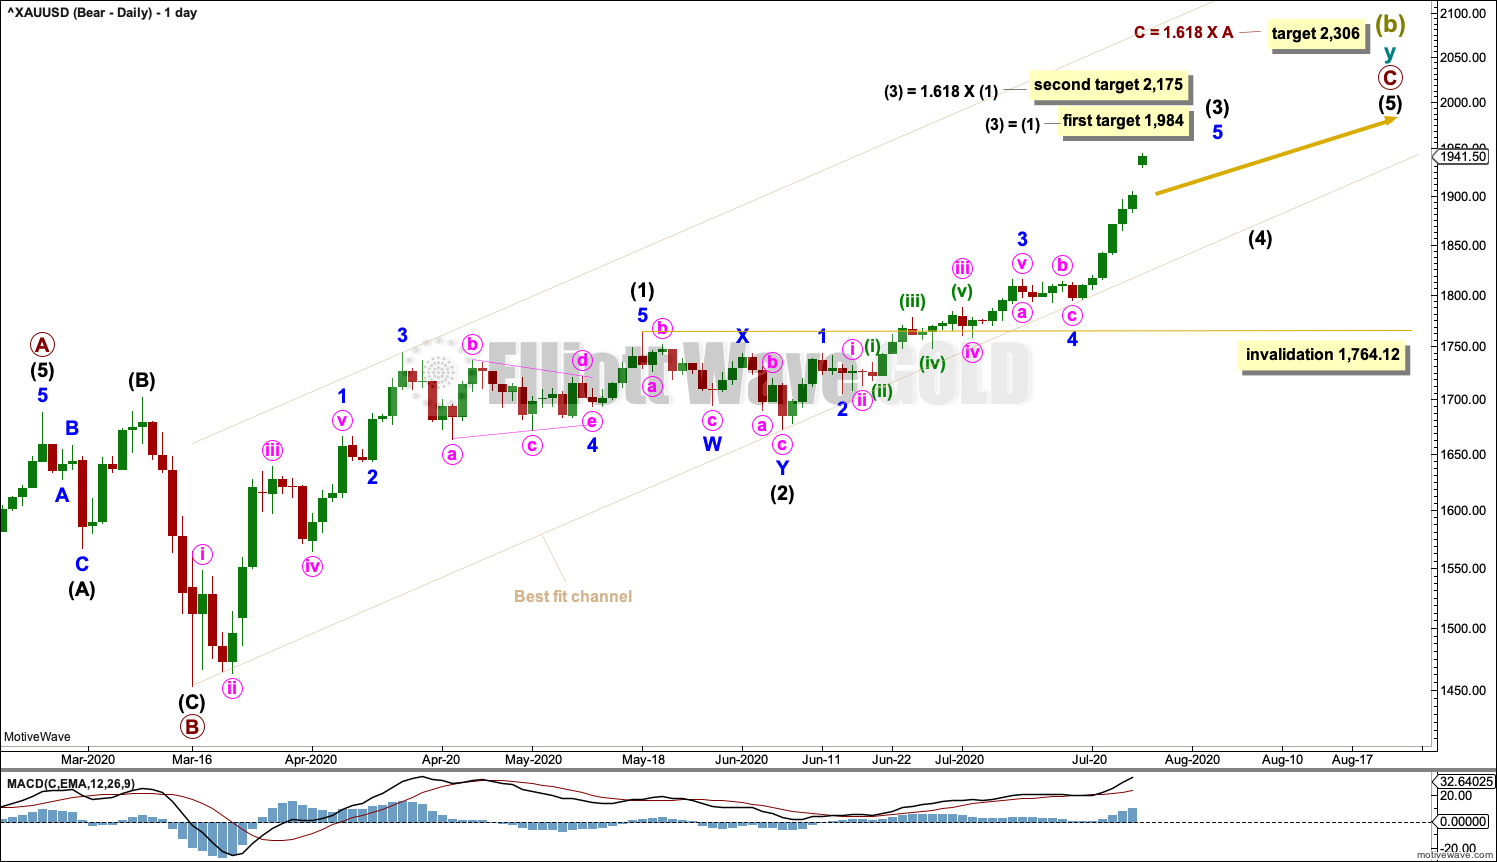
The daily chart shows detail of primary wave C as an incomplete impulse.
Intermediate waves (1) and (2) within primary wave C may be complete. Intermediate wave (3) may be incomplete.
Intermediate wave (4) may not move into intermediate wave (1) price territory below 1,764.12.
Draw a best fit channel about primary wave C as shown. The lower edge of the channel may continue to provide support to corrections along the way up. When intermediate wave (3) may be complete, then the channel will be redrawn using Elliott’s technique. The lower edge of the redrawn channel may provide support for intermediate wave (4).
A new second target is added today for intermediate wave (3) to end. If price reaches the first target and either the structure is incomplete or price keeps rising through it, then the second higher target would be used.
HOURLY CHART
Click chart to enlarge.
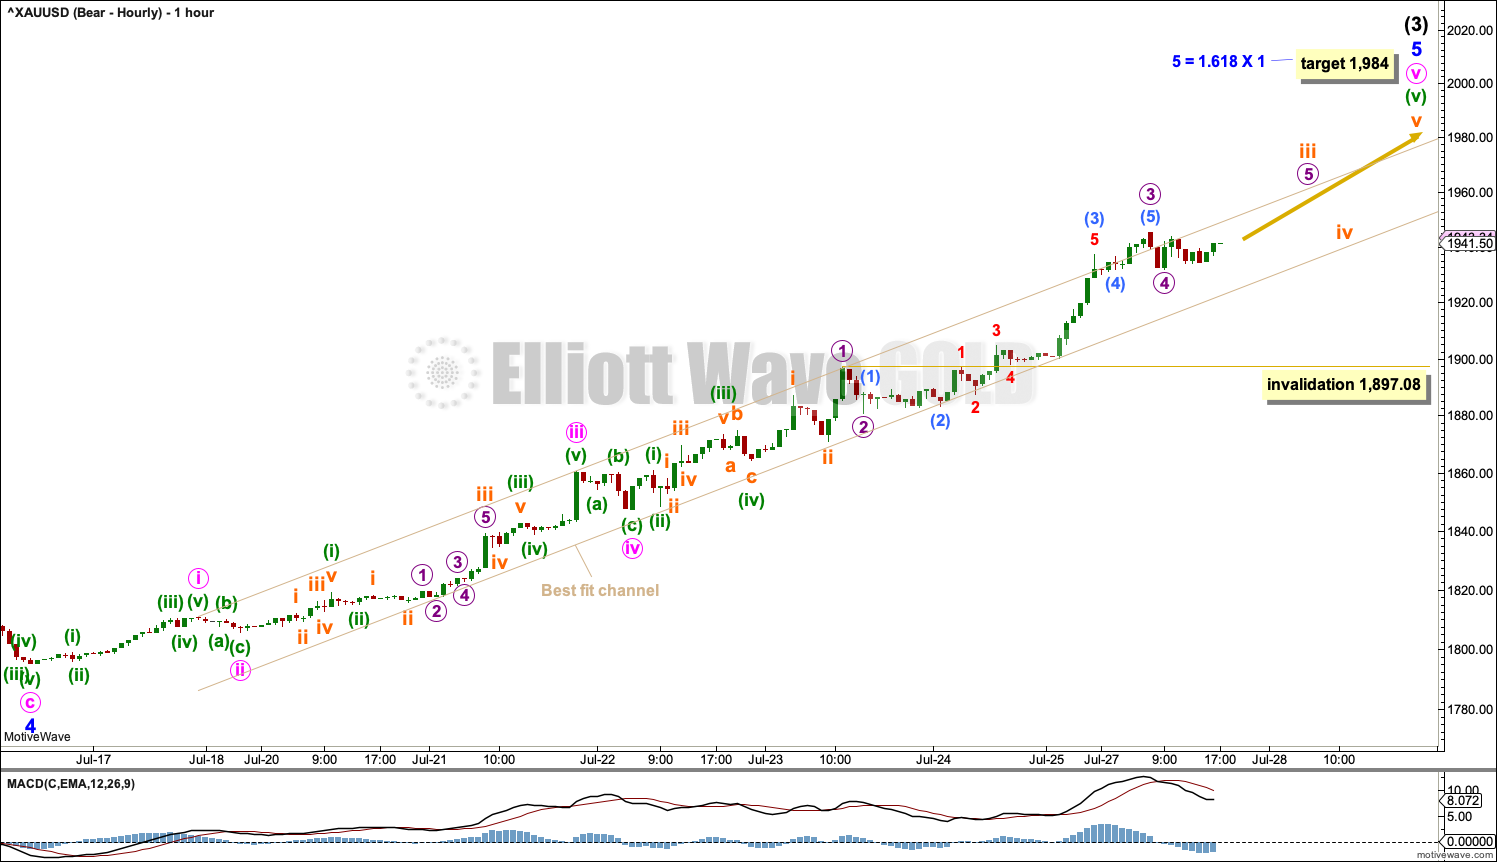
The hourly chart focusses on the detail of minor wave 5 within intermediate wave (3).
Always assume the trend remains the same until proven otherwise. Assume the upwards trend remains intact and this wave count is most likely while price remains within the channel on this hourly chart.
Minor wave 5 may be an incomplete impulse. Minute waves i through to iv within minor wave 5 may be complete.
Minute wave v to end minor wave 5 to end intermediate wave (3) may end with a blow off top.
Minuette wave (v) may be unfolding as an impulse, and it may have passed the middle. Now a series of third and fourth waves may come to an end. Micro wave 4 within subminuette wave iii within minuette wave (v) may not move into micro wave 1 price territory below 1,897.08.
ALTERNATE BULLISH ELLIOTT WAVE COUNT
WEEKLY CHART
Click chart to enlarge.
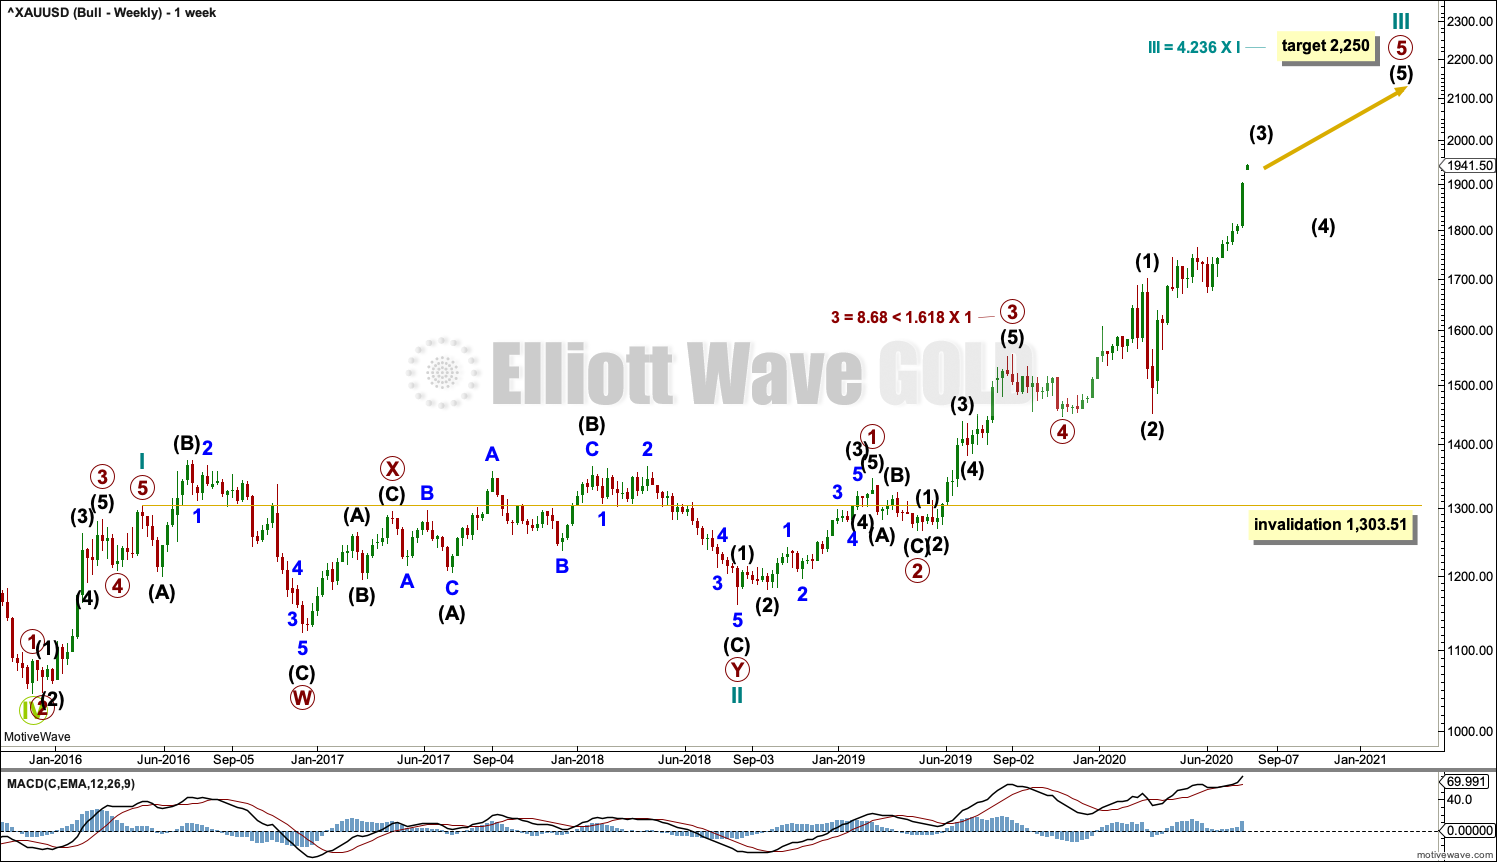
This wave count sees the the bear market complete at the last major low for Gold on 3 December 2015.
If Gold is in a new bull market, then it should begin with a five wave structure upwards on the weekly chart.
Cycle wave I fits as a five wave impulse with reasonably proportionate corrections for primary waves 2 and 4.
Cycle wave II fits as a double flat. However, within the first flat correction labelled primary wave W, this wave count needs to ignore what looks like an obvious triangle from July to September 2016 (this can be seen labelled as a triangle on the bear wave count above). This movement must be labelled as a series of overlapping first and second waves. Ignoring this triangle reduces the probability of this wave count in Elliott wave terms.
Within the first flat correction labelled primary wave W of the double flat of cycle wave II, intermediate wave (B) is 1.69 the length of intermediate wave (A). This is longer than the common range of up to 1.38, but within an allowable guideline of up to 2. The length of intermediate wave (B) reduces the probability of this wave count.
Cycle wave III may be incomplete. Cycle wave IV may not move into cycle wave I price territory below 1,303.51.
DAILY CHART
Click chart to enlarge.
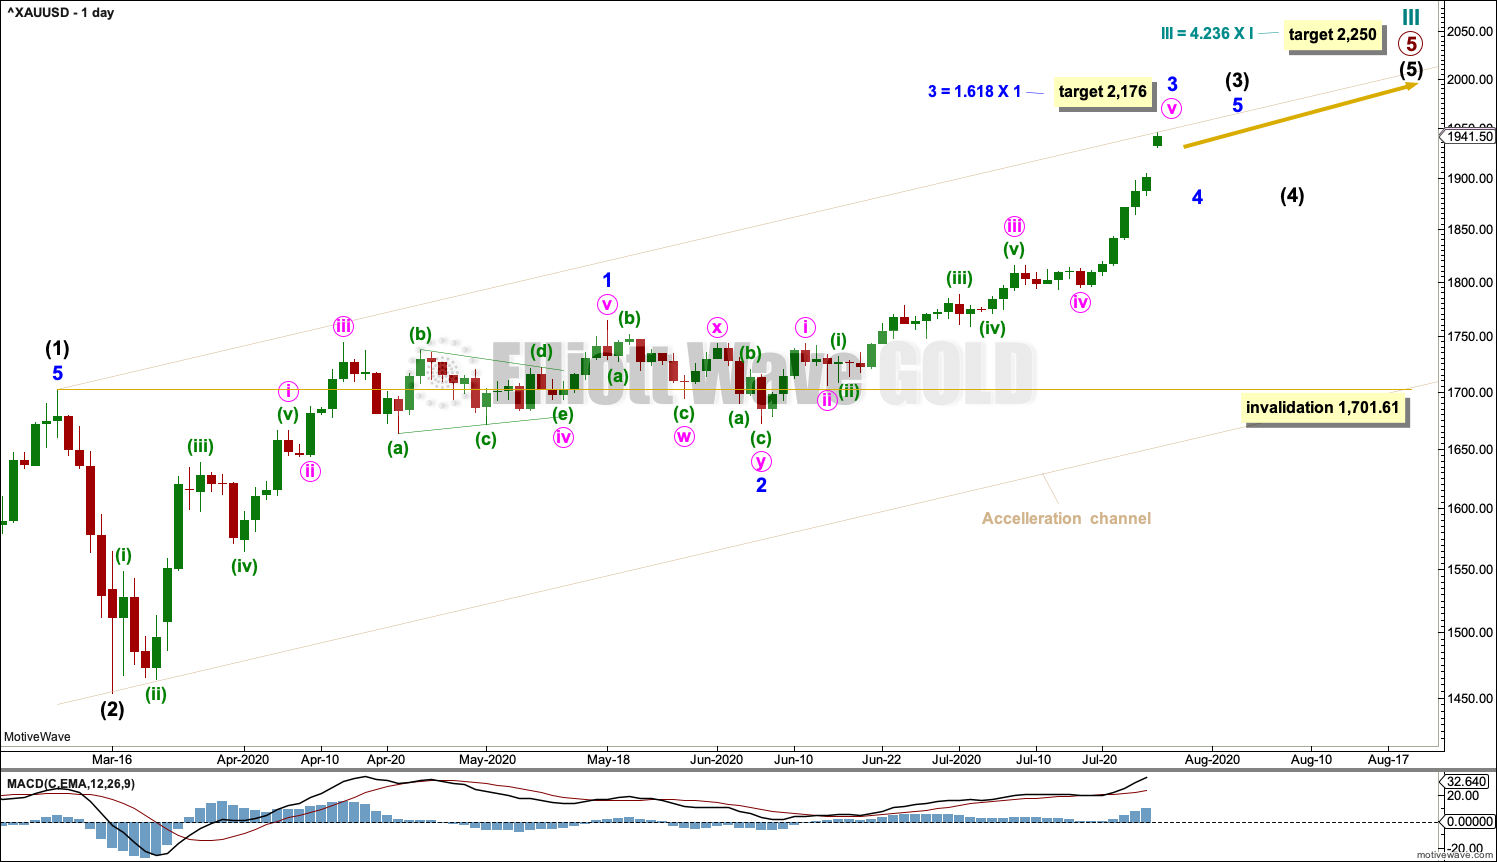
Cycle wave III may be continuing higher. The daily chart focusses on the end of primary wave 5 within cycle wave III.
Draw an acceleration channel about primary wave 5 as shown. Keep redrawing the channel as price continues higher. When intermediate wave (3) is over, then intermediate wave (4) may find support about the lower edge of the channel.
Intermediate wave (4) may not move into intermediate wave (1) price territory below 1,701.61.
Today the structure within intermediate wave (3) is relabelled. This labelling has no limit to the end of intermediate wave (3).
HOURLY CHART
Click chart to enlarge.
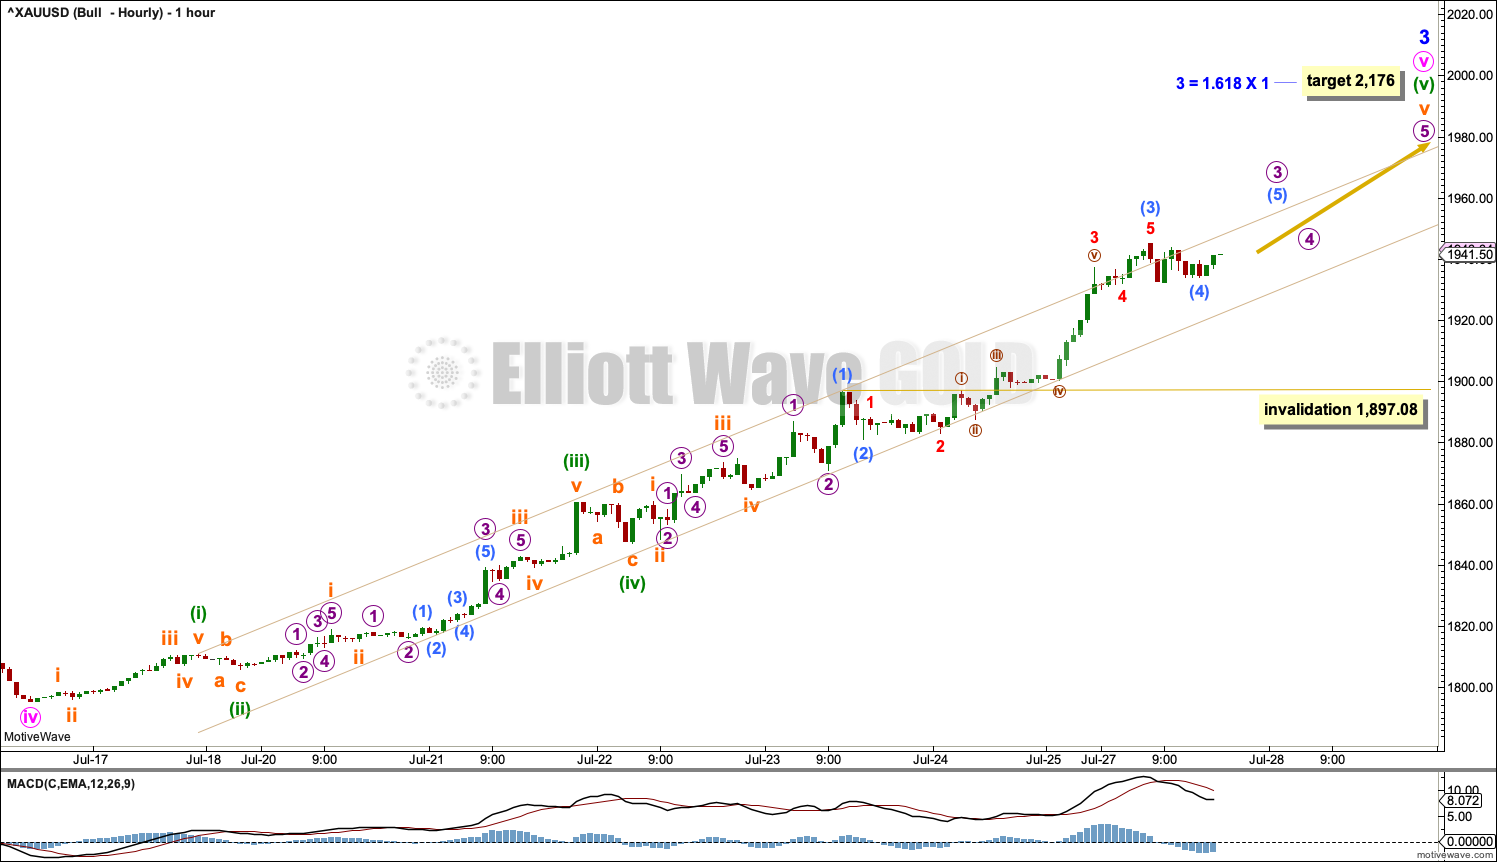
The hourly chart focusses on minute wave v within minor wave 3 within intermediate wave (3) within primary wave 5 within cycle wave III.
The channel is used in the same way for both hourly wave counts. Sub-micro wave (4) may not move into sub-micro wave (1) price territory below 1,897.08.
TECHNICAL ANALYSIS
WEEKLY CHART
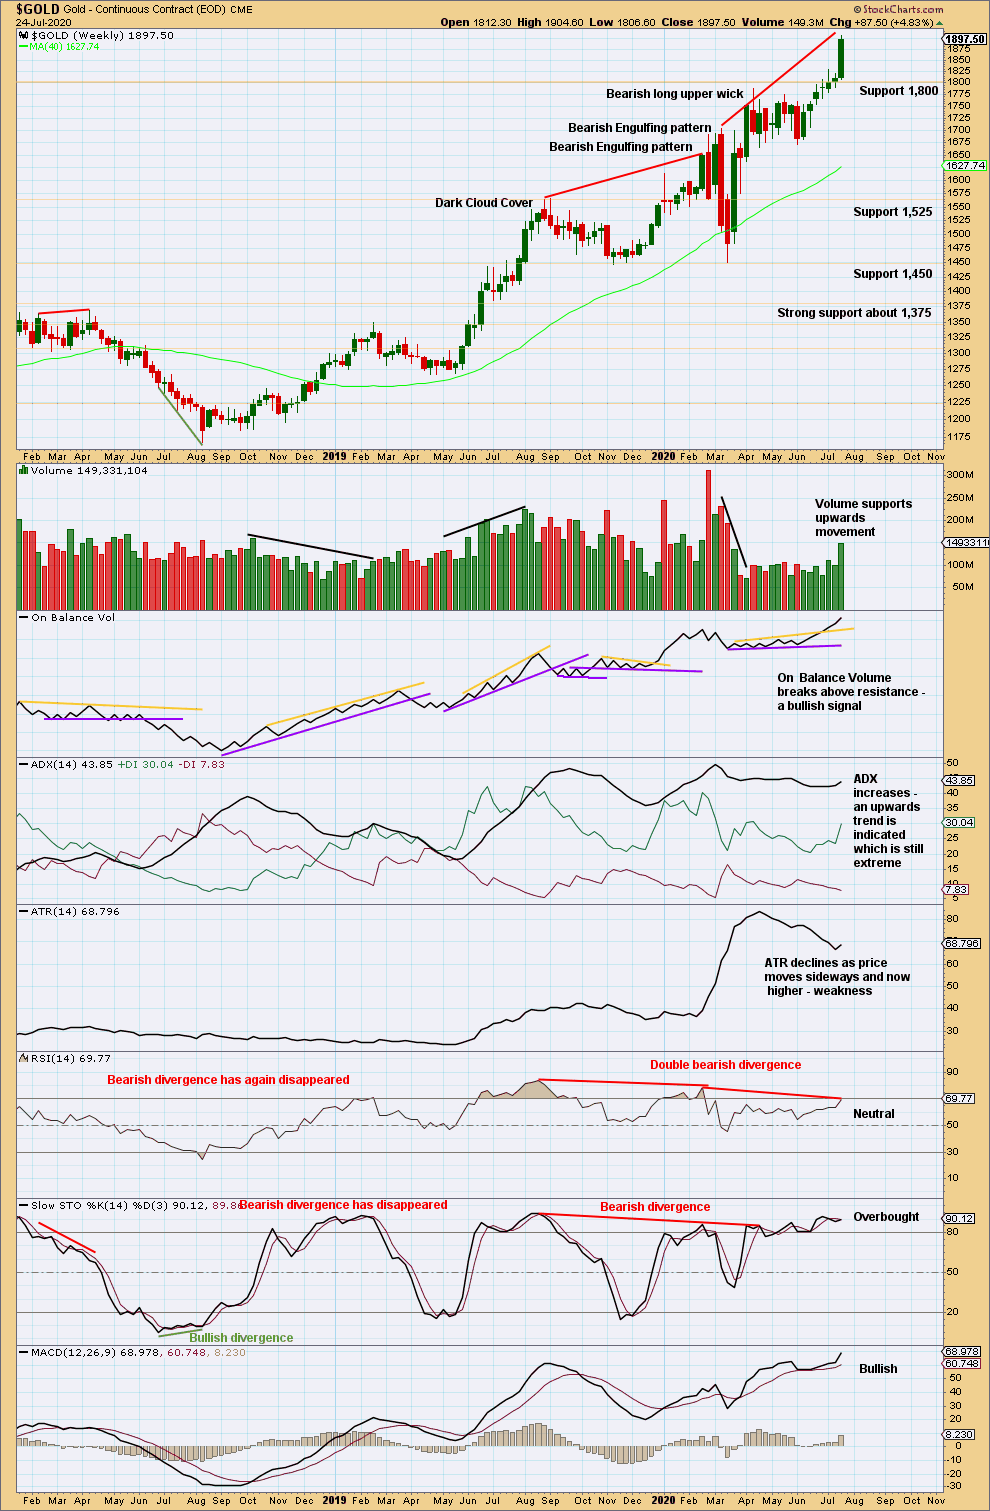
Click chart to enlarge. Chart courtesy of StockCharts.com.
An upwards breakout has support from volume and a bullish signal from On Balance Volume.
ADX remains extreme. RSI is not yet extreme, but it does still exhibit bearish divergence (sometimes this may simply disappear). There is room for this trend to continue.
DAILY CHART
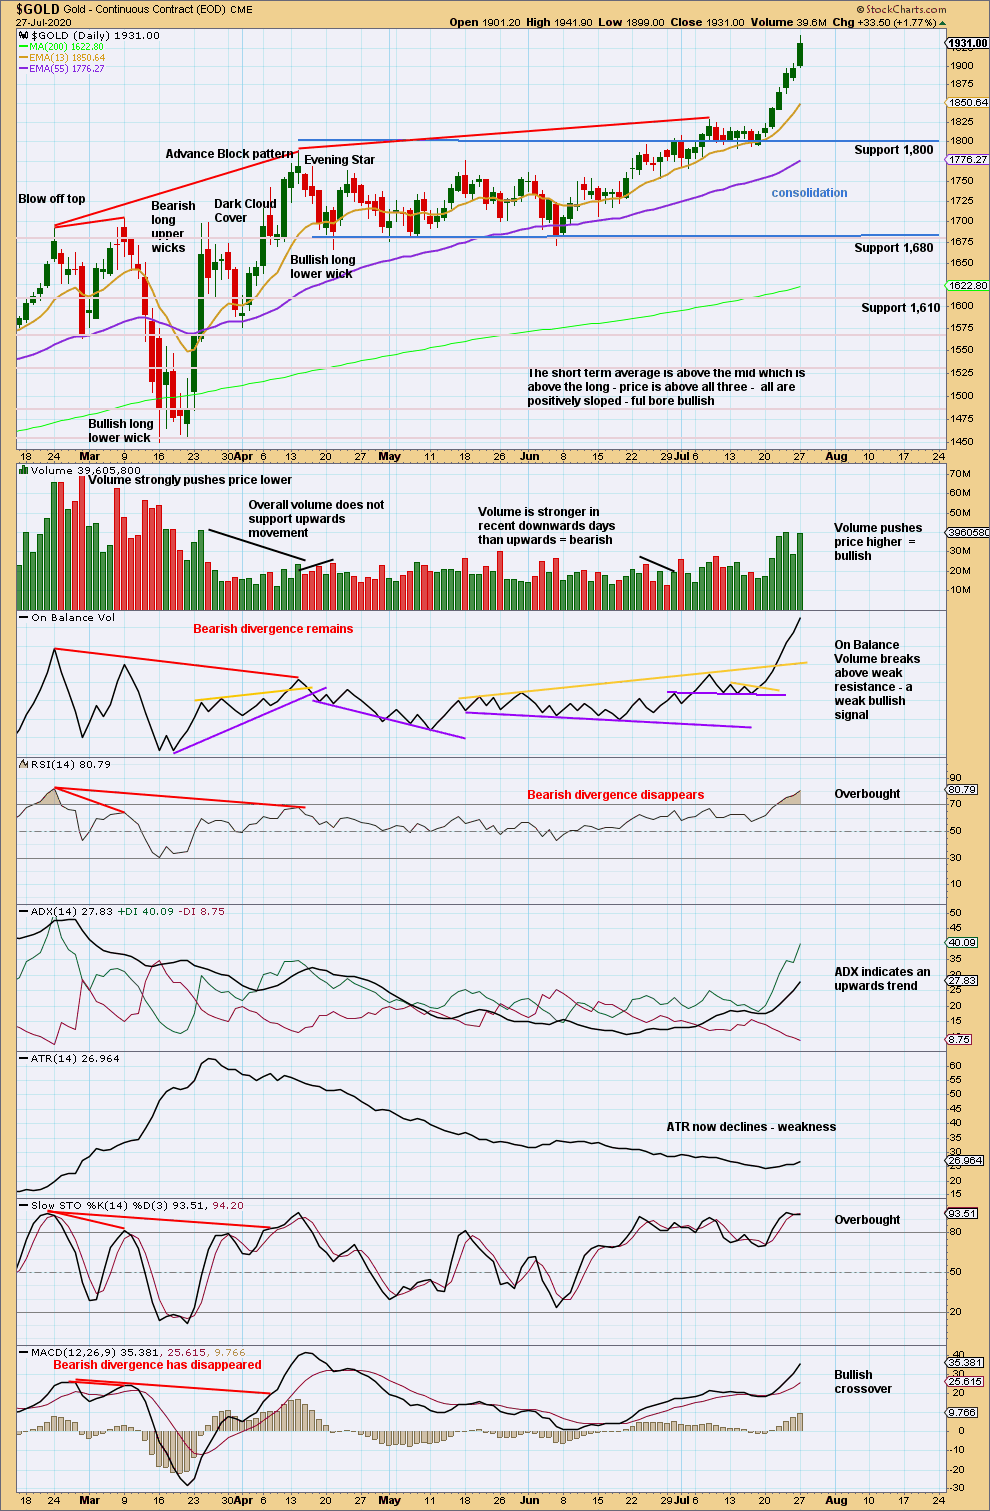
Click chart to enlarge. Chart courtesy of StockCharts.com.
A target calculated from the width of the consolidation is at 1,930. This has been met and exceeded.
RSI may reach more deeply overbought while price continues higher. ADX is not extreme at this time frame. There is room for this trend to continue.
Volume and range continues to increase. The trend has strength.
The last blow off top on this chart was the 24th of February. It ended with strength.
Another blow off top may be forming. It may continue for another one to very few days.
The reversal after blow off tops is usually sharp and quick. A bearish candlestick pattern would indicate a high in place at this stage.
GDX WEEKLY CHART
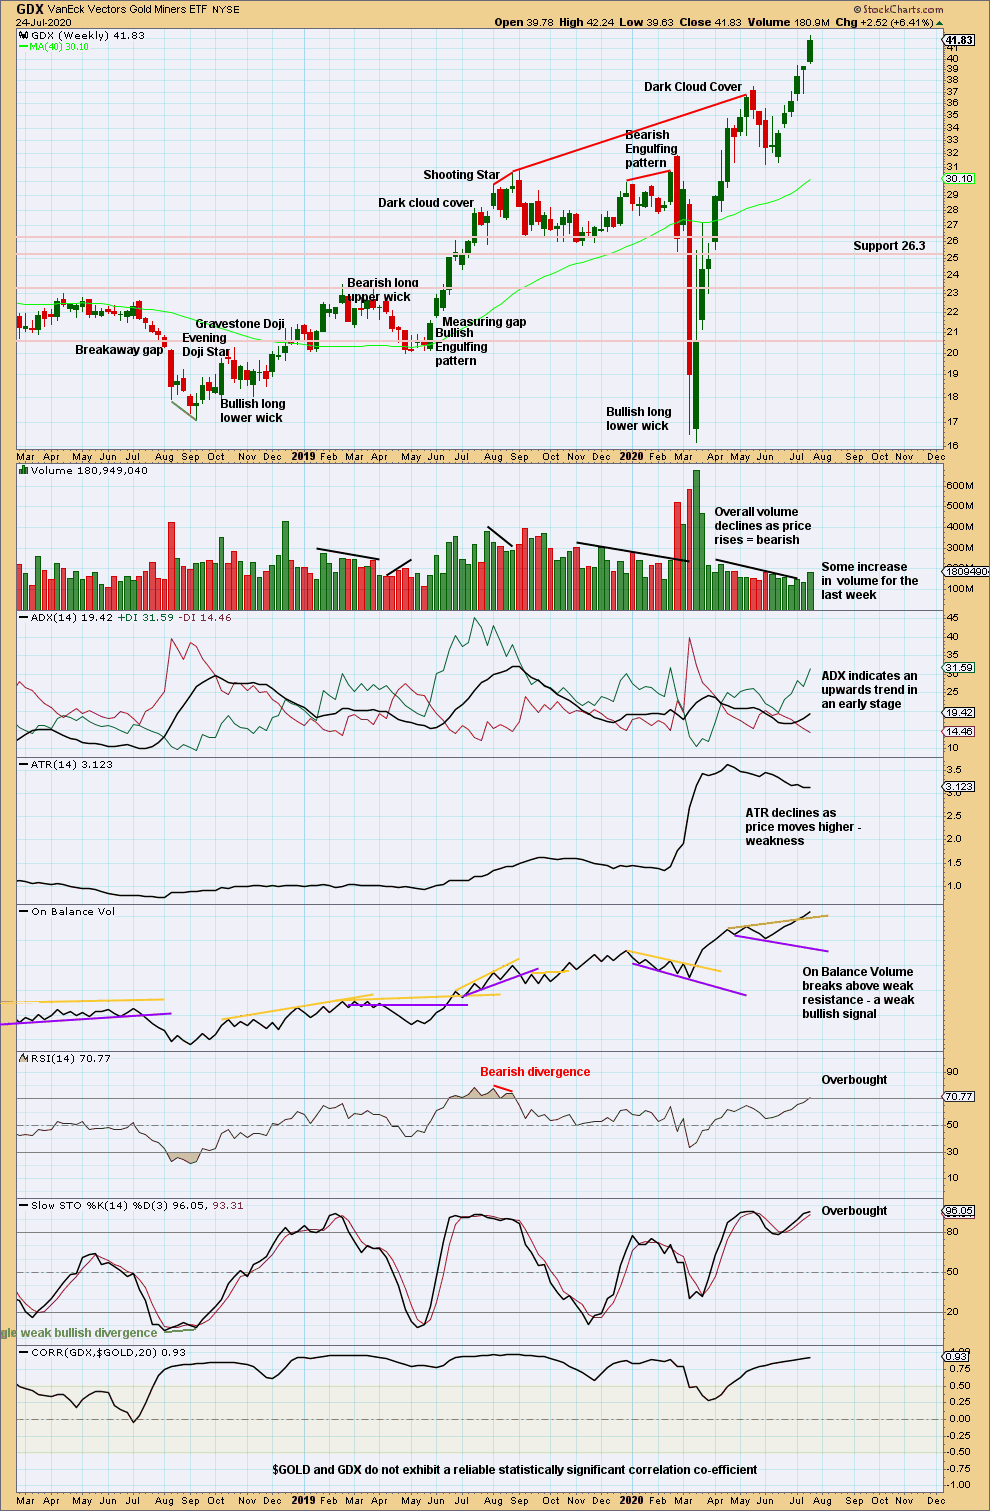
Click chart to enlarge. Chart courtesy of StockCharts.com.
There is an upwards trend. ADX is not extreme. RSI has only just reached into overbought. There is room for the trend to continue.
GDX DAILY CHART
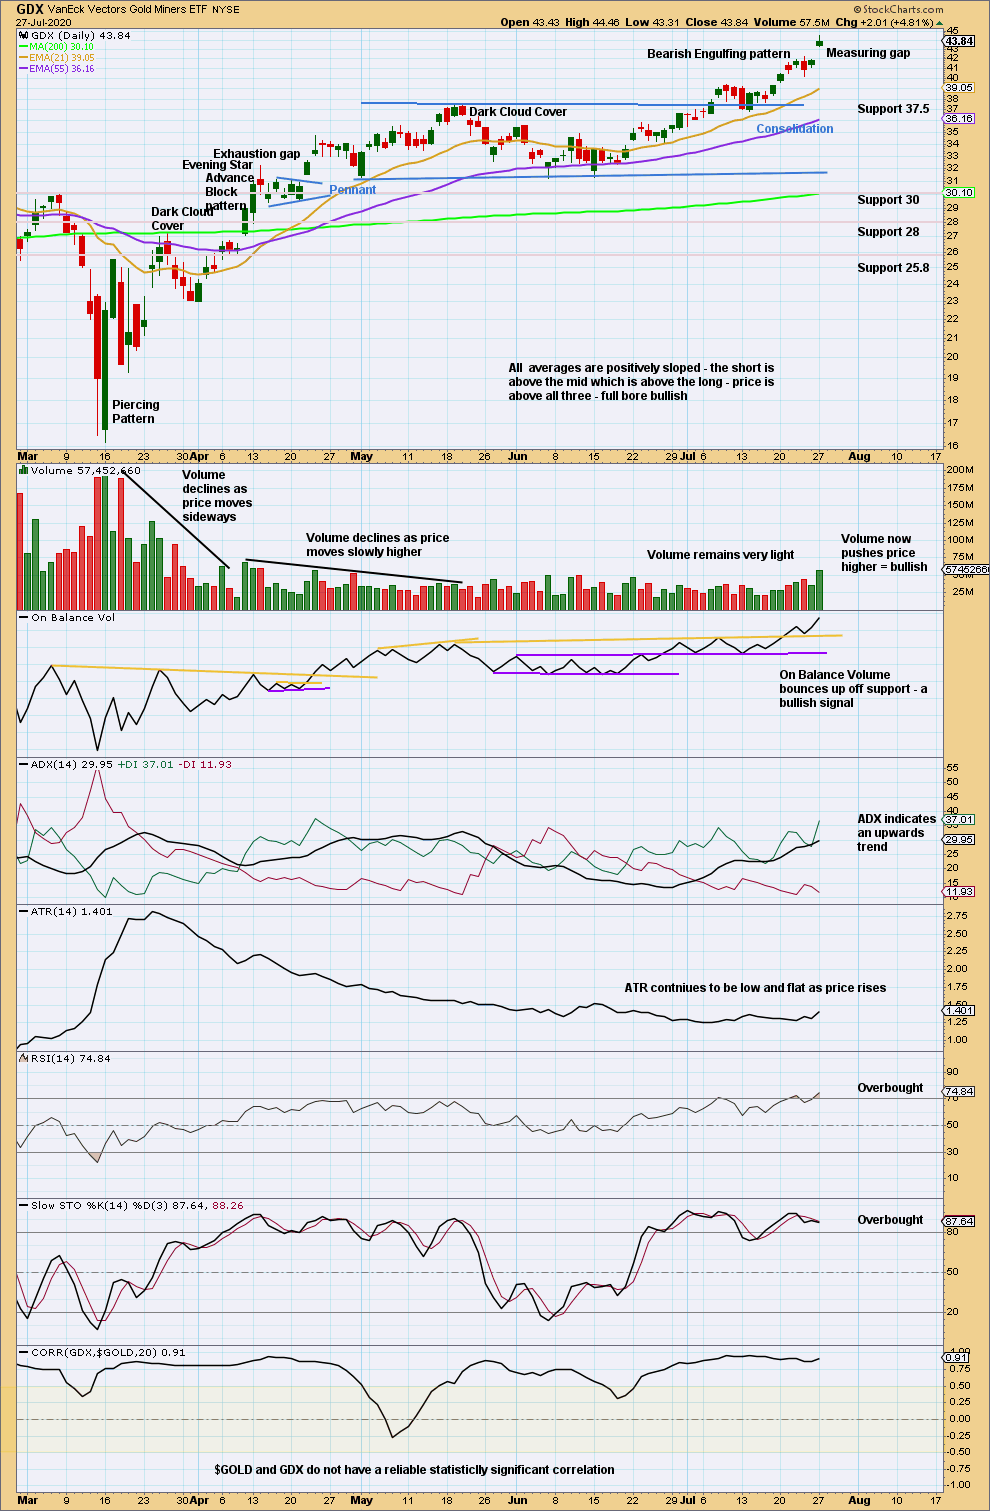
Click chart to enlarge. Chart courtesy of StockCharts.com.
A target calculated from the width of the consolidation zone is at 43.78. This is met and exceeded.
The measuring gap gives a new target calculation at 48.68.
Published @ 07:27 p.m. ET.
—
Careful risk management protects your trading account(s).
Follow my two Golden Rules:
1. Always trade with stops.
2. Risk only 1-5% of equity on any one trade.
—
New updates to this analysis are in bold.