
Lara’s Weekly: Elliott Wave and Technical Analysis of S&P500 and Gold and US Oil | Charts – August 28, 2020

S&P 500
Upwards movement continues. The final target remains the same at the end of this week.
Breadth and volatility are sounding increasingly strong warnings.
Summary: A target for upwards movement to end is at 3,800.
For the short term, a pullback or consolidation may begin about 3,520. The bearish alternate (second wave count, daily alternate chart) considers the possibility that a huge trend change may happen about 3,520.
There is now a strong cluster of bearish divergence between price and the AD line, and price and VIX. With RSI now extreme, the warning that a large bearish move may be closer is getting louder. Risk management is extremely important in this type of environment. It is looking now like a blow off top or bubble may be forming. Either alternate wave count may outline this possibility.
Confidence points for downwards movement are 3,354.68 and 2,637.01. Further confidence in a sustainable high may be had as each price point is passed.
A new low below 2,191.86 would be extremely bearish.
The biggest picture, Grand Super Cycle analysis, is here.
Last monthly charts are here. Video is here.
ELLIOTT WAVE COUNTS
FIRST WAVE COUNT
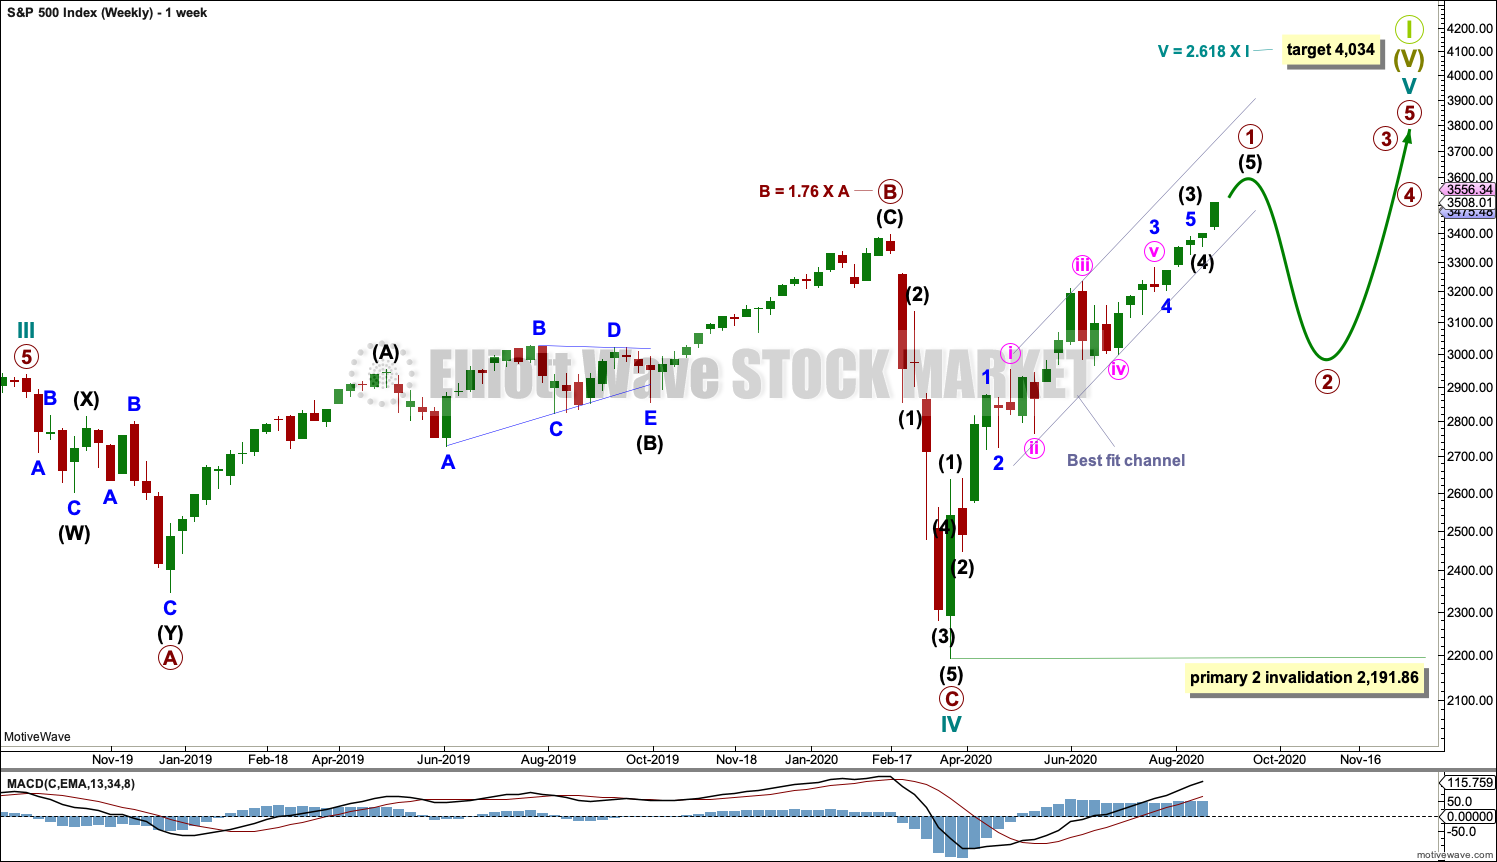
WEEKLY CHART
Click chart to enlarge.
Cycle wave V may last from one to several years. So far it has lasted 5 months.
Cycle wave V would most likely subdivide as an impulse. But if overlapping develops, then an ending diagonal should be considered. This chart considers the more common impulse.
Primary wave 1 may be incomplete. Primary wave 2 may not move beyond the start of primary wave 1 below 2,191.86.
There is already a Fibonacci ratio between cycle waves I and III within Super Cycle wave (V). The S&P500 often exhibits a Fibonacci ratio between two of its actionary waves but rarely between all three; it is less likely that cycle wave V would exhibit a Fibonacci ratio. The target for Super Cycle wave (V) to end would best be calculated at primary degree, but that cannot be done until all of primary waves 1, 2, 3 and 4 are complete. The target at 4,034 is provisional, so it may change.
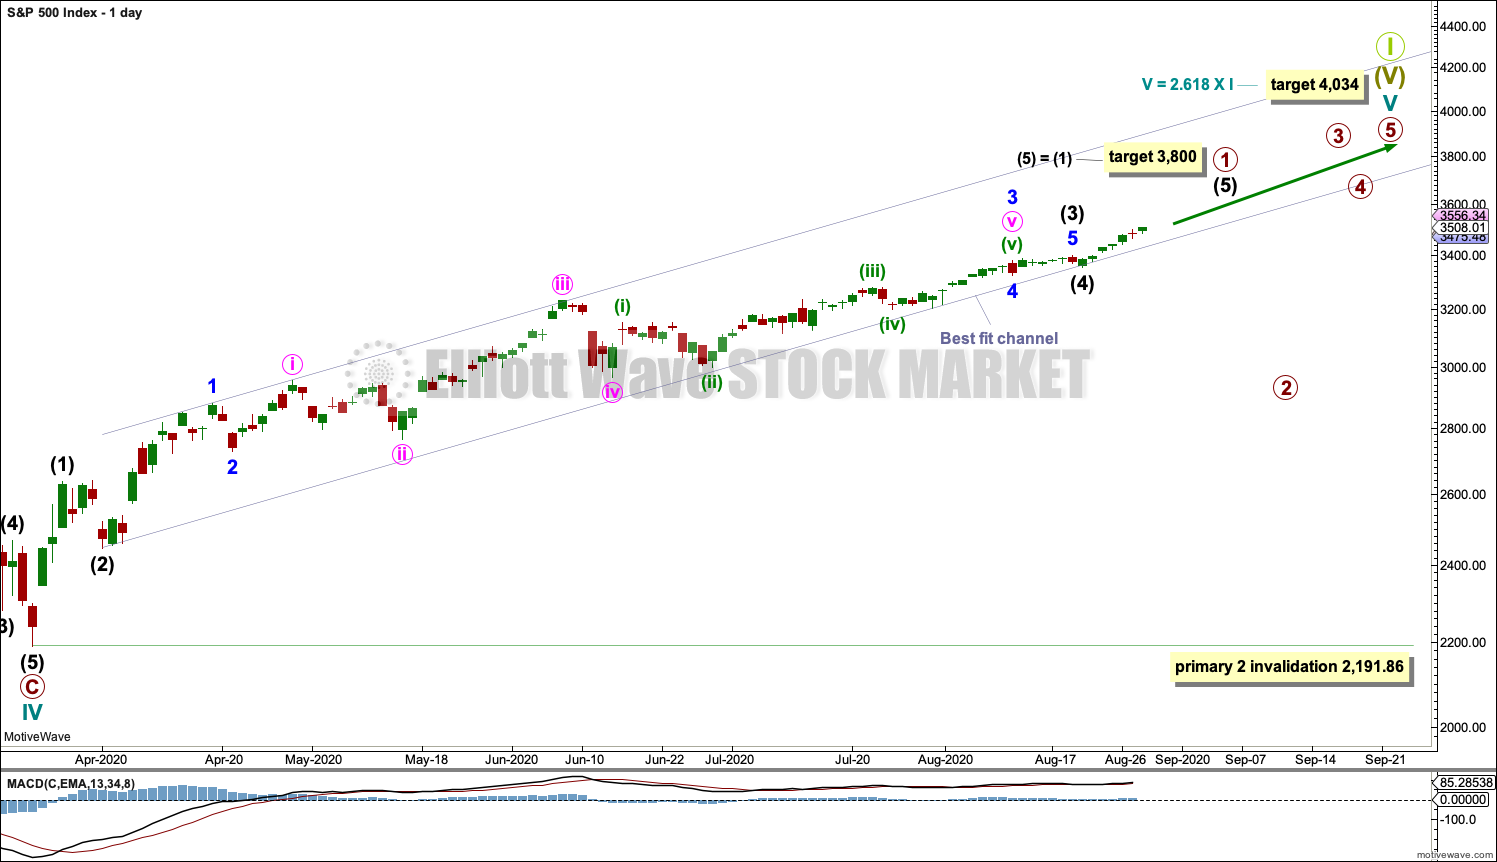
DAILY CHART
Click chart to enlarge.
A target is calculated for intermediate wave (5) to complete primary wave 1, based upon the most common Fibonacci ratio to intermediate wave (1).
The best fit channel contains all of primary wave 1.
When this best fit channel is breached by a full daily candlestick below and not touching the lower edge, then that may be taken as an indication that primary wave 1 may be over and primary wave 2 may have begun.
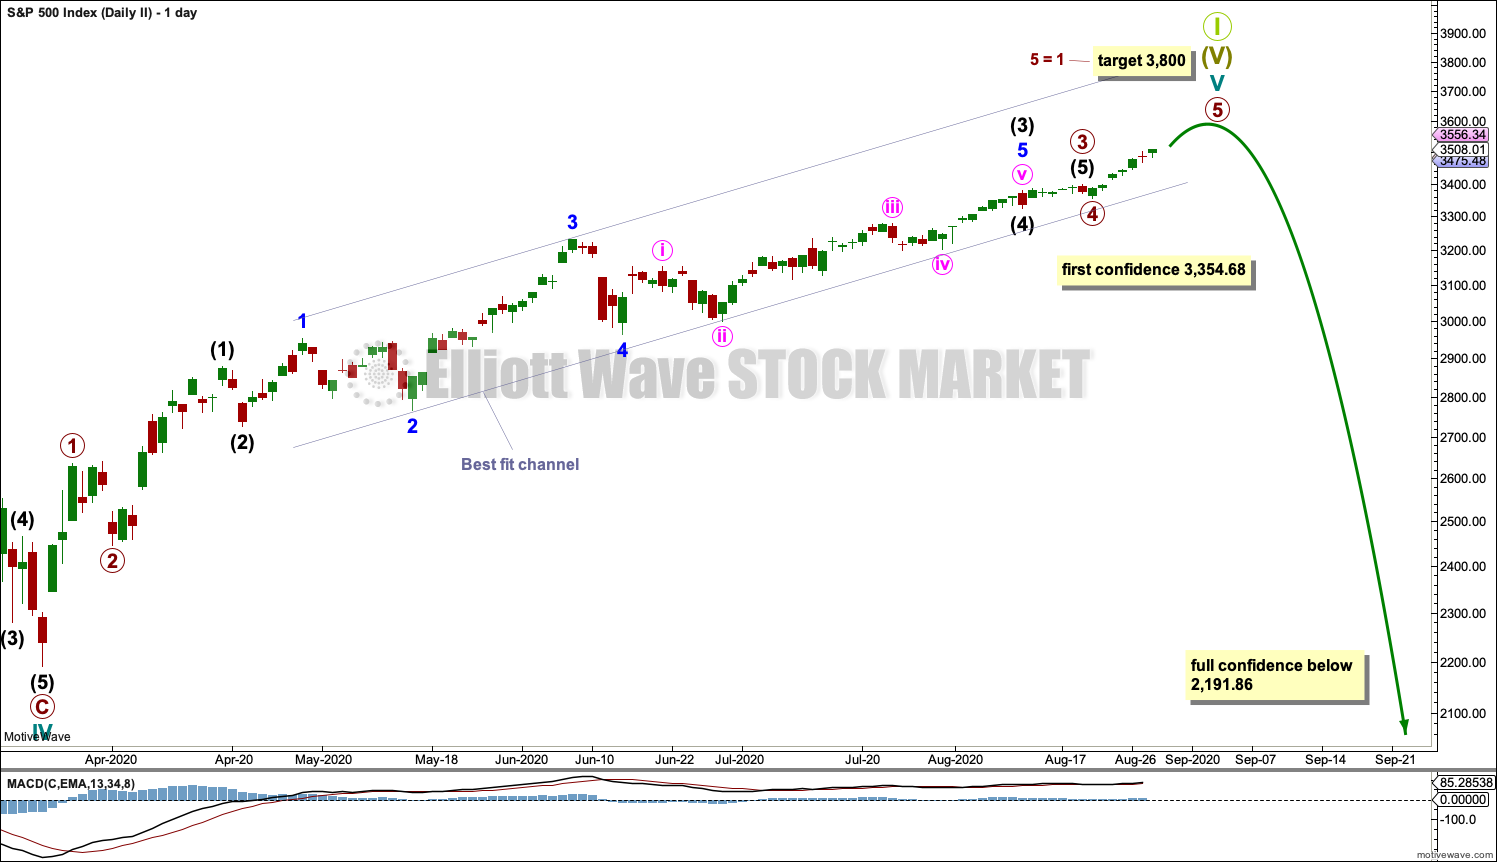
SECOND WAVE COUNT
DAILY CHART
Click chart to enlarge.
This wave count is the same as the first wave count with the exception of the degree of labelling within cycle wave V. If the degree of labelling is moved up one degree, then it is possible that cycle wave V to end Super cycle wave (V) to end Grand Super Cycle wave I is very close to completion.
Primary waves 1 through to 4 within cycle wave V may be complete. Primary wave 5 may be almost complete.
A new low below 3,354.68 would indicate at least a short-term trend change.
A new low below 2,191.86 would add full confidence in this wave count. At that stage, the first wave count would be invalidated.
TECHNICAL ANALYSIS
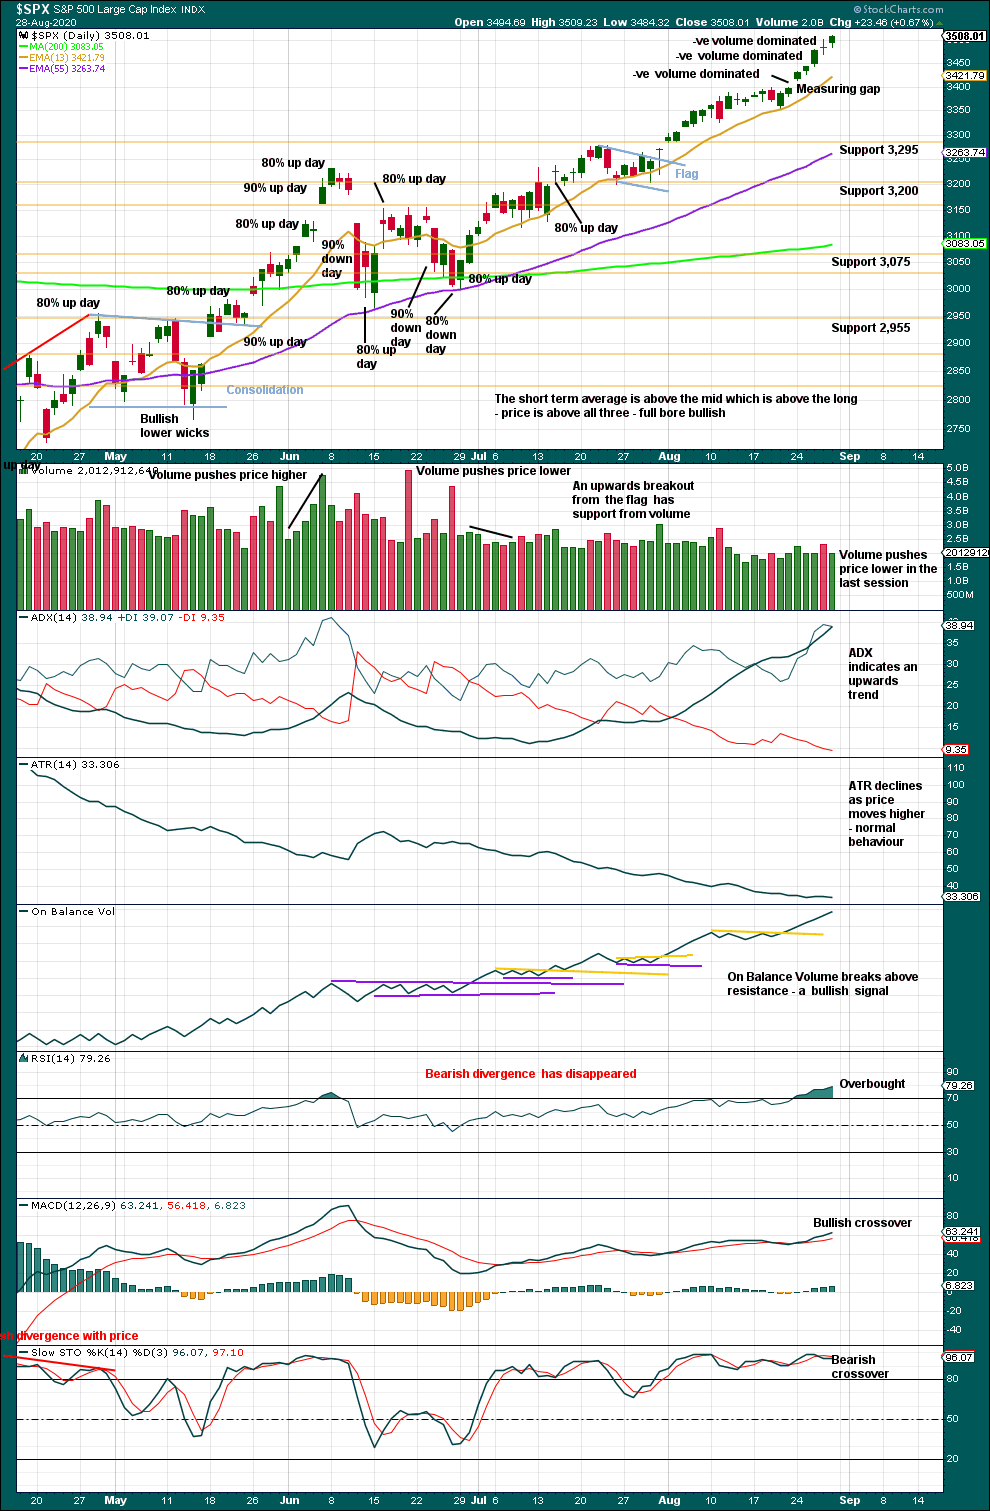
WEEKLY CHART

Click chart to enlarge. Chart courtesy of StockCharts.com.
The measuring gap gives a target calculation at 3,813.35.
ADX is not extreme. RSI is not overbought. There is room for this upwards trend to continue.
However, there remains weakness in longer-term bearish divergence between price and RSI.
DAILY CHART
Click chart to enlarge. Chart courtesy of StockCharts.com.
Assume the trend remains the same, upwards, until proven otherwise.
However, bearish warnings are becoming louder. RSI is reaching more deeply overbought. 3 of the last 6 upwards days exhibit negative volume dominating total up / down volume. The upwards slope is increasing; a blow off top may possibly be forming. These are usually followed by sharp reversals. Risk of a sharp pullback or a trend change is increasing.
BREADTH – AD LINE
WEEKLY CHART
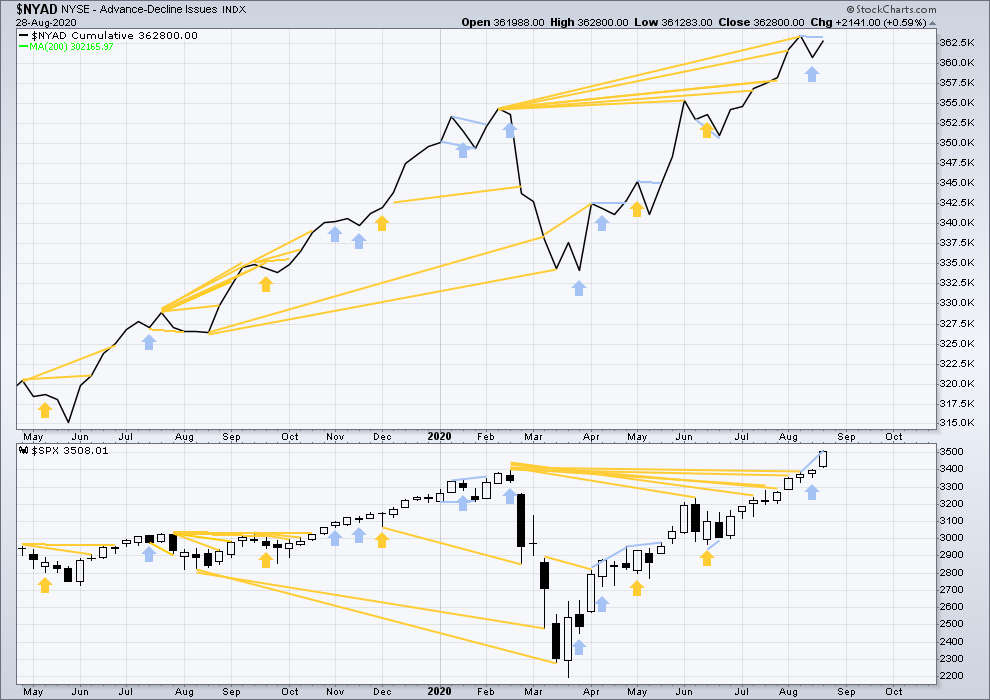
Click chart to enlarge. Chart courtesy of StockCharts.com. So that colour blind members are included, bearish signals will be noted with blue and bullish signals with yellow.
Breadth should be read as a leading indicator.
Lowry’s Operating Companies Only AD line has still not made new all time highs. The last high for the OCO AD line was in the week beginning January 13, 2020. There is now 7 and a half months of bearish divergence between price and the OCO AD line. This may now support the more bearish second wave count. It is possible now that a major trend change may occur.
The NYSE All Issues AD line made new highs in the week beginning 1st of June.
This week both price and the AD line have moved higher, but while price has made a new high the AD line has not. This divergence is bearish for the short term.
Large caps all time high: 3,509.23 on 28th August 2020.
Mid caps all time high: 2,109.43 on 20th February 2020.
Small caps all time high: 1,100.58 on 27th August 2018.
Again, this week only large caps made new all time highs. This rise is led by large caps, which is a feature of an aged bull market.
DAILY CHART
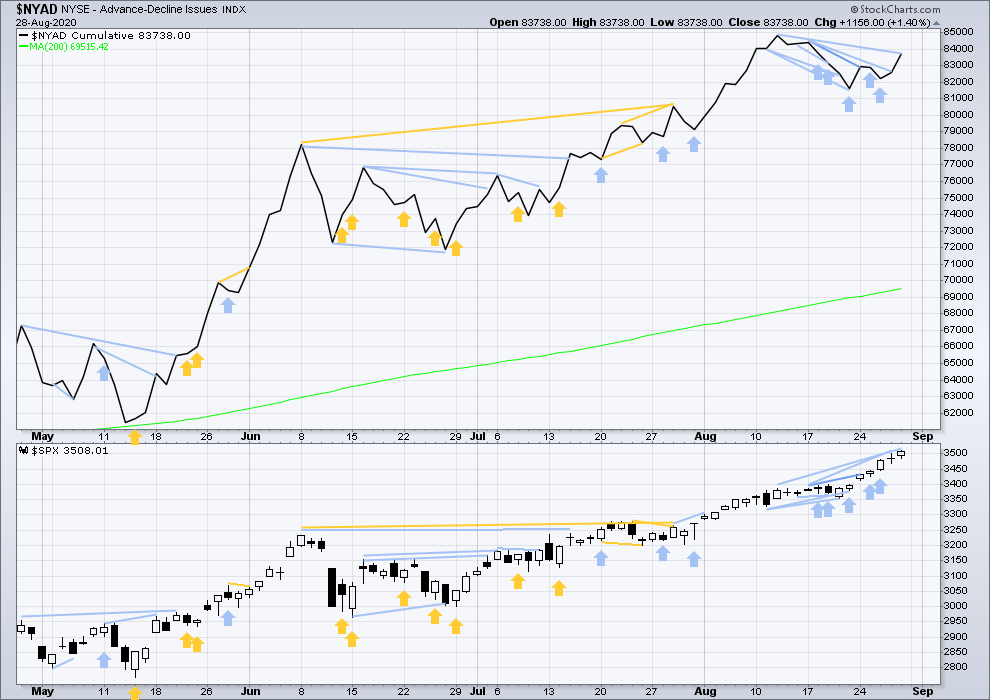
Click chart to enlarge. Chart courtesy of StockCharts.com. So that colour blind members are included, bearish signals will be noted with blue and bullish signals with yellow.
Again, today price has made another new all time high, but the AD line has not. This divergence is bearish.
There is now a fairly strong cluster of bearish signals now from the AD line, a multi-week pullback may now be very close.
VOLATILITY – INVERTED VIX CHART
WEEKLY CHART
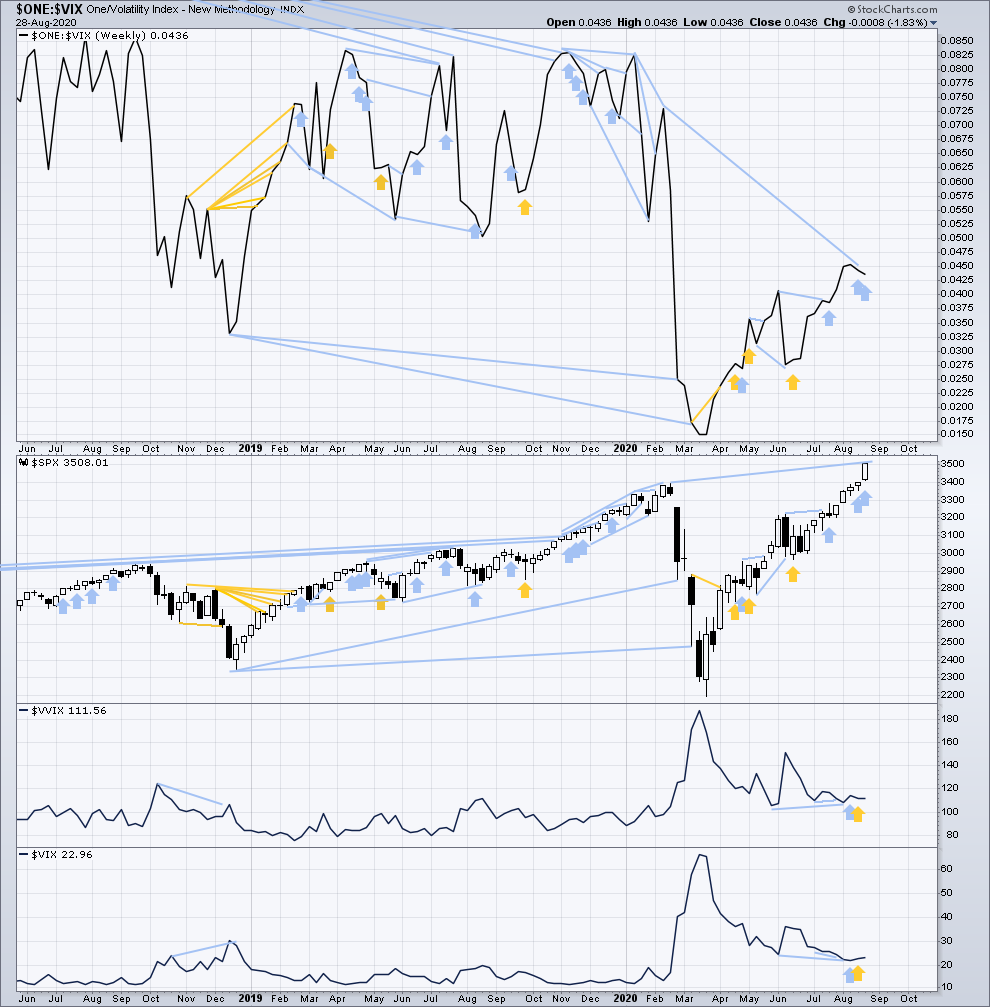
Click chart to enlarge. Chart courtesy of StockCharts.com. So that colour blind members are included, bearish signals will be noted with blue and bullish signals with yellow.
Inverted VIX remains well below all time highs. The all time high for inverted VIX was in the week beginning October 30, 2017. There is nearly 3 years of bearish divergence between price and inverted VIX. There is all of long, mid and short-term bearish divergence.
Price has moved higher for the last two weeks, but inverted VIX has moved lower. This divergence is bearish.
Comparing VIX and VVIX: From weeks beginning 1st June to two weeks ago, VIX has made new lows as price has made new highs, but VVIX has failed to make corresponding new lows with VIX. VVIX remains slightly elevated. This divergence is not strong, but it is bearish for price.
DAILY CHART
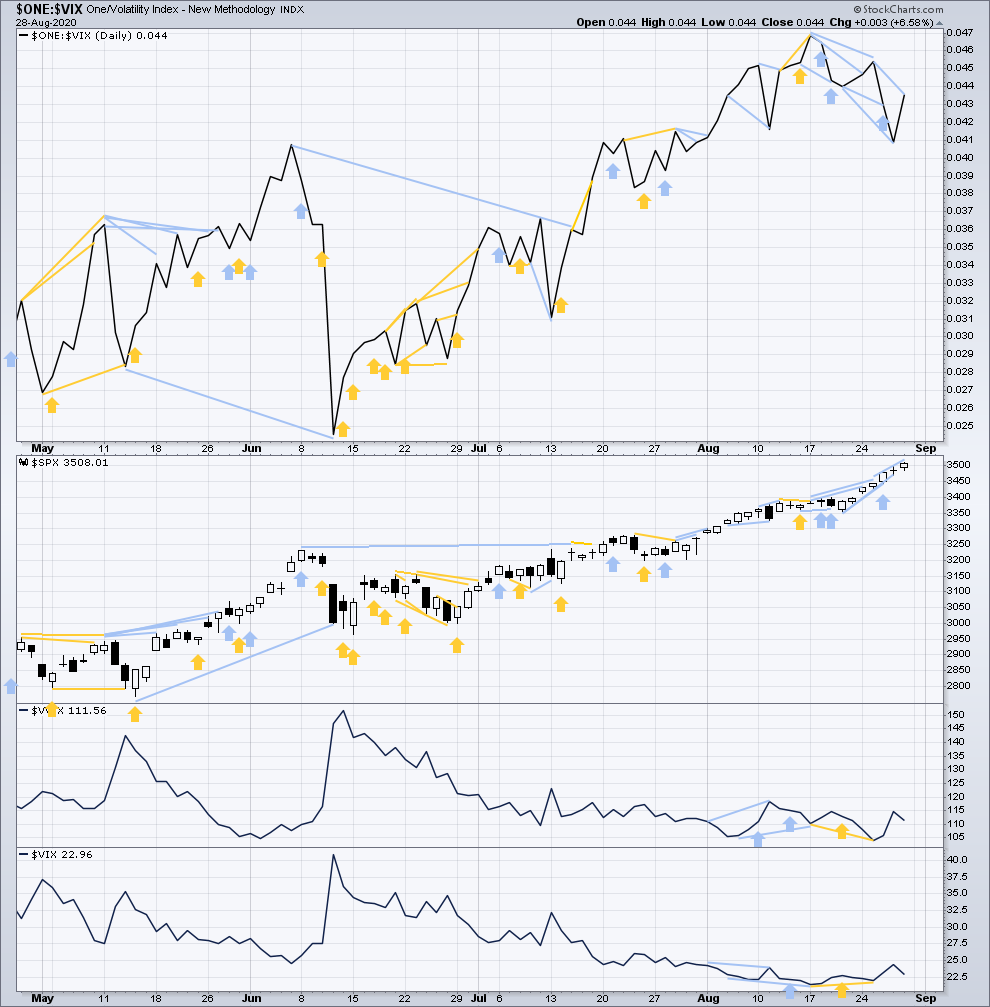
Click chart to enlarge. Chart courtesy of StockCharts.com. So that colour blind members are included, bearish signals will be noted with blue and bullish signals with yellow.
Price has moved higher to make a new all time high, but inverted VIX has failed to make a new short-term high. This divergence is bearish.
Comparing VIX and VVIX at the daily chart level: Both remain elevated. This is bearish for price.
DOW THEORY
Dow Theory still concludes a bear market is in place.
Dow Theory confirmed a bear market with the following lows made on a closing basis:
DJIA: 21,712.53 – a close below this point was been made on the March 12, 2020.
DJT: 8,636.79 – a close below this point was been made on March 9, 2020.
Adding in the S&P and Nasdaq for an extended Dow Theory, a bear market was confirmed:
S&P500: 2,346.58 – a close below this point was made on March 20, 2020.
Nasdaq: 7,292.22 – a close below this point was made on the March 12, 2020.
At this time, to shift Dow Theory from viewing a bear market to confirmation of a new bull market would require new highs made on a closing basis:
DJIA: 29,568.57
DJT: 11,623.58
Adding in the S&P and Nasdaq for an extended Dow Theory, confirmation of a bull market would require new highs made on a closing basis:
S&P500: 3,393.52 – closed above on 21st August 2020.
Nasdaq: 9,838.37 – closed above on June 8, 2020.
GOLD
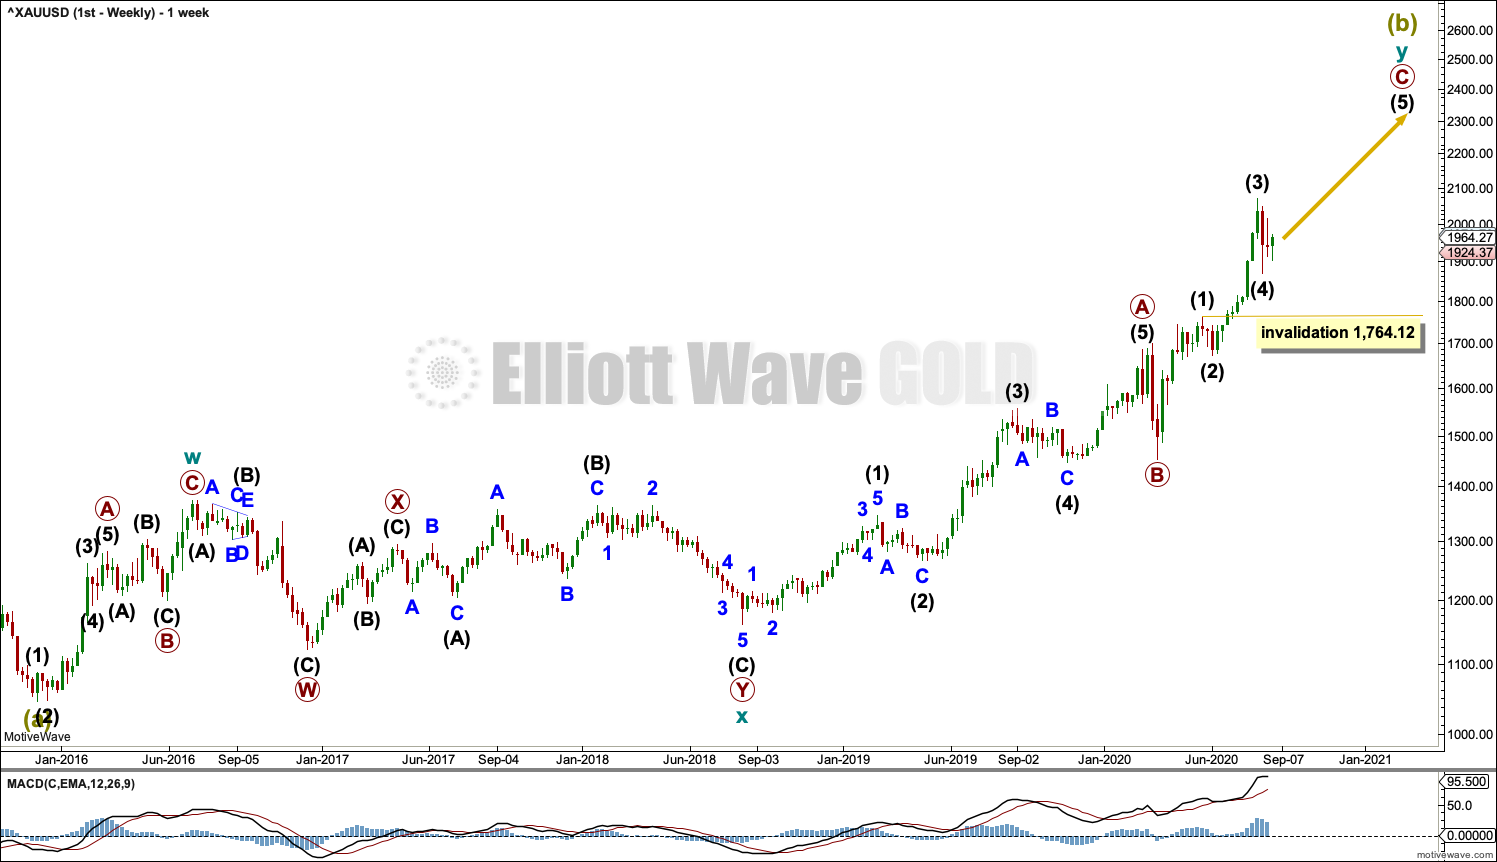
All three Elliott wave counts at the end of the week remain the same.
Summary: The pullback may be over. The upwards trend may resume. Alternatively, price may continue sideways for a few more days before the upwards trend resumes.
The next longer-term target is now at 2,180. A target calculated from a possible pennant is at 2,270.
A new low below 1,764.12 at any time frame would invalidate the first daily chart and add confidence in an alternate daily chart. At that stage, a sustainable high would be in place and either a cycle degree fourth wave or a Super Cycle degree C wave down may be underway.
Grand SuperCycle analysis is here.
Last analysis of monthly charts is here with video here.
FIRST ELLIOTT WAVE COUNT
WEEKLY CHART
Click chart to enlarge.
The bigger picture for this first Elliott wave count sees Gold as still within a bear market, in a three steps back pattern that is labelled Grand Super Cycle wave IV on monthly charts. The common range for Super Cycle wave (b) is from 1 to 1.38 times the length of Super cycle wave (a), giving a range from 1,920.18 to 2,252.27. The target would see Super Cycle wave (b) end within this most common range.
Super Cycle wave (b) within Grand Super Cycle wave IV may be an incomplete double zigzag. When Super Cycle wave (b) may be complete, then this wave count expects Super Cycle wave (c) to begin and to move price below the end of Super Cycle wave (a) at 1,046.27.
The first zigzag in the double is labelled cycle wave w. The double is joined by a three in the opposite direction, a combination labelled cycle wave x. The second zigzag in the double is labelled cycle wave y.
The purpose of the second zigzag in a double is to deepen the correction. Cycle wave y has achieved this purpose.
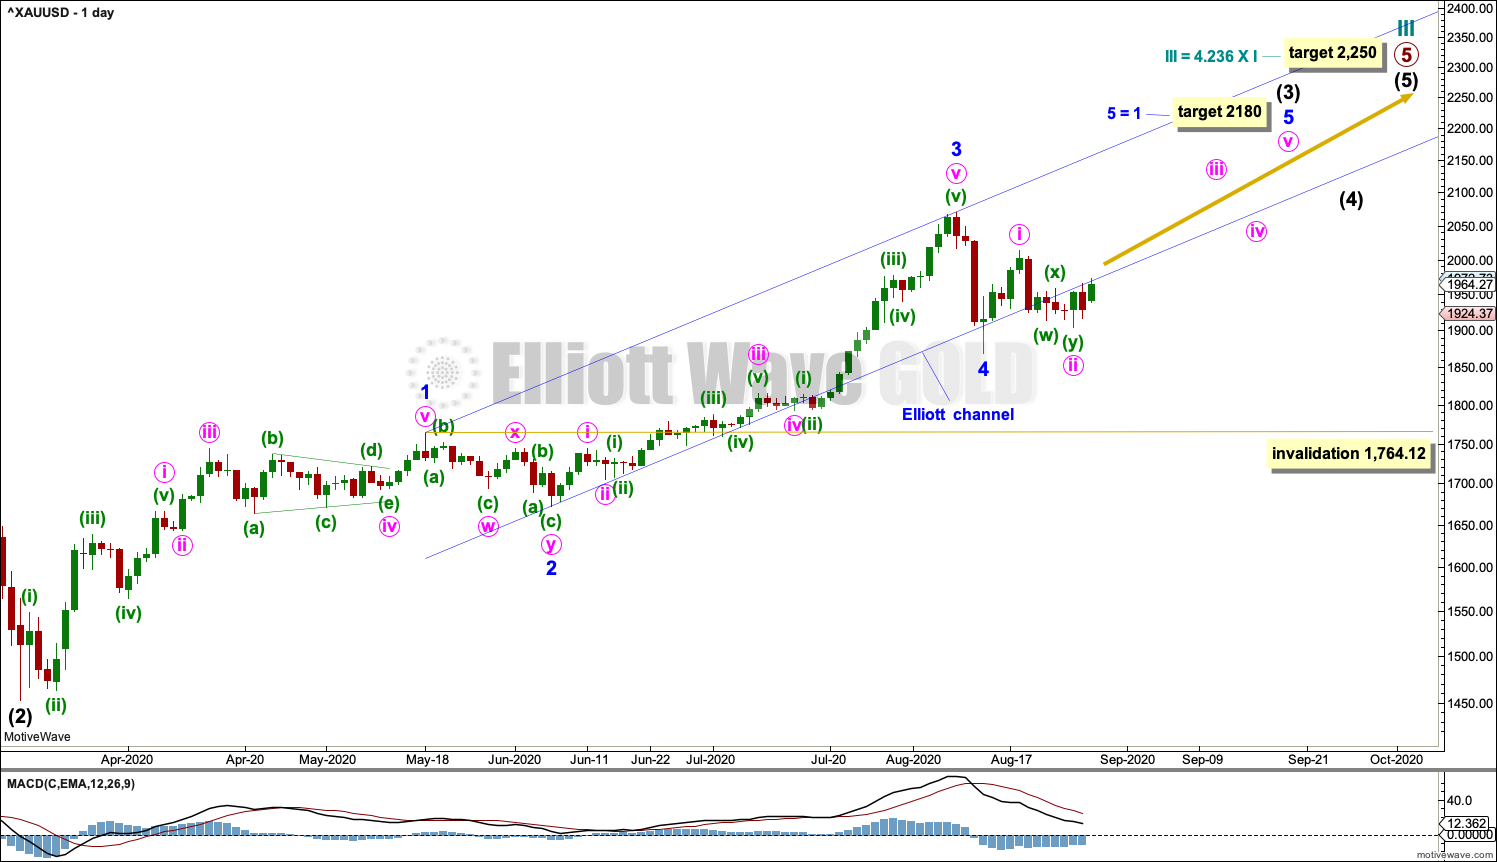
Primary wave C within cycle wave y may be subdividing as an impulse. Intermediate waves (1) through to (4) within primary wave C may be complete. If it continues any lower, then intermediate wave (4) may not move into intermediate wave (1) price territory below 1,764.12.
We should always assume the trend remains the same until proven otherwise. At this stage, Gold is in a bull market.
DAILY CHART
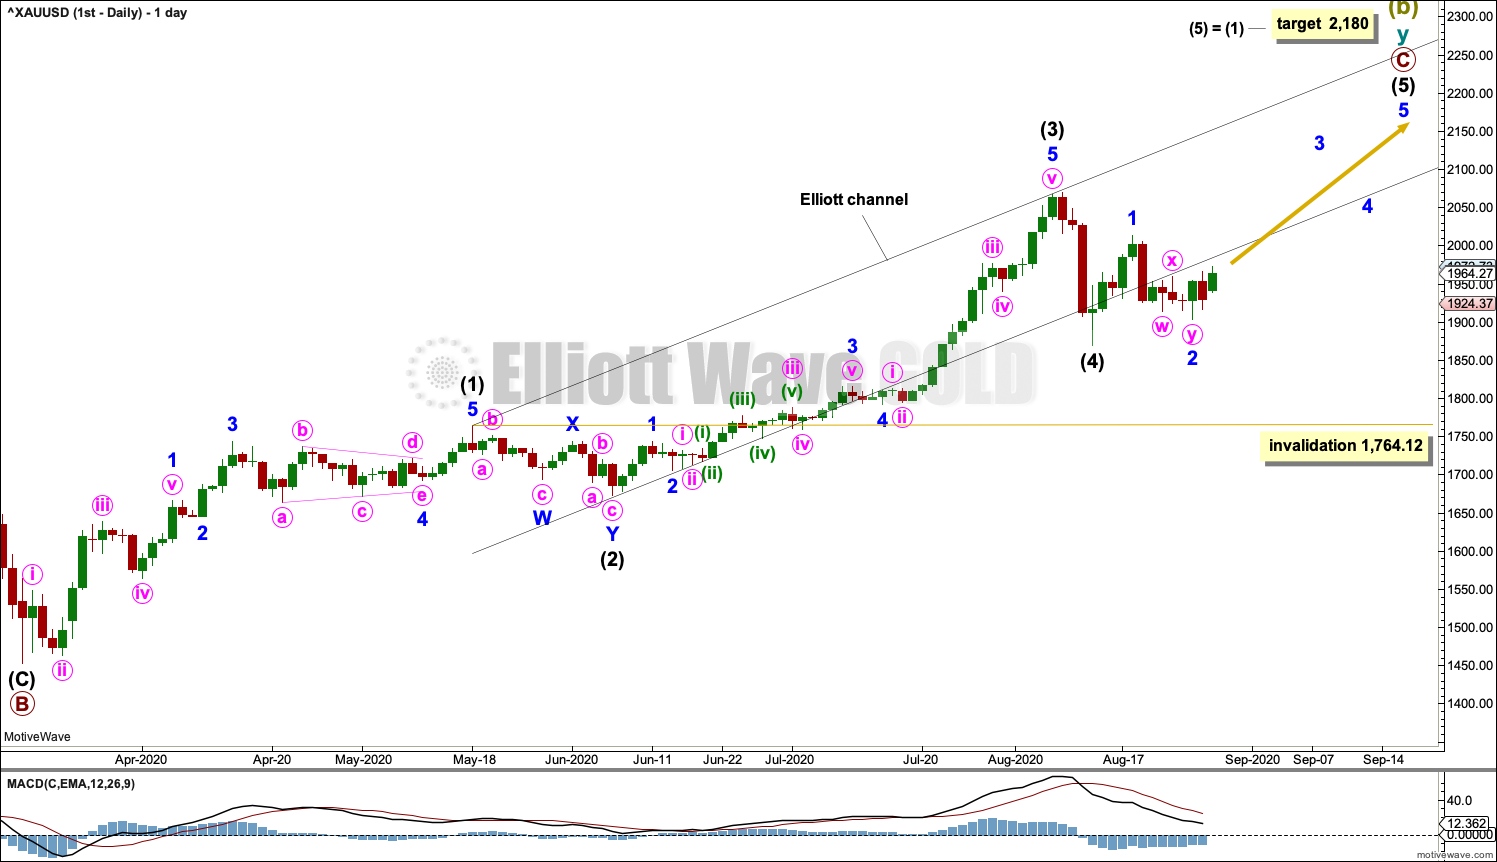
Click chart to enlarge.
The daily chart shows detail of primary wave C as an incomplete impulse.
Intermediate waves (1) through to (4) within primary wave C may be complete.
If it continues lower, then intermediate wave (4) may not move into intermediate wave (1) price territory below 1,764.12.
Draw an Elliott channel: draw a first trend line from the end of intermediate wave (1) to the end of intermediate wave (3), then place a parallel copy on the end of intermediate wave (2). Intermediate wave (4) may have overshot the lower edge.
Intermediate wave (2) was a shallow double zigzag, lasting 15 sessions. Intermediate wave (4) may be complete as a deeper and quicker single zigzag. Fourth waves are most often more brief than their counterpart second wave corrections for this market, so it would look normal for intermediate wave (4) to be over here.
ALTERNATE DAILY CHART
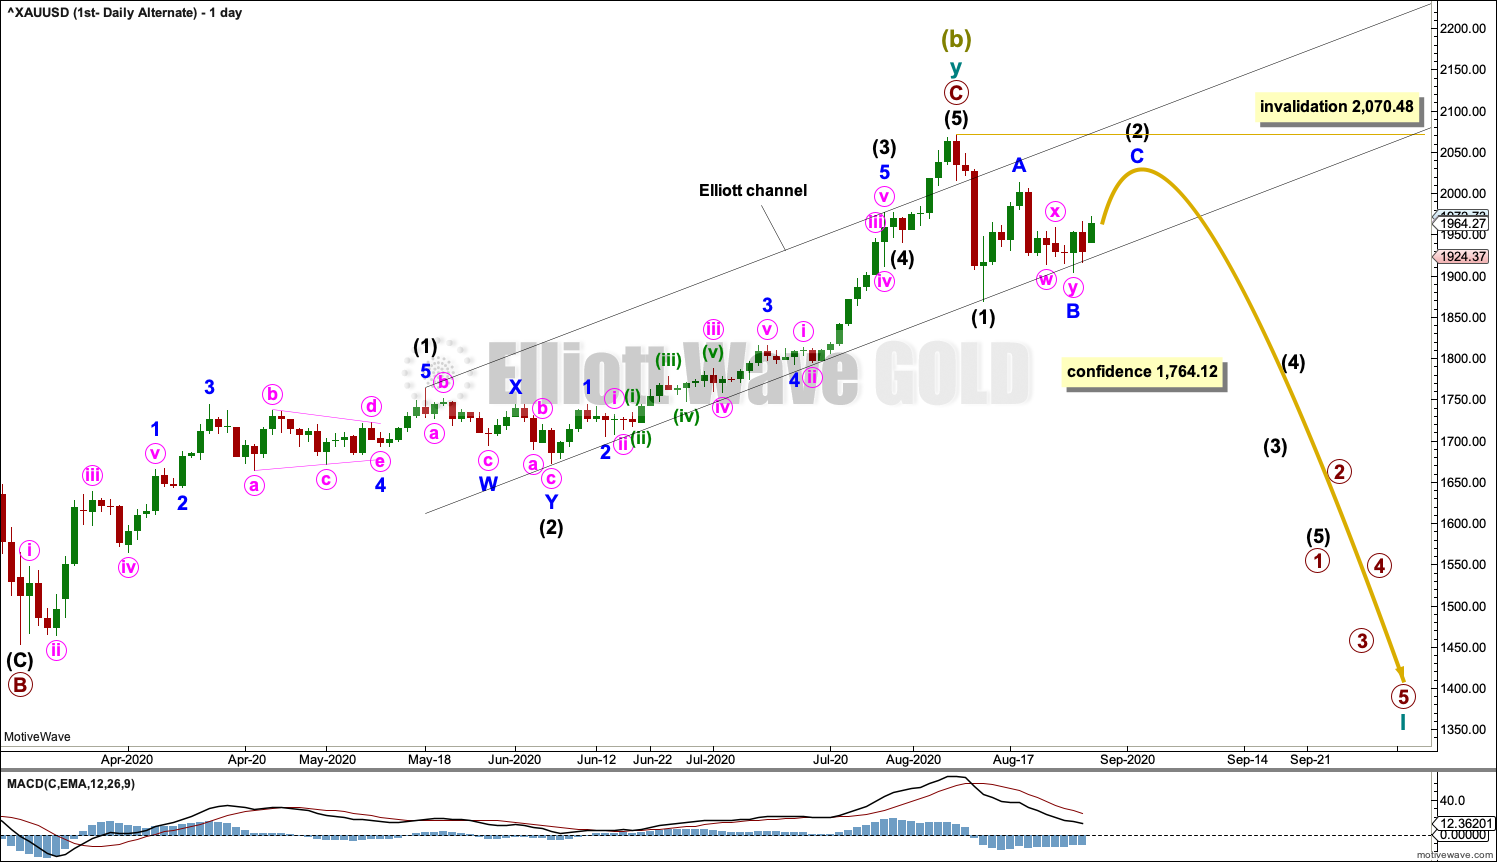
Click chart to enlarge.
It is also possible that a Super Cycle degree trend change has occurred at the last high. However, we should always assume the trend remains the same until proven otherwise. Assume the upwards trend remains in place and the main wave count is correct until the upwards trend is invalidated with a new low below 1,764.12. At that stage, this would become the main wave count.
Super Cycle wave (c) would be likely to make at least a slight new low below the end of Super Cycle wave (a) at 1,046.27 to avoid a truncation. If price provides confidence in this wave count with a new low below 1,764.12, then a target would be calculated for Super Cycle wave (c) to end.
SECOND ELLIOTT WAVE COUNT
WEEKLY CHART
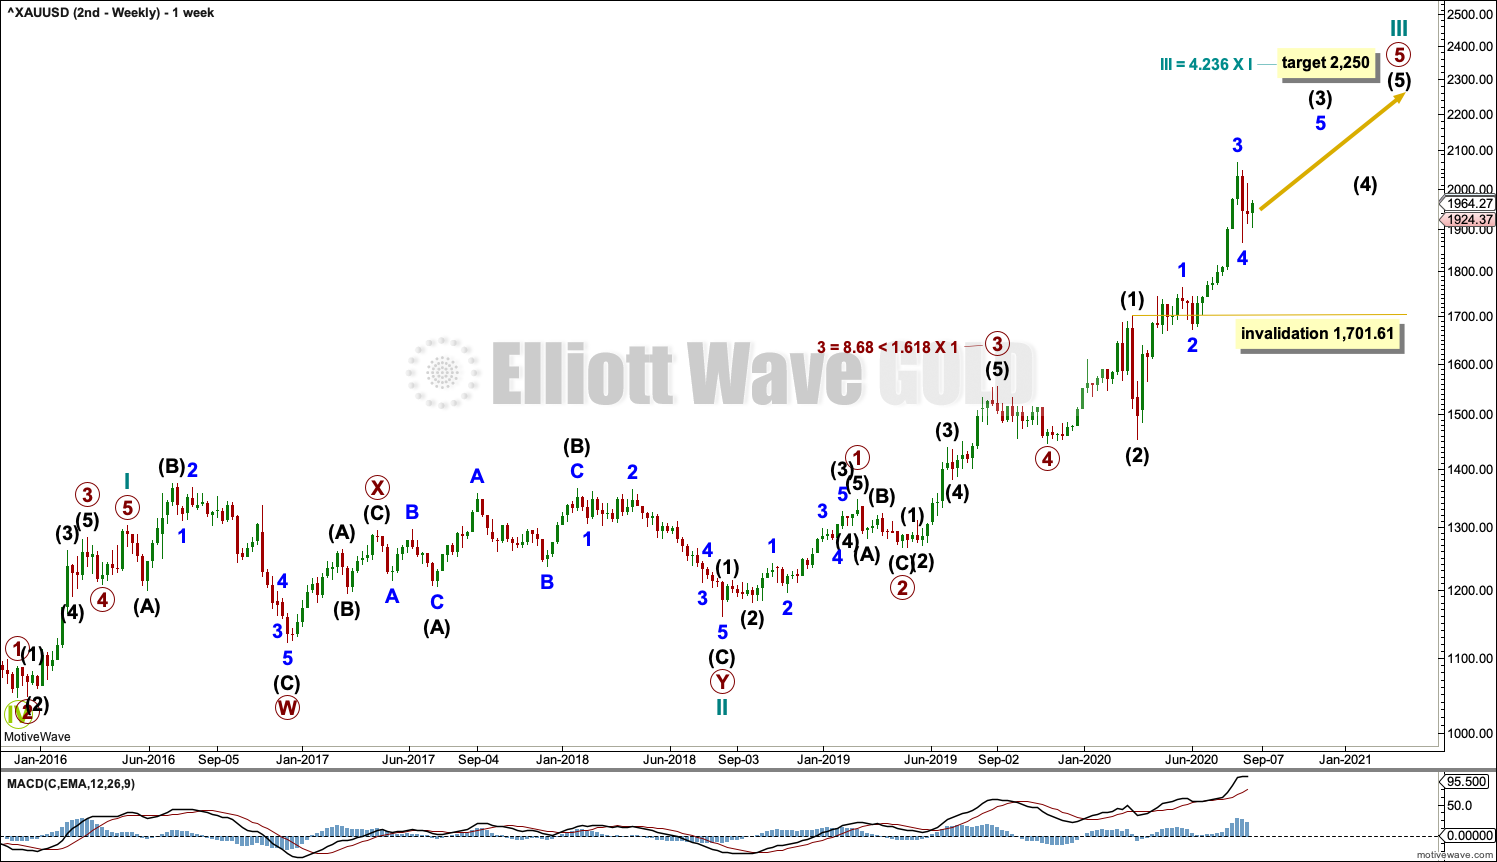
Click chart to enlarge.
This wave count sees the the bear market complete at the last major low for Gold on 3 December 2015.
If Gold is in a new bull market, then it should begin with a five wave structure upwards on the weekly chart.
Cycle wave I fits as a five wave impulse with reasonably proportionate corrections for primary waves 2 and 4.
Cycle wave II fits as a double flat. However, within the first flat correction labelled primary wave W, this wave count needs to ignore what looks like an obvious triangle from July to September 2016 (this can be seen labelled as a triangle on the bear wave count above). This movement must be labelled as a series of overlapping first and second waves. Ignoring this triangle reduces the probability of this wave count in Elliott wave terms.
Within the first flat correction labelled primary wave W of the double flat of cycle wave II, intermediate wave (B) is 1.69 the length of intermediate wave (A). This is longer than the common range of up to 1.38, but within an allowable guideline of up to 2. The length of intermediate wave (B) reduces the probability of this wave count.
Cycle wave III may be incomplete. Cycle wave IV may not move into cycle wave I price territory below 1,303.51.
DAILY CHART
Click chart to enlarge.
Cycle wave III may be continuing higher. The daily chart focusses on primary wave 5 within cycle wave III.
Draw an Elliott channel about intermediate wave (3): draw the first trend line from the end of minor wave 1 to the end of minor wave 3, then place a parallel copy on the end of minor wave 2. Minor wave 4 may have overshot the lower edge of the channel.
If minor wave 4 continues lower, then it may not move into minor wave 1 price territory below 1,764.12.
TECHNICAL ANALYSIS
WEEKLY CHART
Click chart to enlarge. Chart courtesy of StockCharts.com.
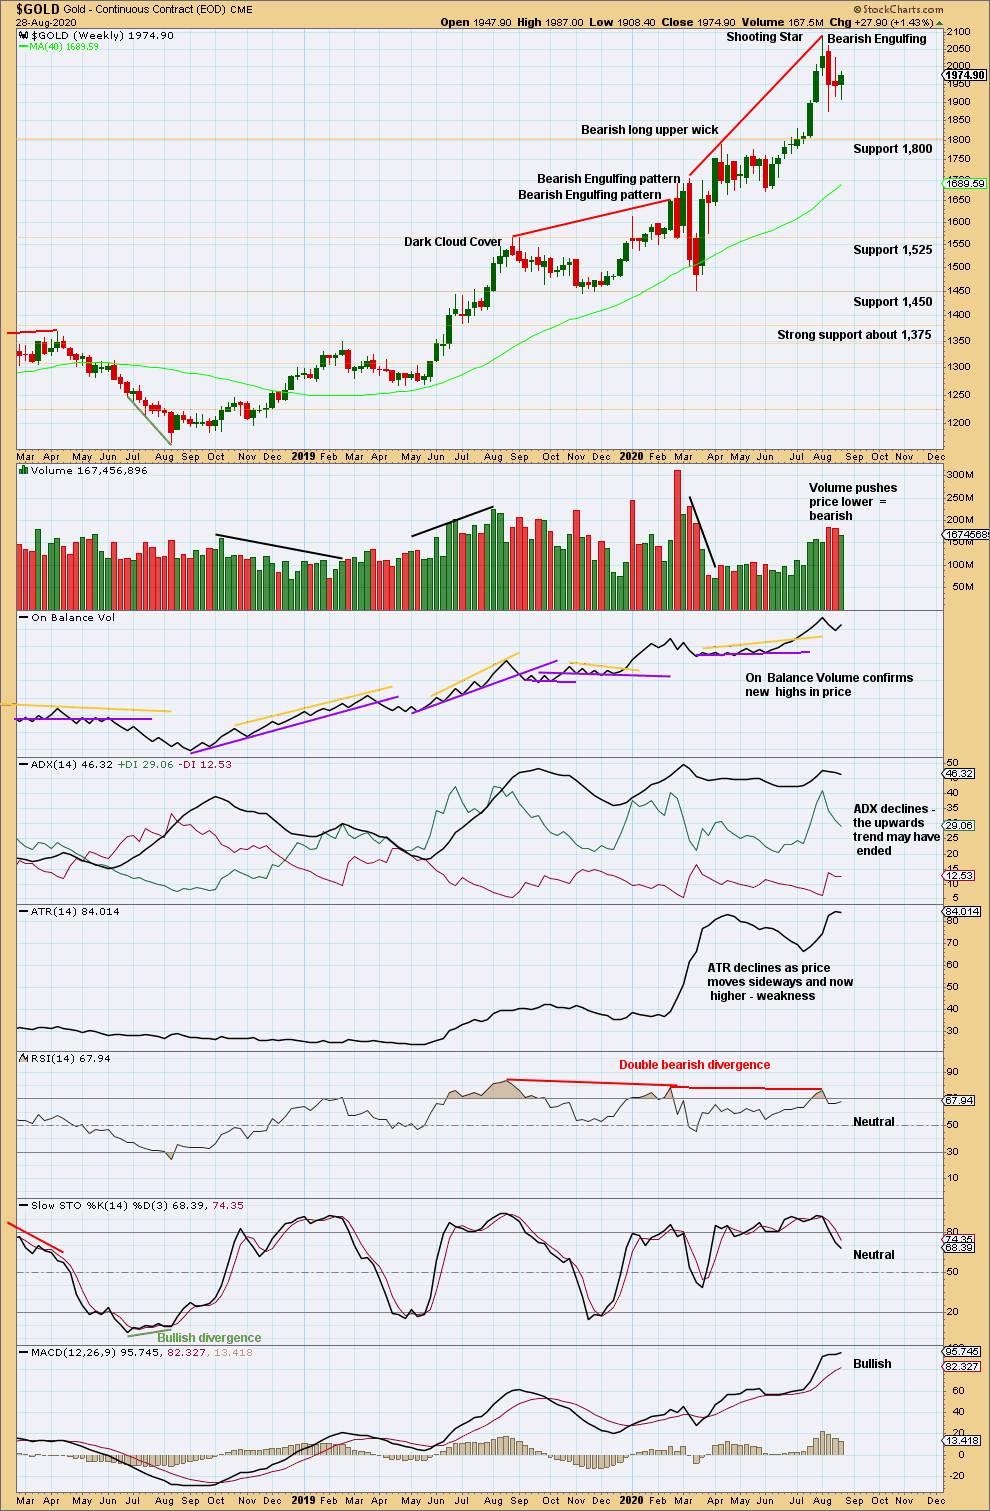
The upwards trend reached very extreme and RSI reached overbought. A Shooting Star and a Bearish Engulfing candlestick pattern appear at the high. Given extreme conditions, these bearish reversal patterns should be given weight; this would support the alternate daily chart. However, it is still possible that further highs may be made before a more time consuming pullback or a 180° trend change may occur.
DAILY CHART
Click chart to enlarge. Chart courtesy of StockCharts.com.
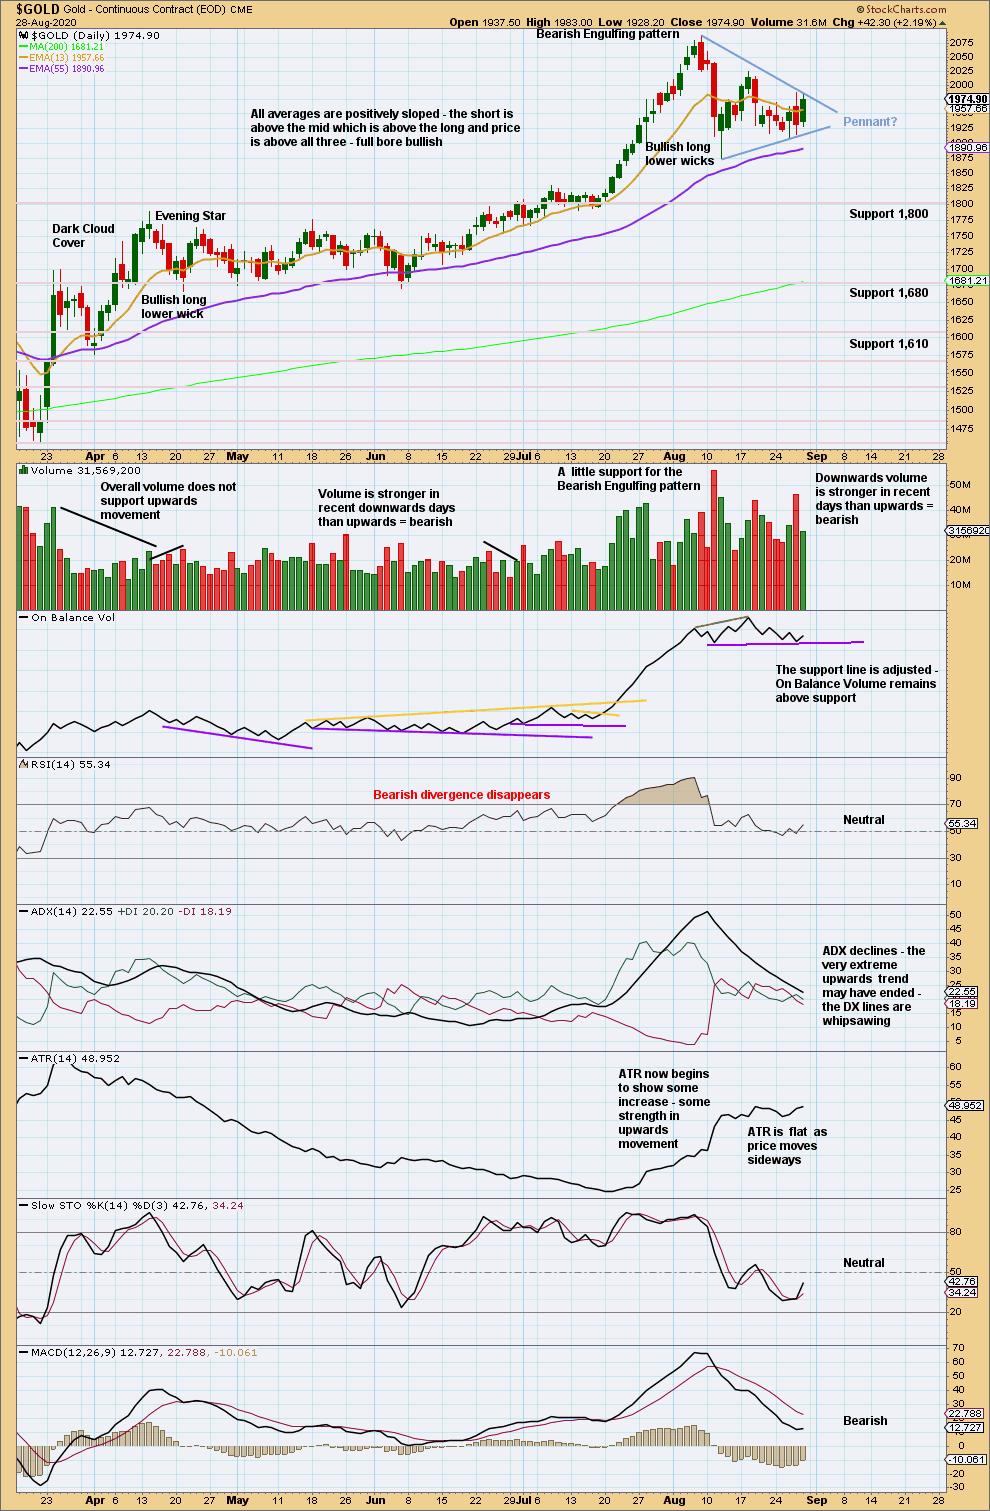
Sideways movement of the last two weeks has brought ADX and RSI down from extreme. There is again room for a trend to develop.
A target from the pennant pattern is about 2,270. An upwards breakout on an upwards day that has support from volume is required before this target may be used. A bearish short-term volume profile puts a little doubt on the pennant pattern.
GDX WEEKLY CHART
Click chart to enlarge. Chart courtesy of StockCharts.com.
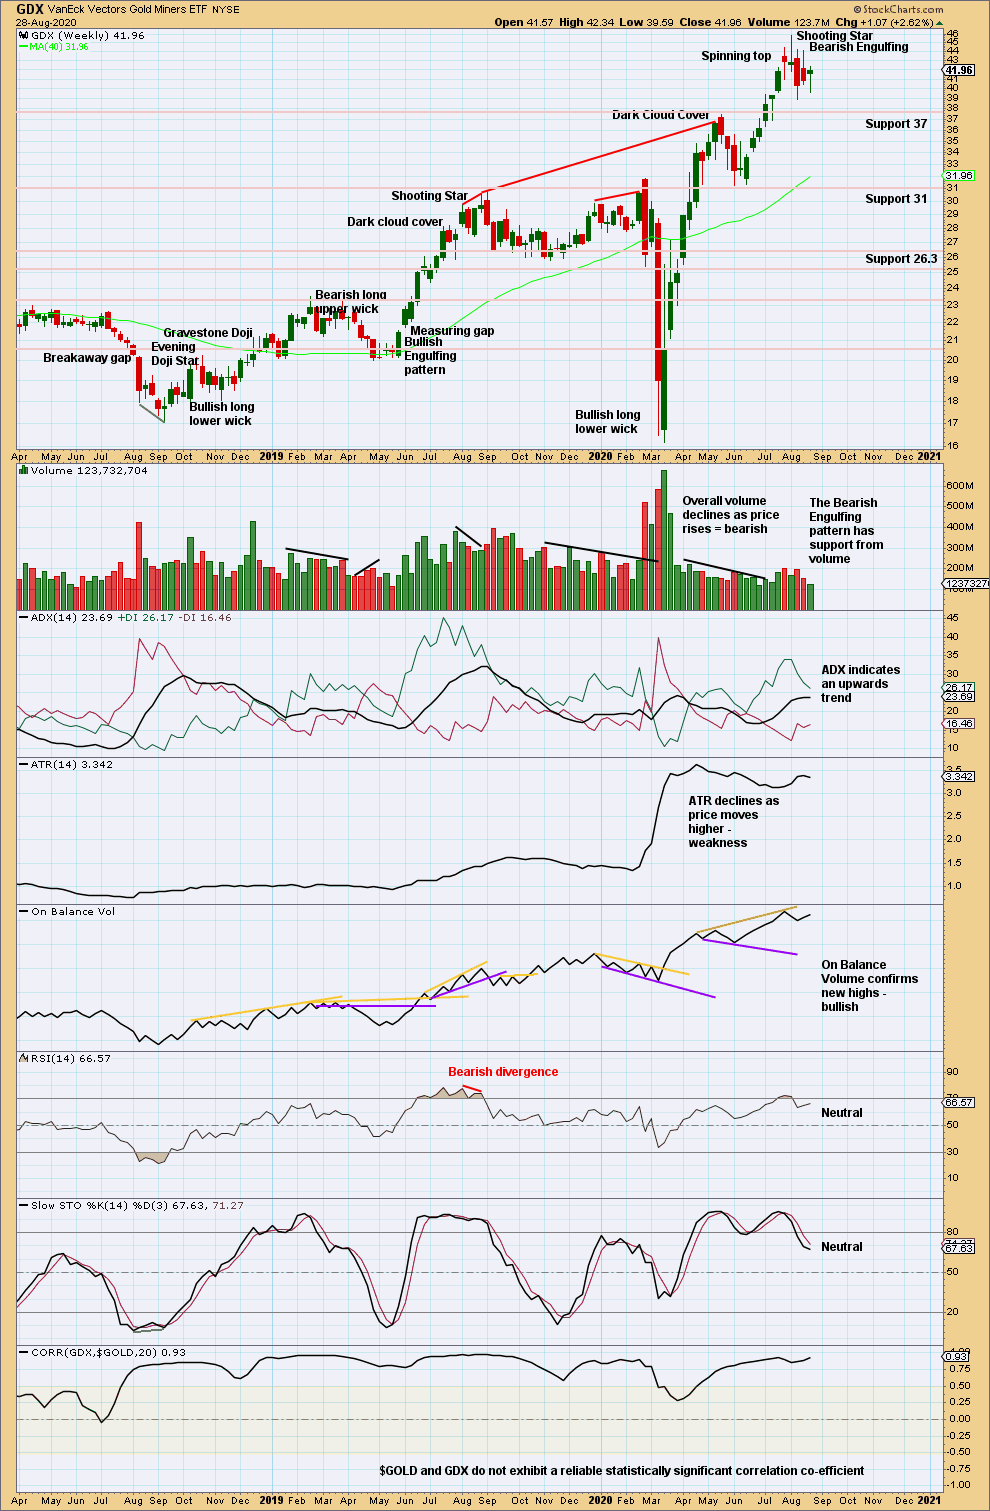
Now two bearish candlestick reversal patterns in a Shooting Star and a Bearish Engulfing pattern indicate a trend change. With RSI reaching overbought at the high, these signals should be given weight. A trend change may be either a 180° change or a change to a sideways consolidation.
GDX DAILY CHART
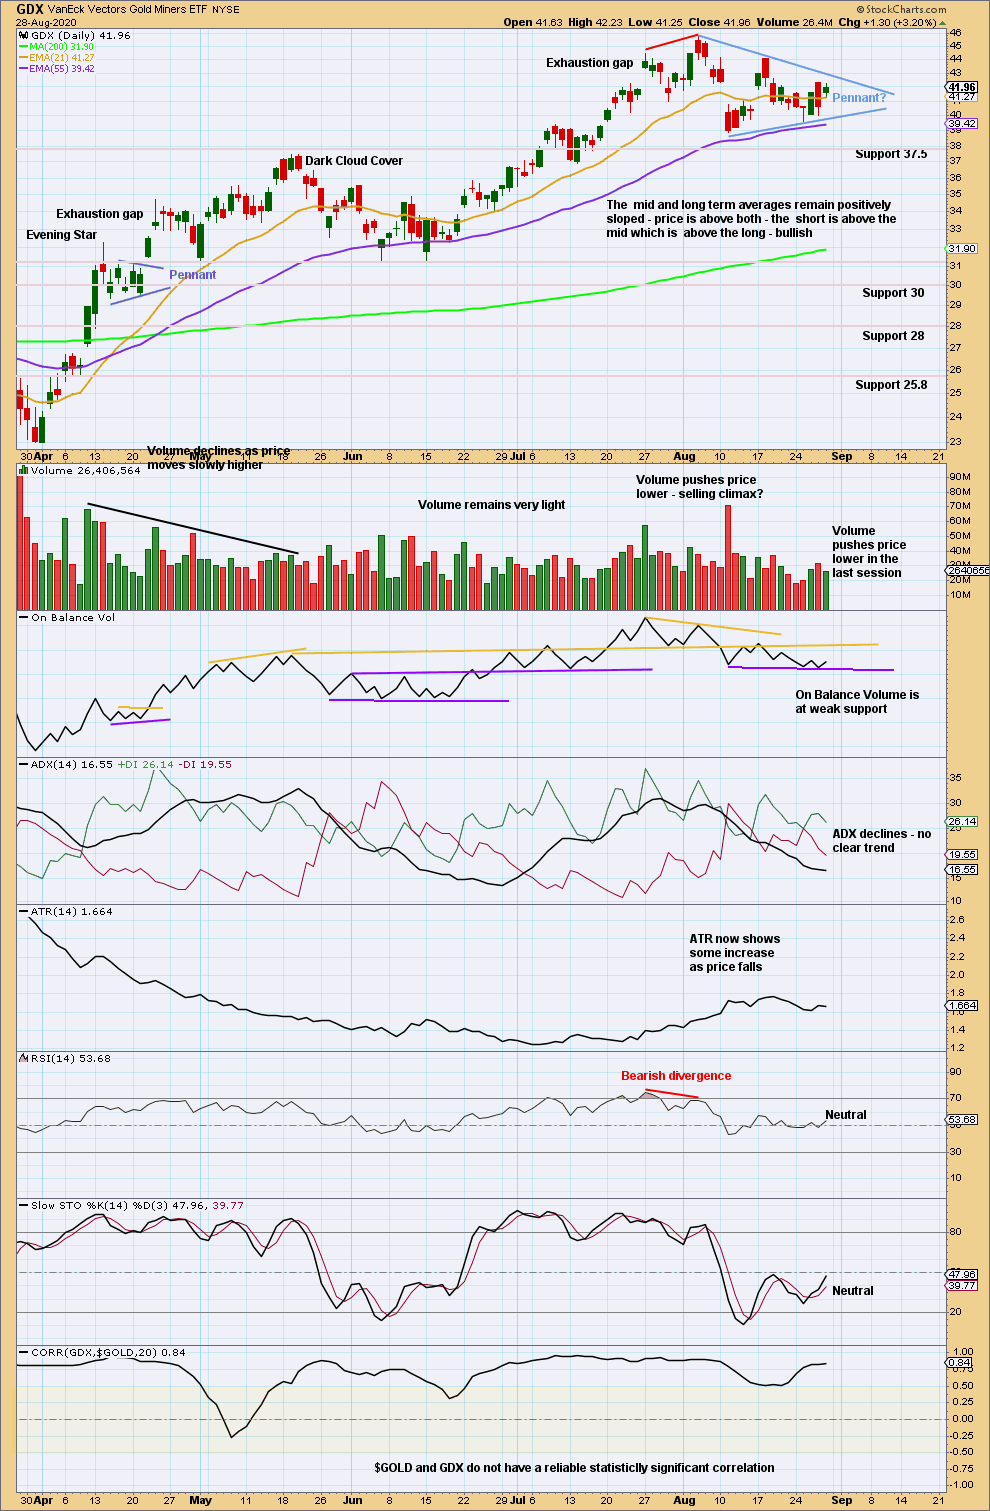
Click chart to enlarge. Chart courtesy of StockCharts.com.
A small pennant pattern may have formed. These are continuation patterns. The best performing pennant patterns complete and breakout within 15 sessions. This one has now lasted 17 sessions. The longer it lasts, the less likely an upwards breakout may be.
If price breaks above the upper trend line of the pennant by closing above that line on an upwards day with support from volume, then a target from the pennant would be about 57.
US OIL
Another very small range week has moved price very slightly higher with weak volume.
Summary: Oil may have found a major sustainable low.
Price may continue slowly higher for a few more weeks to a short-term target at 46.55. If this target is wrong, then it may be too high.
A pullback is still expected. The pullback may end about 23.05. It is possible the pullback may be deeper than this though; the first major correction within a new trend for Oil tends to be very deep.
When this pullback may be complete, then an upwards trend should resume with increased strength.
ELLIOTT WAVE COUNT
MONTHLY CHART
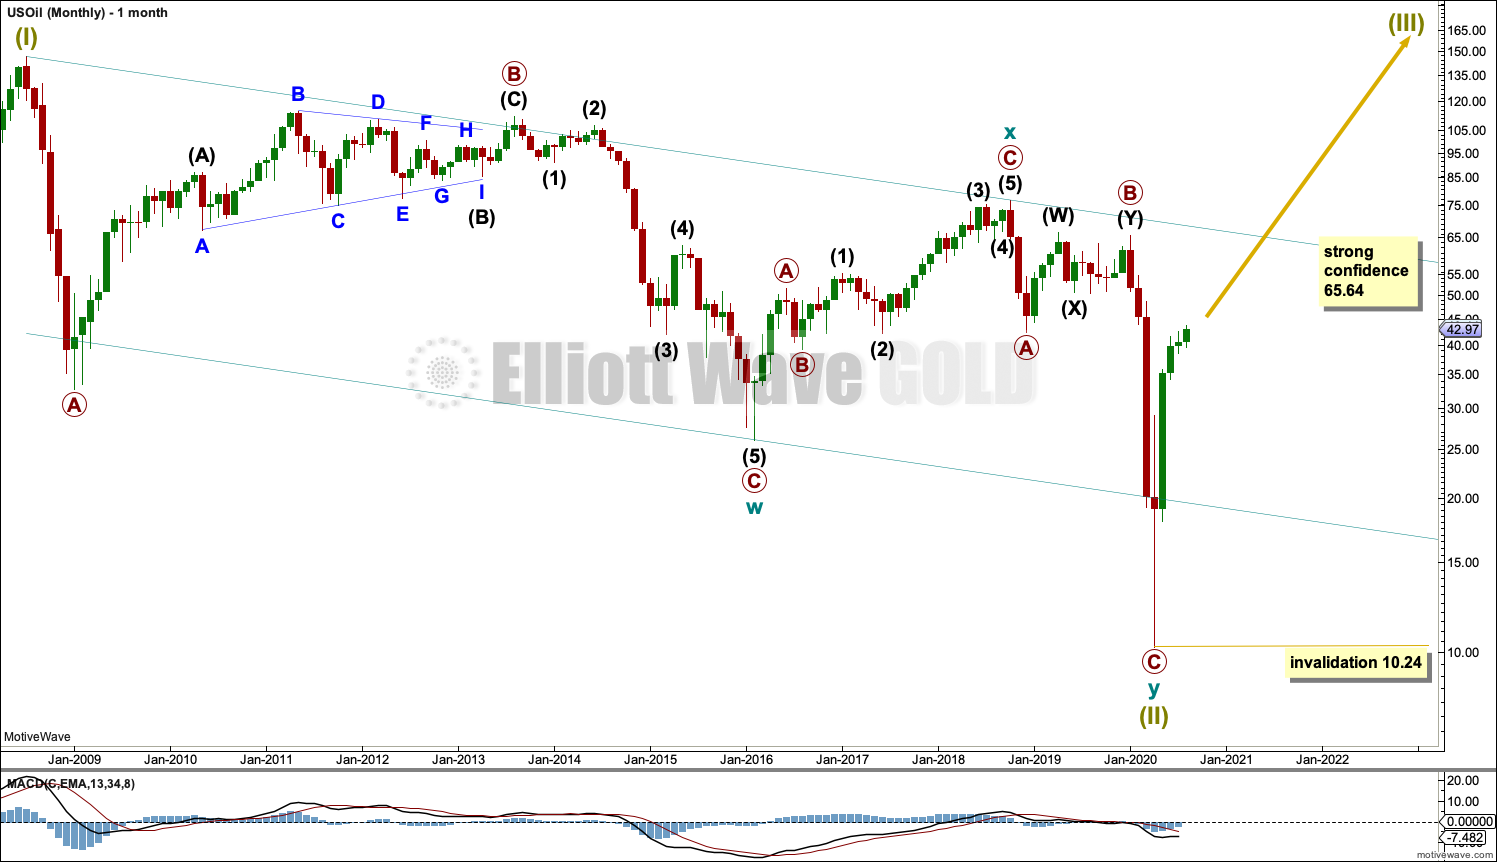
Click chart to enlarge.
The basic Elliott wave structure is five steps forward and three steps back. This Elliott wave count expects that US Oil has completed a three steps back pattern, which began in July 2008. The Elliott wave count expects that the bear market for US Oil may now be over.
A channel is drawn about Super Cycle wave (II): draw the first trend line from the start of cycle wave w to the end of cycle wave x, then place a parallel copy on the end of cycle wave w. Price has bounced up off the channel. This trend line is breached, which is a typical look for the end of a movement for a commodity.
The upper edge of the channel may provide resistance.
Following five waves up and three steps back should be another five steps up; this is labelled Super Cycle wave (III), which may only have just begun. Super Cycle wave (III) may last a generation and must make a new high above the end of Super Cycle wave (I) at 146.73.
Super Cycle wave (III) may only subdivide as a five wave impulse. New trends for Oil usually start out very slowly with short first waves and deep time consuming second wave corrections. Basing action over a few years may now have begun.
WEEKLY CHART
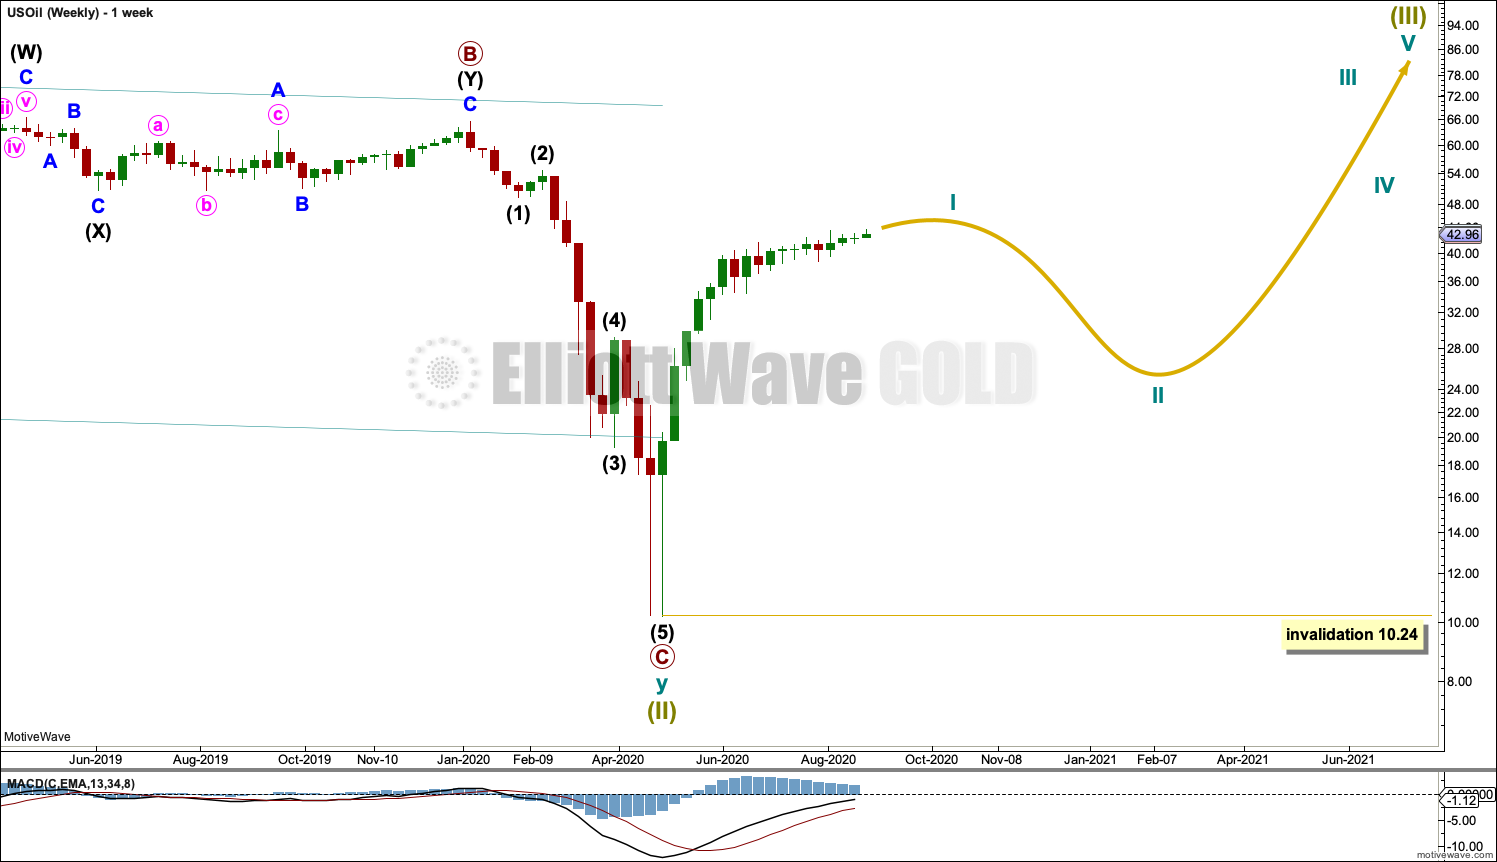
Click chart to enlarge.
Super Cycle wave (III) must subdivide as an impulse. Cycle wave I within the impulse may be incomplete. Cycle wave II may not move beyond the start of cycle wave I below 10.24.
FIRST DAILY CHART
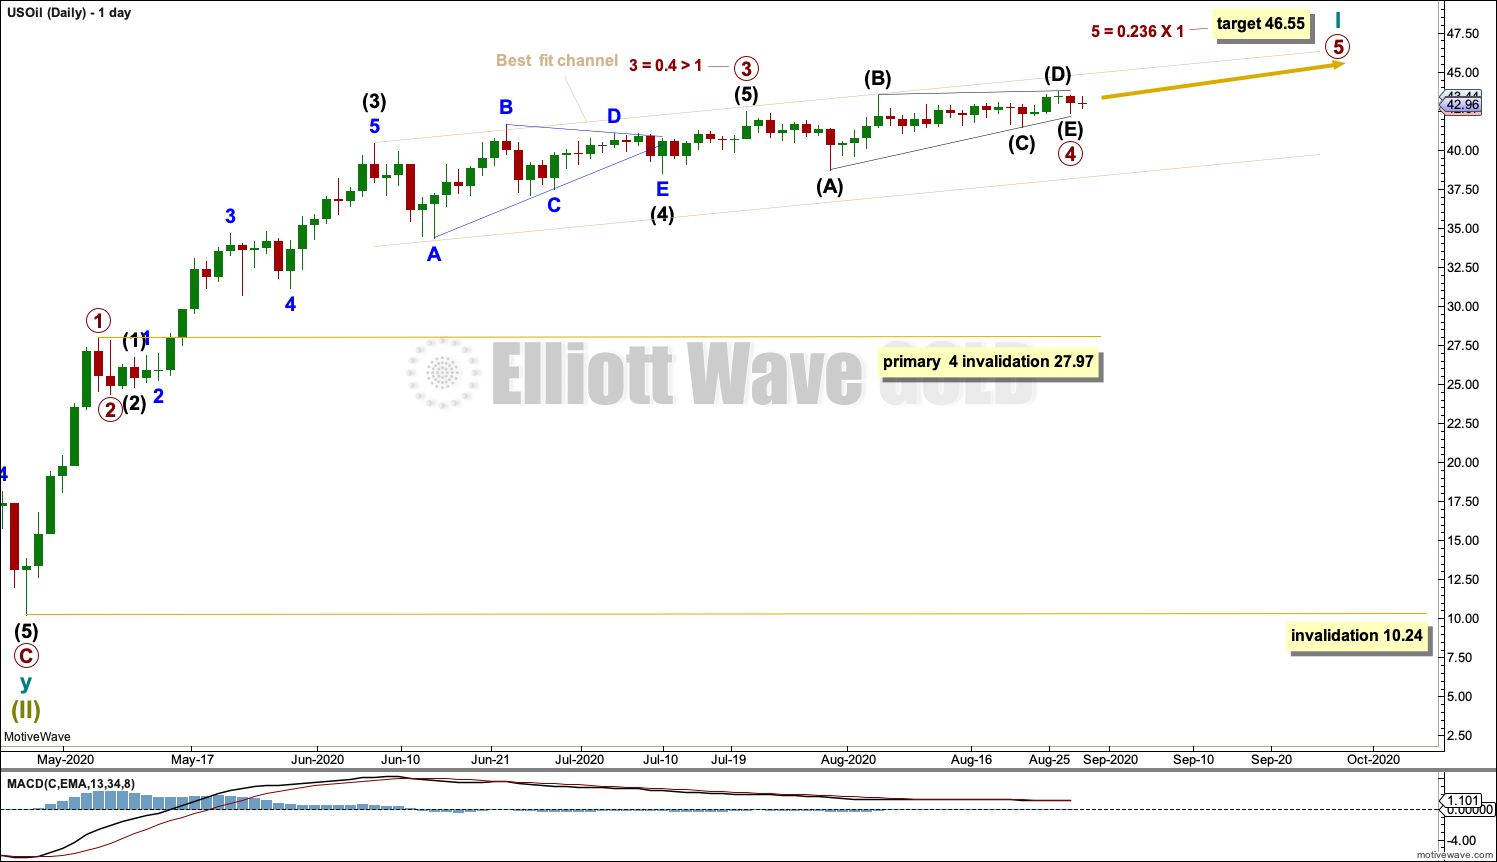
Click chart to enlarge.
This week cycle wave I is reanalysed.
This labelling sees primary wave 3 longer than primary wave 1, with a close Fibonacci ratio of equality. Primary wave 4 may be a complete running barrier triangle.
A target is calculated for primary wave 5 to end. However, because there is already a close Fibonacci ratio between primary waves 1 and 3, primary wave 5 may not exhibit a Fibonacci ratio to either of primary waves 1 or 3. Oil only occasionally exhibits Fibonacci ratios between all three actionary waves.
The best fit channel is adjusted to contain the slowing end of cycle wave I. When this channel is breached by downwards movement, it may be an indication that cycle wave I should be over and cycle wave II should have begun.
Cycle wave II may not move beyond the start of cycle wave I below 10.24.
SECOND DAILY CHART
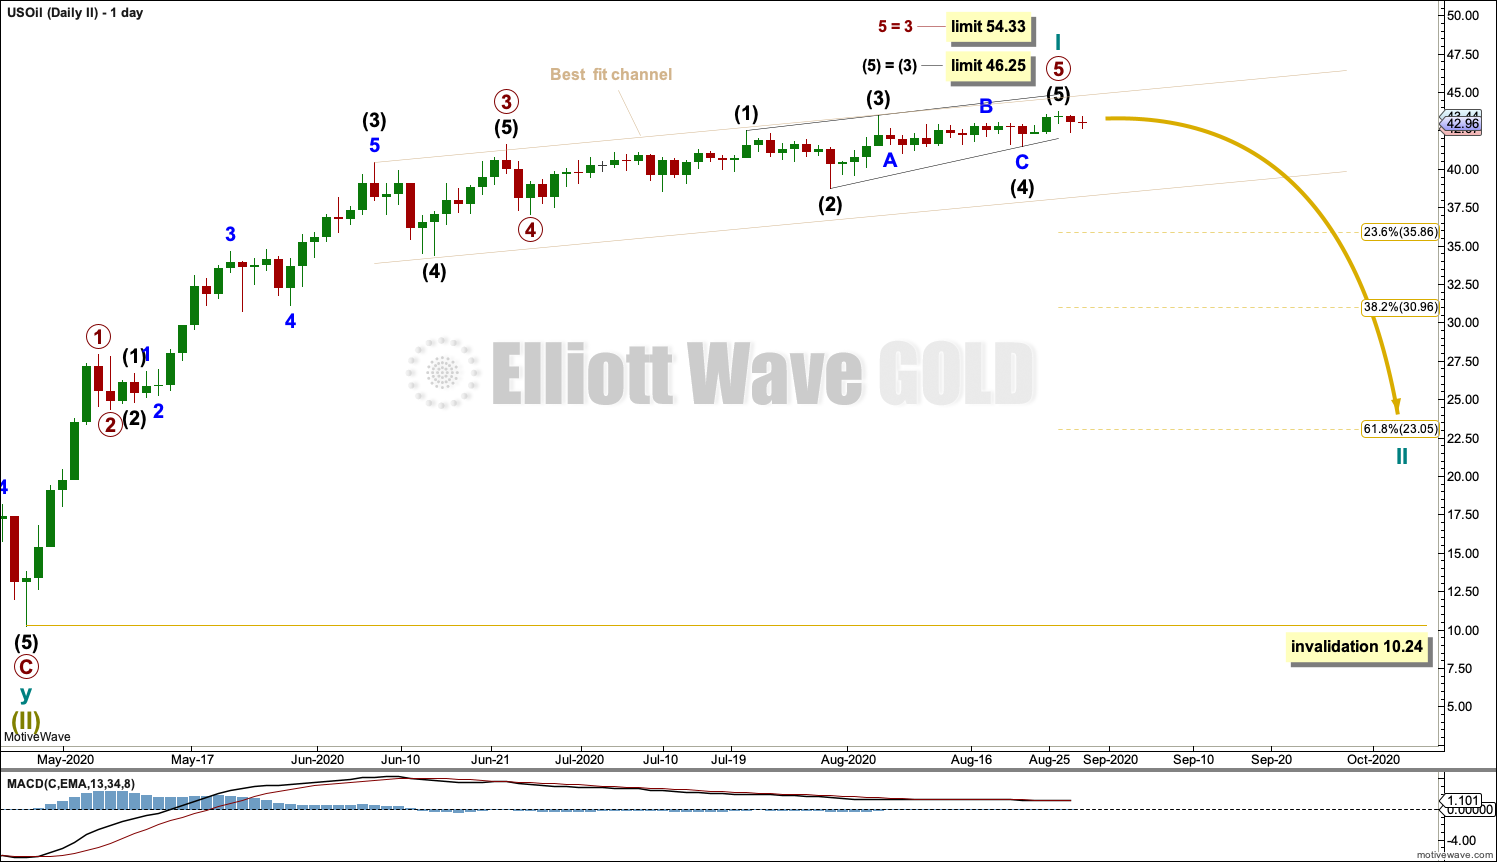
Click chart to enlarge.
It is possible this week for this wave count that cycle wave I may be over. But if cycle wave I continues higher, then the limits apply.
Primary wave 5 for this wave count is labelled as an ending contracting diagonal. If intermediate wave (5) continues higher, then it may not be longer than equality with intermediate wave (3) at 46.25.
For this wave count primary wave 3 is shorter in length than primary wave 1. Primary wave 3 may not be the shortest of primary waves 1, 3 and 5; if it continues higher, then primary wave 5 is limited to no longer than equality in length with primary wave 3 at 54.33.
TECHNICAL ANALYSIS
WEEKLY CHART
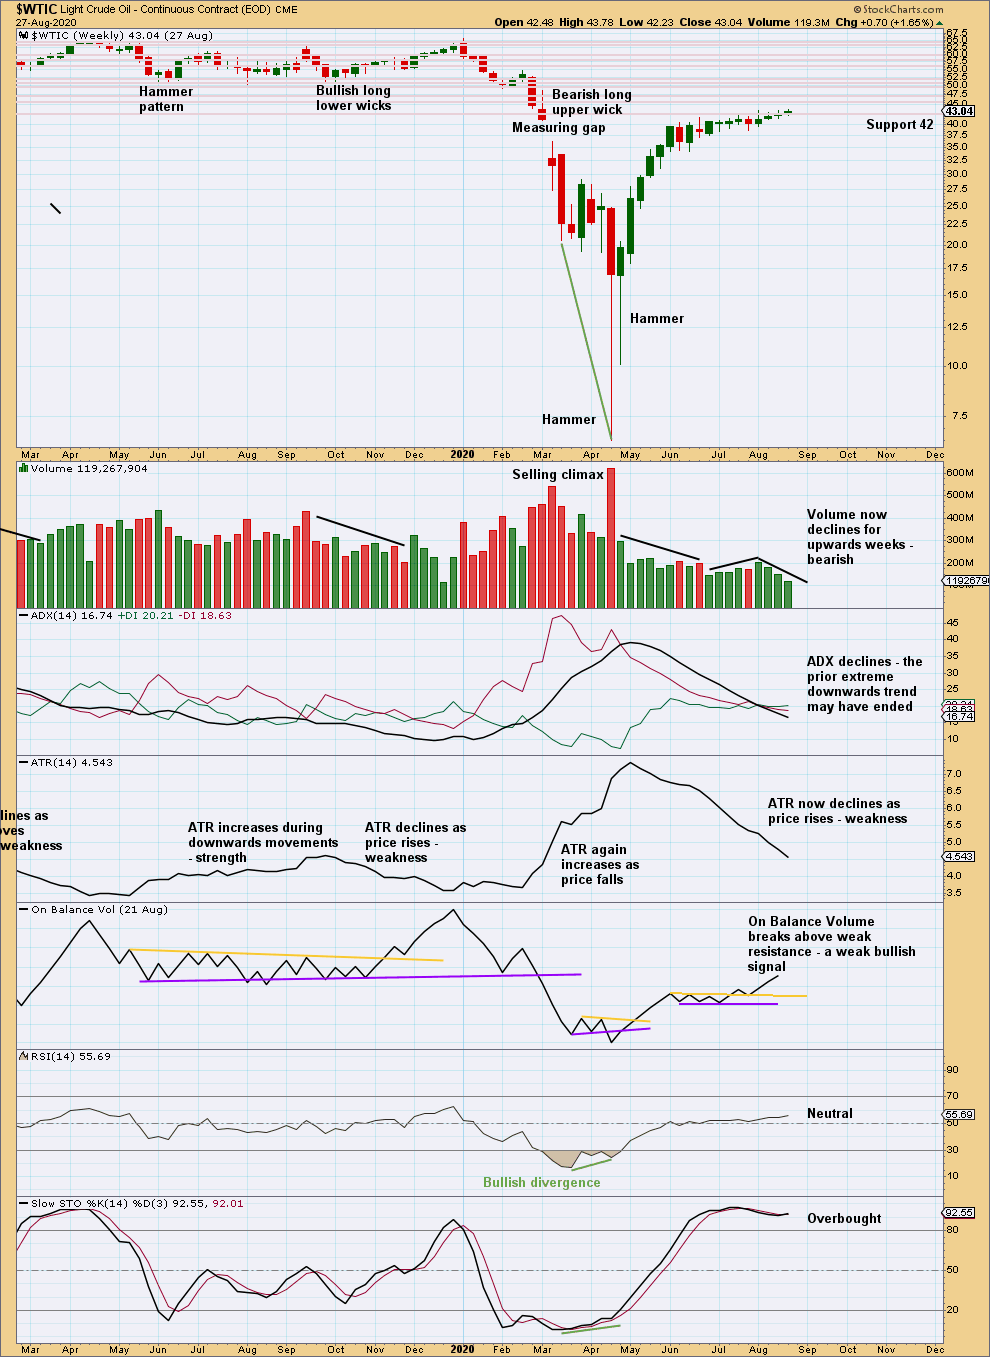
Click chart to enlarge. Chart courtesy of StockCharts.com.
Support about 42 has again held this week. There is a strong cluster of resistance above; it would still be reasonable to expect a pullback to develop about here.
DAILY CHART
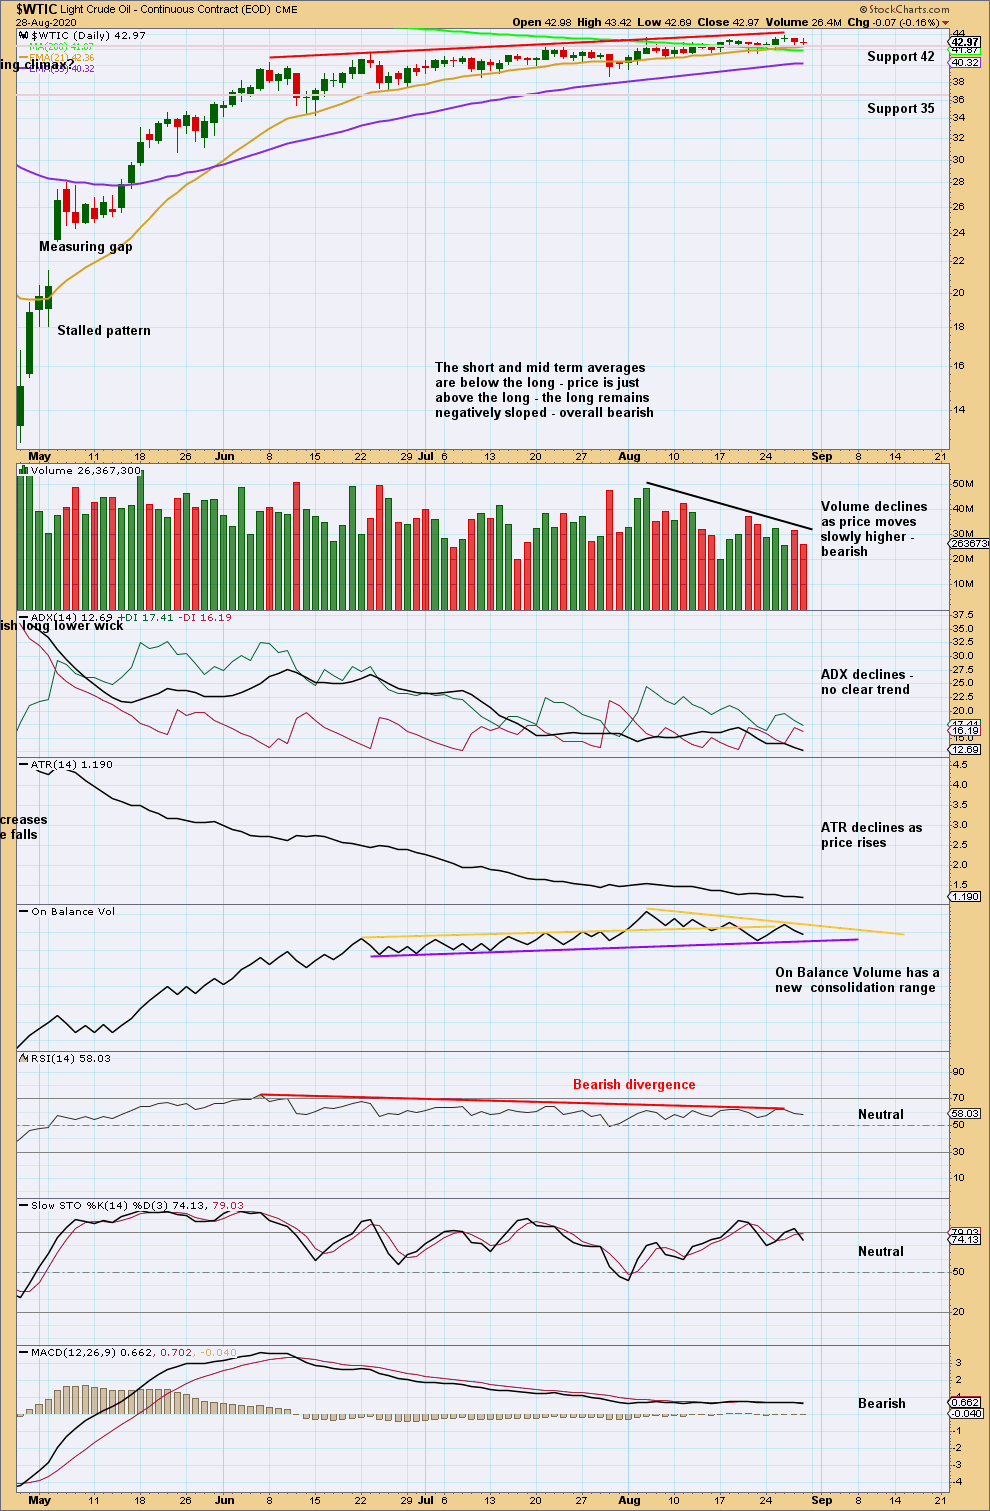
Click chart to enlarge. Chart courtesy of StockCharts.com.
There is now only single bearish divergence between price and RSI. The probability of a multi-week pullback remains high.
There is no bearish candlestick reversal pattern to indicate a high in place. A rounded top looks likely to be forming. These take time. Eventually, after a final high is found, downwards movement may increase in momentum and another V bottom may form.
—
Always practice good risk management as the most important aspect of trading. Always trade with stops and invest only 1-5% of equity on any one trade. Failure to manage risk is the most common mistake new traders make.