
GOLD: Elliott Wave and Technical Analysis | Charts – September 18, 2020
For a fifth week now price has moved sideways in a triangle pattern. There has still been no breakout.
Summary: On Balance Volume suggests an upwards breakout from the triangle may be imminent. The upwards trend may resume.
The next target is now at 2,100.
However, the alternate daily wave count considers a downwards breakout from the current triangle (after possibly a short and false upwards breakout).
A new low below 1,764.12 at any time frame would invalidate the first daily chart and add confidence in an alternate daily chart. At that stage, a sustainable high would be in place and a new downwards trend to last months may be underway.
Grand SuperCycle analysis is here.
Last analysis of monthly charts is here with video here.
FIRST ELLIOTT WAVE COUNT
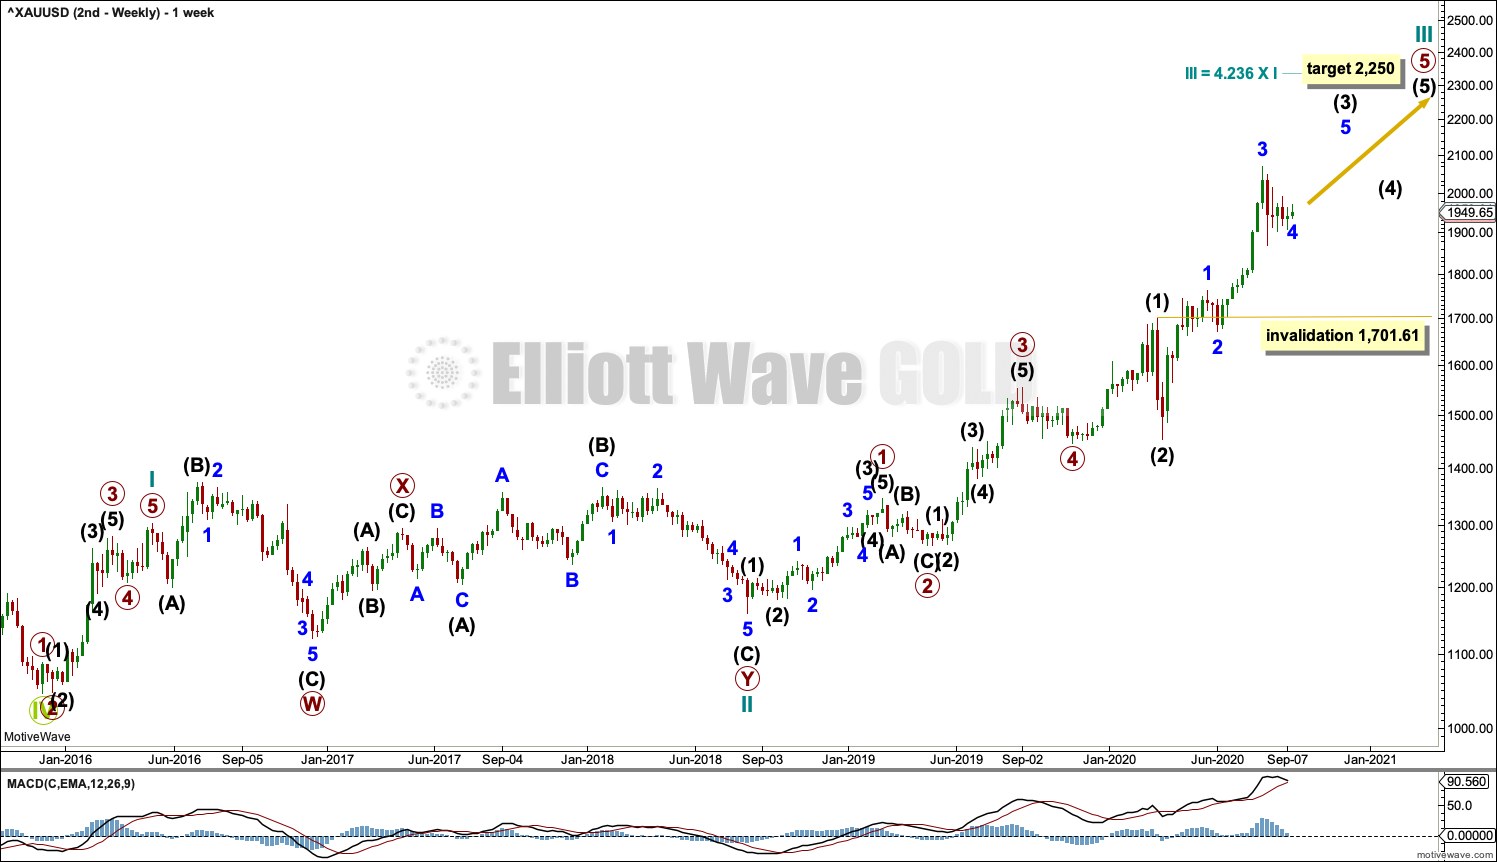
WEEKLY CHART
Click chart to enlarge.
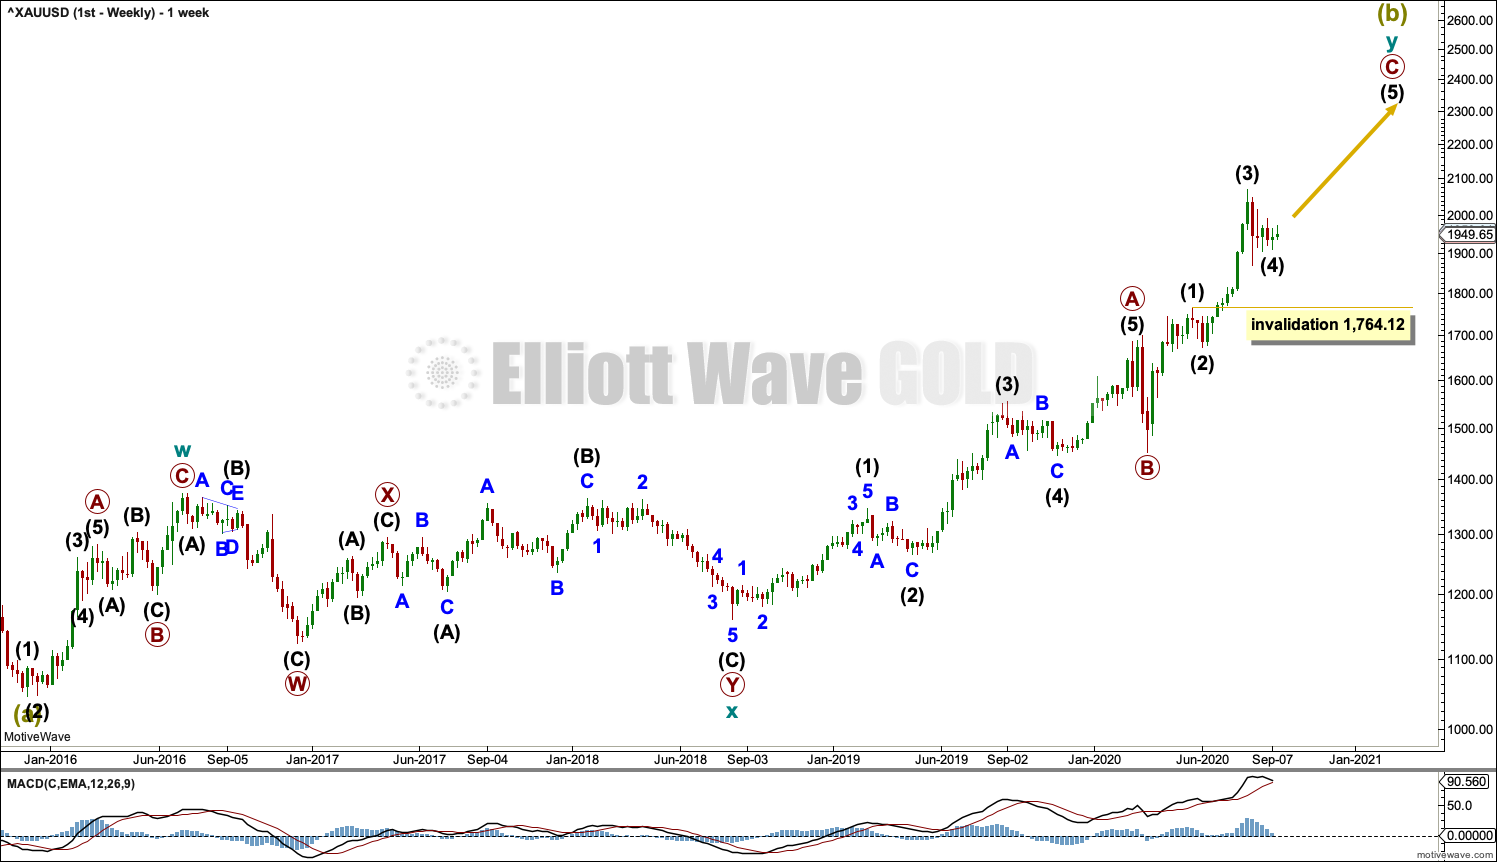
The bigger picture for this first Elliott wave count sees Gold as still within a bear market, in a three steps back pattern that is labelled Grand Super Cycle wave IV on monthly charts. The common range for Super Cycle wave (b) is from 1 to 1.38 times the length of Super cycle wave (a), giving a range from 1,920.18 to 2,252.27. The target would see Super Cycle wave (b) end within this most common range.
Super Cycle wave (b) within Grand Super Cycle wave IV may be an incomplete double zigzag. When Super Cycle wave (b) may be complete, then this wave count expects Super Cycle wave (c) to begin and to move price below the end of Super Cycle wave (a) at 1,046.27.
The first zigzag in the double is labelled cycle wave w. The double is joined by a three in the opposite direction, a combination labelled cycle wave x. The second zigzag in the double is labelled cycle wave y.
The purpose of the second zigzag in a double is to deepen the correction. Cycle wave y has achieved this purpose.
Primary wave C within cycle wave y may be subdividing as an impulse. Intermediate waves (1) through to (4) within primary wave C may be complete. If it continues any lower, then intermediate wave (4) may not move into intermediate wave (1) price territory below 1,764.12.
We should always assume the trend remains the same until proven otherwise. At this stage, Gold is in a bull market.
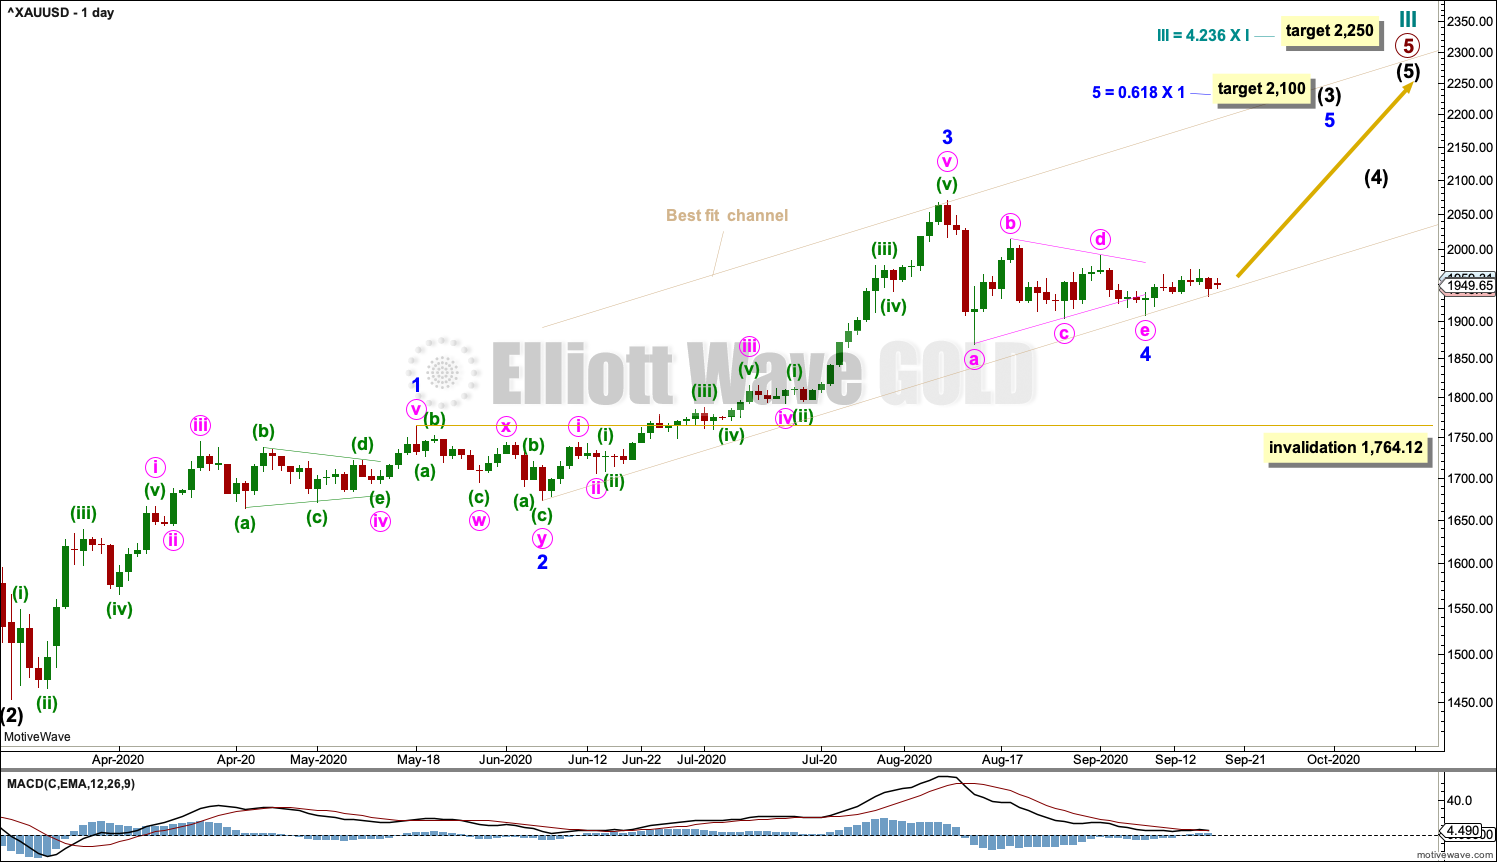
DAILY CHART
Click chart to enlarge.
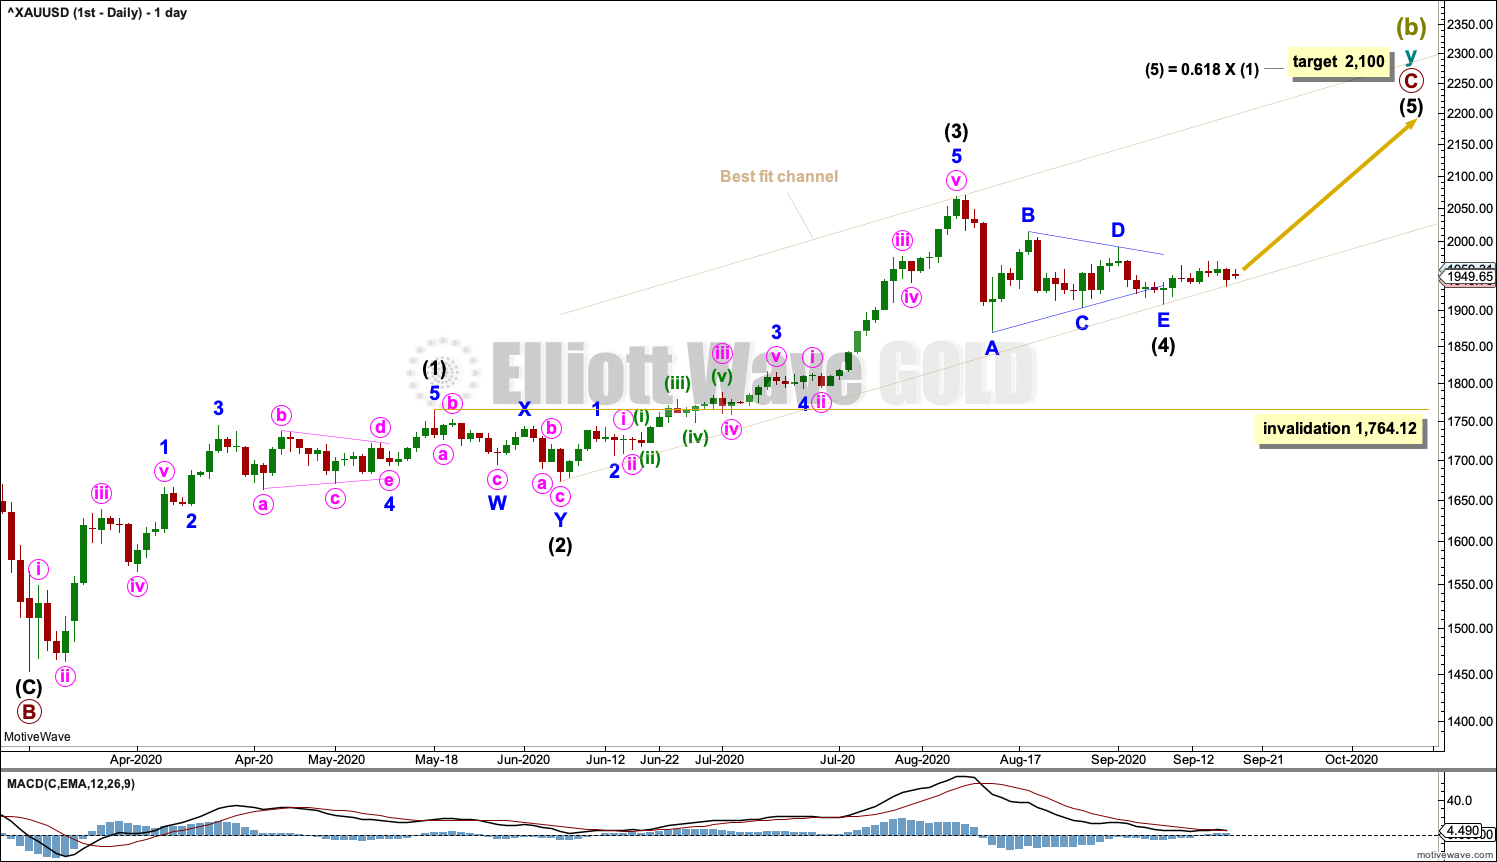
The daily chart shows detail of primary wave C as an incomplete impulse.
Intermediate waves (1) through to (4) within primary wave C may be complete. Intermediate wave (4) may be a complete triangle.
If it continues lower, then intermediate wave (4) may not move into intermediate wave (1) price territory below 1,764.12.
The channel is drawn as a best fit. The lower edge may be a guide to where pullbacks find support.
Intermediate wave (2) was a shallow double zigzag, lasting 15 sessions. Intermediate wave (4) may be complete as a triangle, lasting 22 sessions. Triangles do tend to be longer lasting structures than zigzag and zigzag multiples.
The target expects intermediate wave (5) to be relatively brief and short. Fifth waves following fourth wave triangles for Gold are usually surprisingly short.
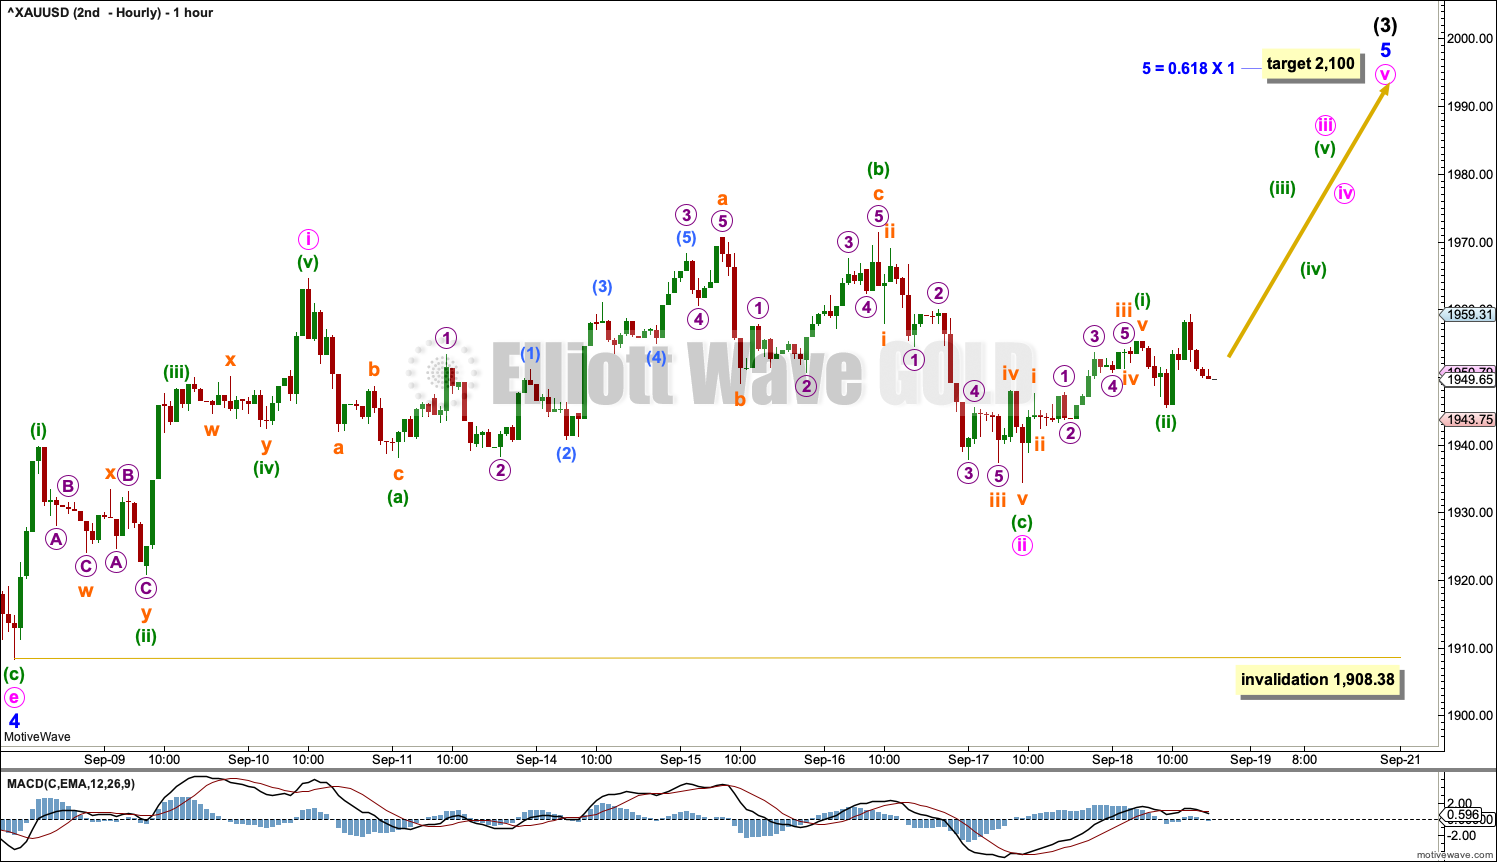
HOURLY CHART
Click chart to enlarge.
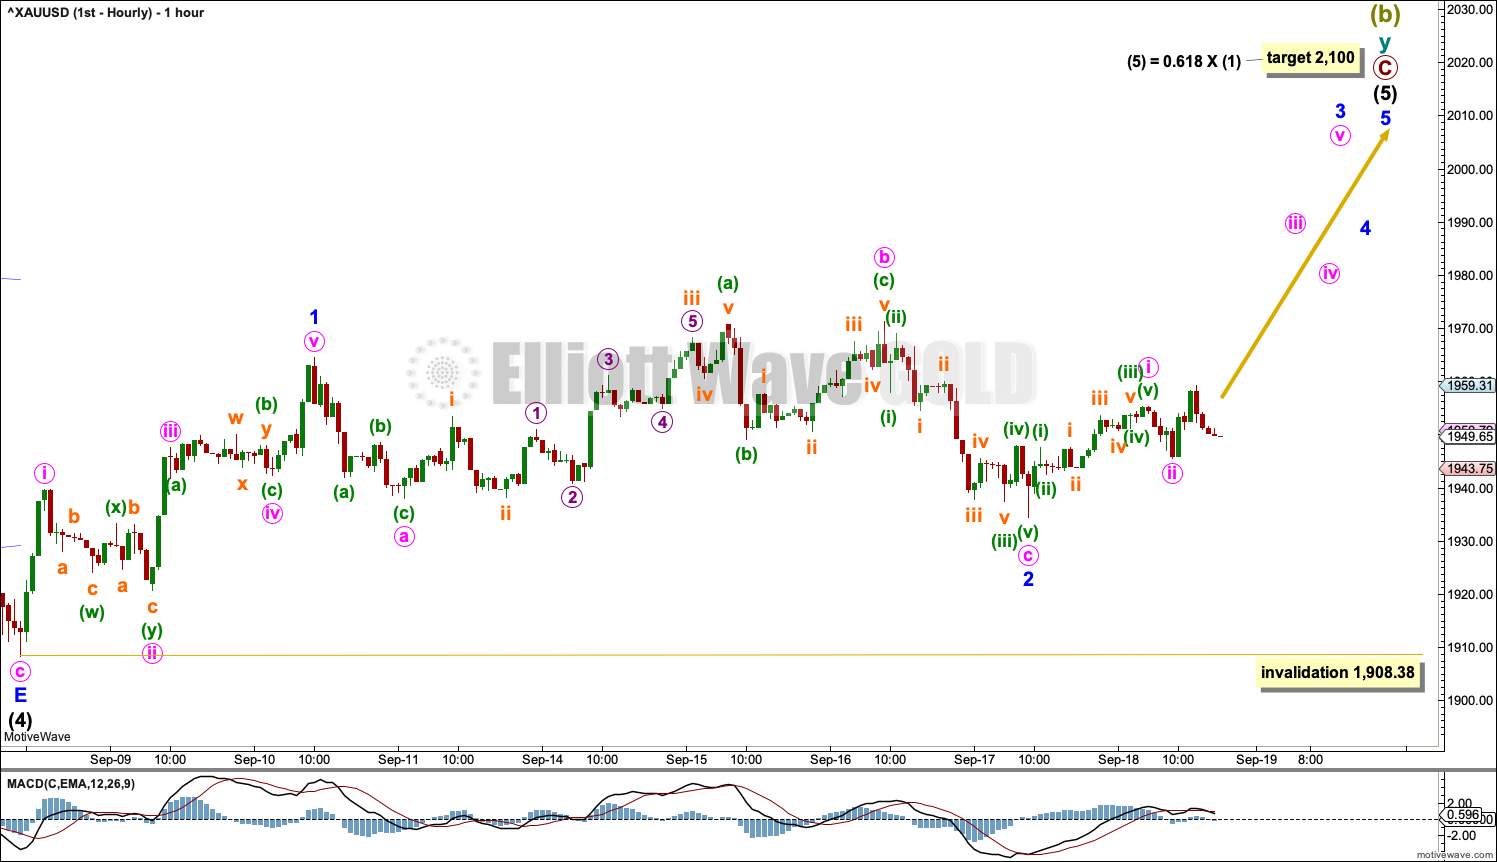
Intermediate wave (4) may be complete as a triangle. Intermediate wave (5) must subdivide as a five wave motive structure, most likely an impulse.
Minor wave 1 within intermediate wave (5) may be complete. Minor wave 2 may be a complete expanded flat correction. If it continues further, then minor wave 2 may not move beyond the start of minor wave 1 below 1,908.38.
Minor wave 3 should exhibit an increase in upwards momentum.
ALTERNATE DAILY CHART
Click chart to enlarge.
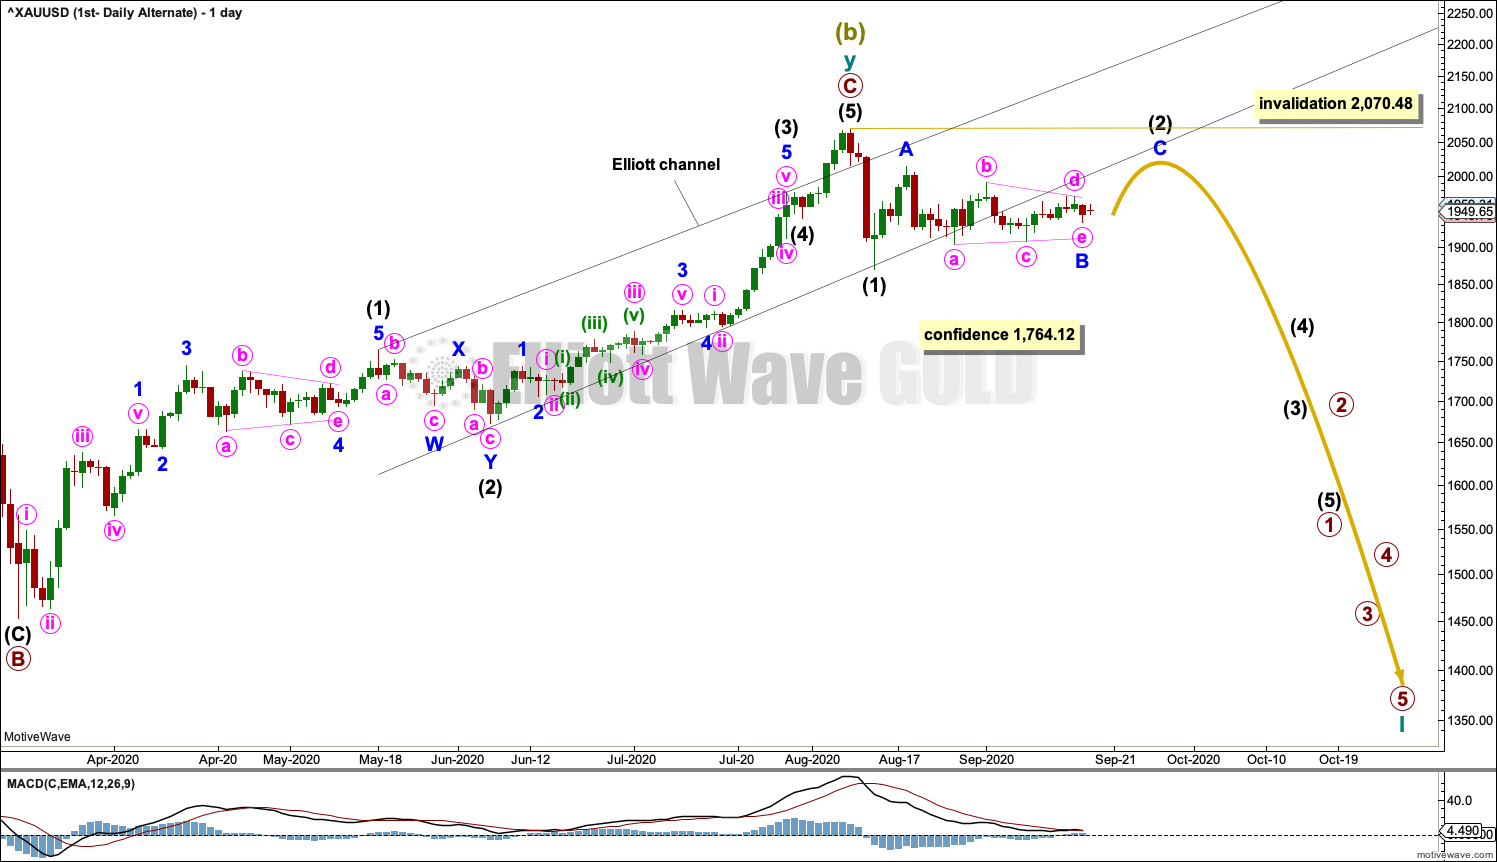
It is also possible that a Super Cycle degree trend change has occurred at the last high. However, we should always assume the trend remains the same until proven otherwise. Assume the upwards trend remains in place and the main wave count is correct until the upwards trend is invalidated with a new low below 1,764.12. At that stage, this would become the main wave count.
Intermediate wave (2) may be an incomplete zigzag. Minor wave B within it may be a complete triangle. Minor wave C would be likely to move at least slightly above the end of minor wave A at 2,014.05 to avoid a truncation. Intermediate wave (2) may not move beyond the start of intermediate wave (1) above 2,070.48.
Super Cycle wave (c) would be likely to make at least a slight new low below the end of Super Cycle wave (a) at 1,046.27 to avoid a truncation. If price provides confidence in this wave count with a new low below 1,764.12, then a target would be calculated for Super Cycle wave (c) to end.
ALTERNATE HOURLY CHART
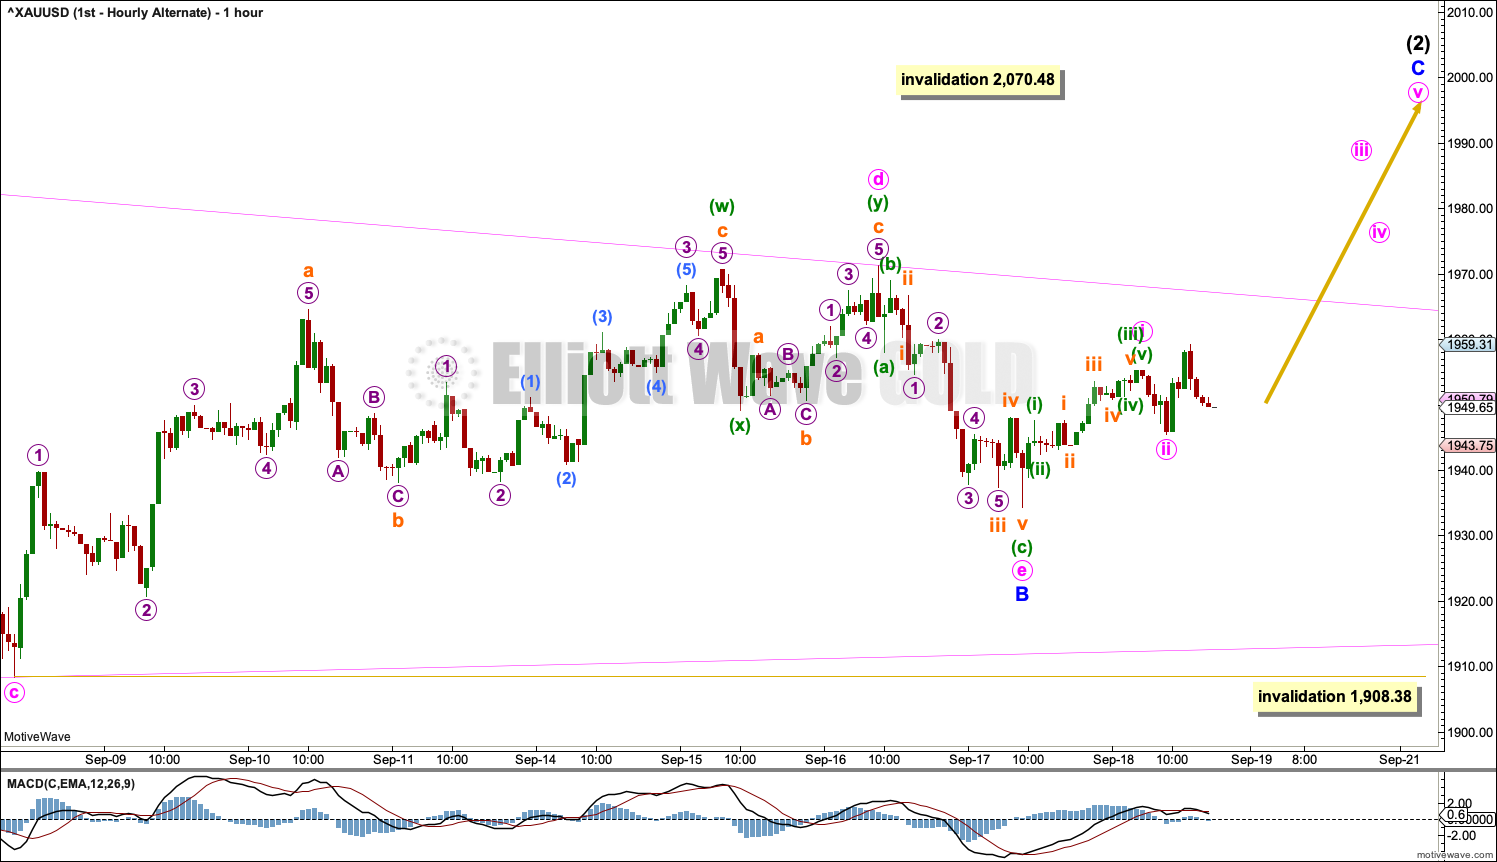
Click chart to enlarge.
Minute wave e within the triangle of minor wave B may be a complete zigzag as labelled, falling reasonably short of the lower a-c trend line.
It is also possible that minute wave e may continue lower to end closer to the a-c trend line, or to slightly overshoot the a-c trend line. Minute wave e may not move beyond the end of minute wave c below 1,908.38.
Extend the triangle trend lines outwards. The upper trend line may provide some resistance before breaking through. Thereafter, it may provide support for a pullback.
SECOND ELLIOTT WAVE COUNT
WEEKLY CHART
Click chart to enlarge.
This wave count sees the the bear market complete at the last major low for Gold on 3 December 2015.
If Gold is in a new bull market, then it should begin with a five wave structure upwards on the weekly chart.
Cycle wave I fits as a five wave impulse with reasonably proportionate corrections for primary waves 2 and 4.
Cycle wave II fits as a double flat. However, within the first flat correction labelled primary wave W, this wave count needs to ignore what looks like an obvious triangle from July to September 2016 (this can be seen labelled as a triangle on the first wave count above). This movement must be labelled as a series of overlapping first and second waves. Ignoring this triangle reduces the probability of this wave count in Elliott wave terms.
Cycle wave III may be incomplete. Cycle wave IV may not move into cycle wave I price territory below 1,303.51.
DAILY CHART
Click chart to enlarge.
Cycle wave III may be continuing higher. The daily chart focusses on primary wave 5 within cycle wave III.
Minor wave 4 may be a complete triangle.
If minor wave 4 continues lower, then it may not move into minor wave 1 price territory below 1,764.12.
HOURLY CHART
Click chart to enlarge.
Minor wave 5 must subdivide as a five wave motive structure, most likely an impulse.
Minute wave i within minor wave 5 may be complete. Minute wave ii may have moved lower as an expanded flat. If it continues further as a double flat or double combination, then minute wave ii may not move beyond the start of minute wave i below 1,908.38.
TECHNICAL ANALYSIS
WEEKLY CHART
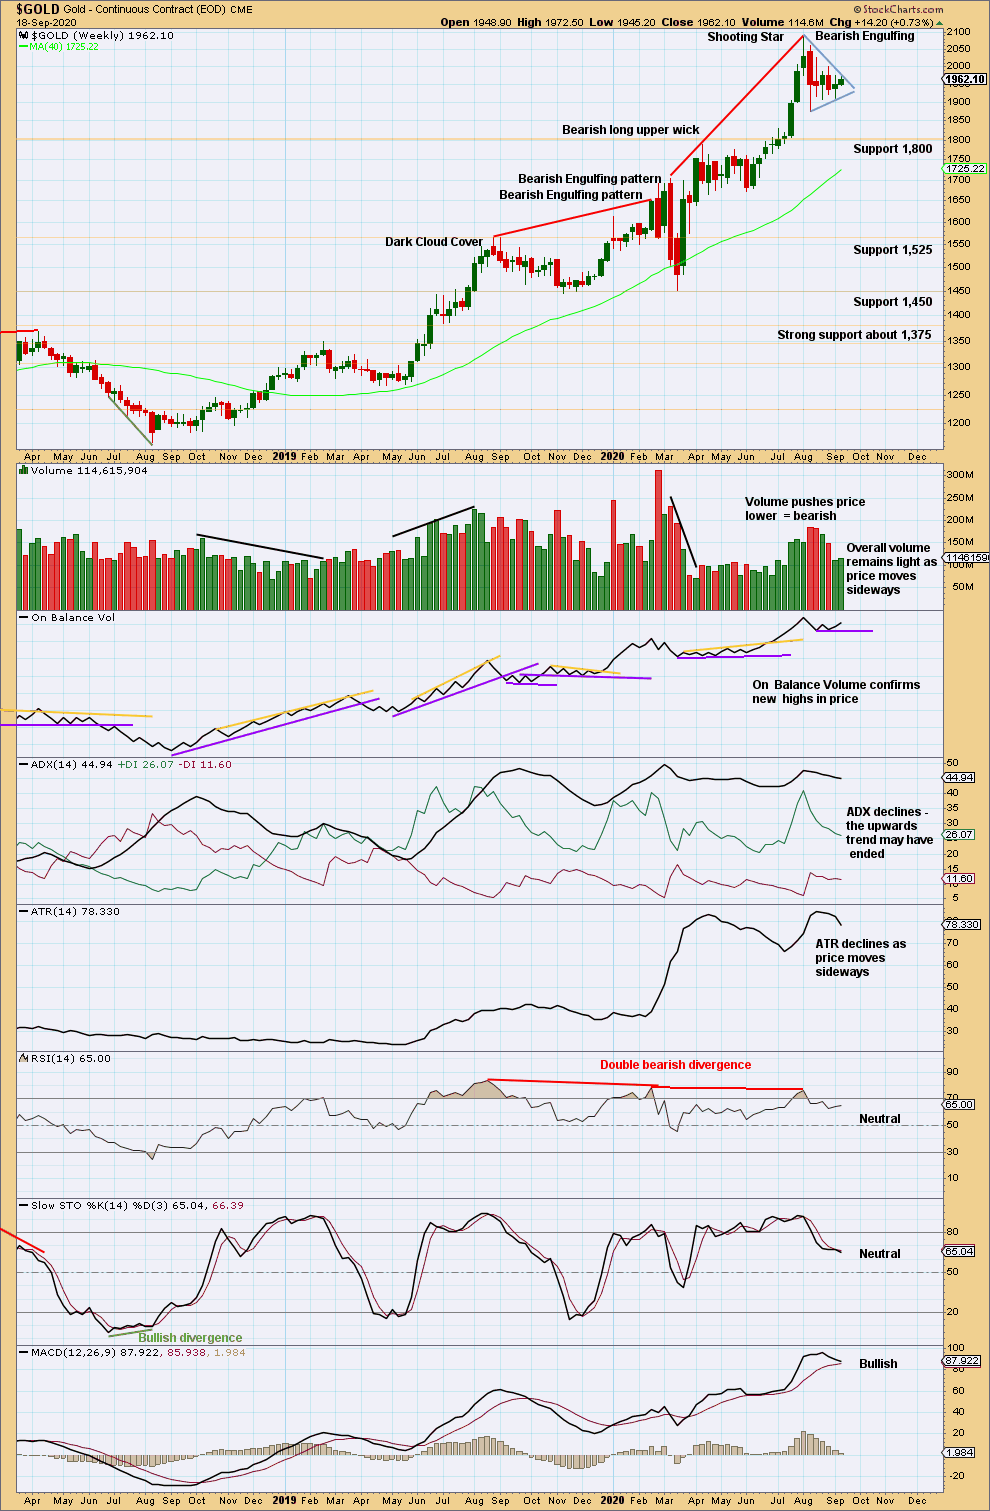
Click chart to enlarge. Chart courtesy of StockCharts.com.
The upwards trend reached very extreme and RSI reached overbought. A Shooting Star and a Bearish Engulfing candlestick pattern appear at the high. Given extreme conditions, these bearish reversal patterns should be given weight; this would support the alternate daily chart. However, it is still possible that further highs may be made before a more time consuming pullback or a 180° trend change may occur.
So far sideways movement of the last 5 weeks has brought RSI down from extreme, but not by much. ADX remains high. If the upwards trend continues here, it may be limited.
DAILY CHART
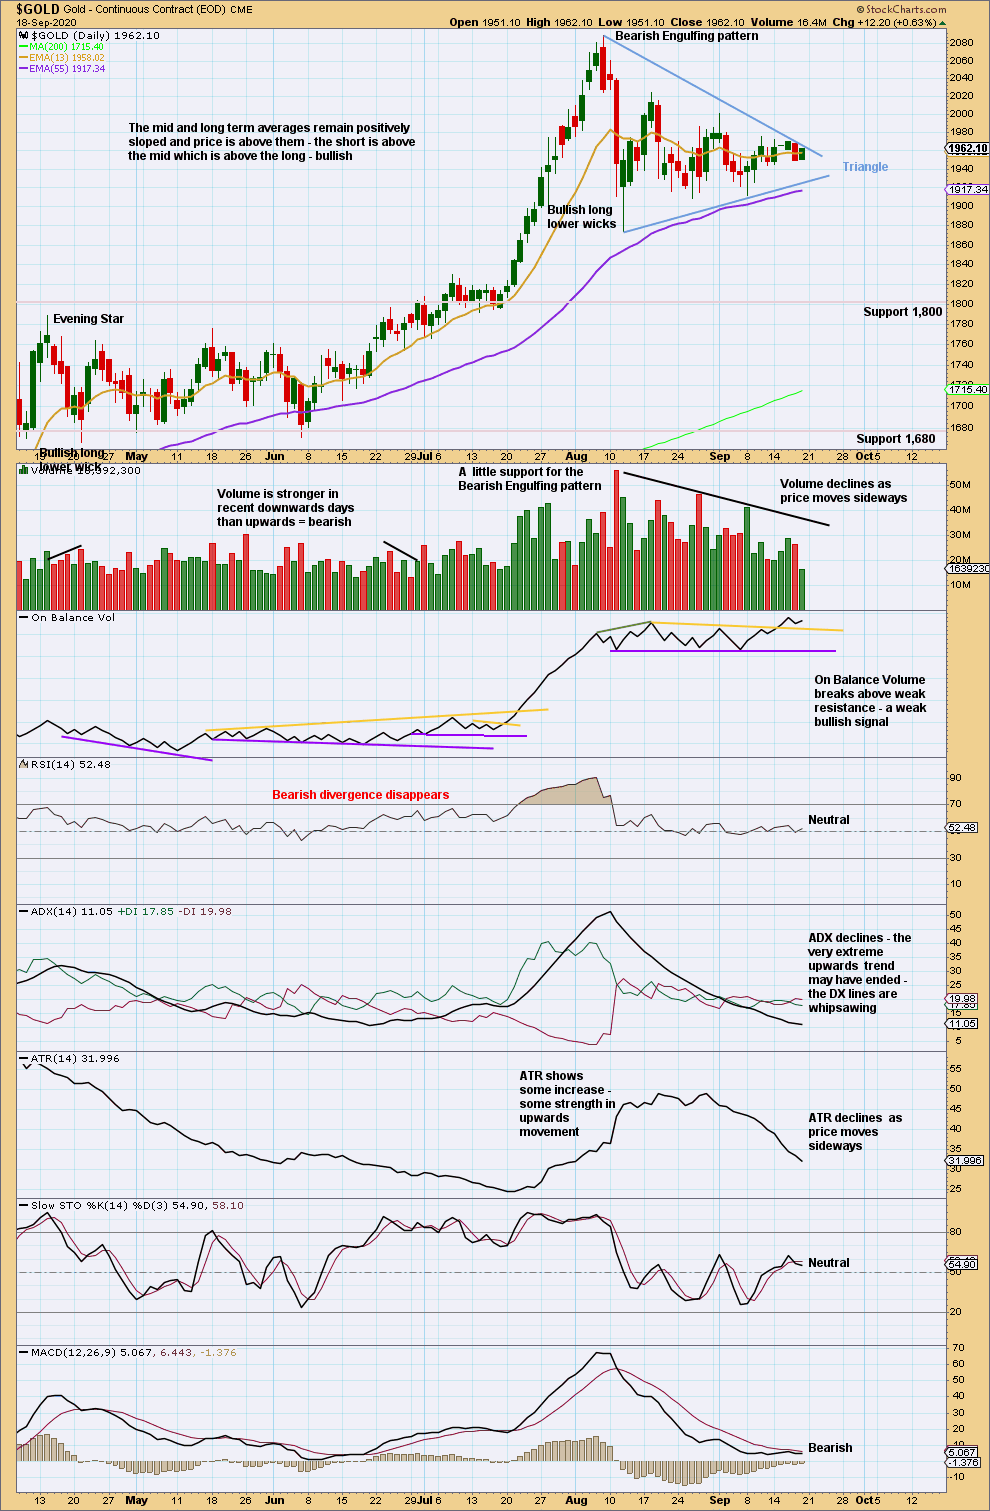
Click chart to enlarge. Chart courtesy of StockCharts.com.
Sideways movement of the last few weeks has brought ADX and RSI down from extreme. There is again room for a trend to develop.
A triangle may be forming. While Elliott wave triangles are always continuation patterns, classic triangle patterns may be either continuation or reversal patterns. A breakout of either triangle trend line is required before a target can be calculated. An upwards breakout requires support from volume while a downwards breakout does not. The short-term volume profile suggests a downwards breakout may be slightly more likely than upwards.
A breakout is defined as a close below or above triangle trend lines.
There is a clear upwards breakout from On Balance Volume, suggesting an upwards breakout from price may now come very soon. More weight should be given to this signal from On Balance Volume than the short-term volume profile. This supports the main Elliott wave count.
GDX WEEKLY CHART
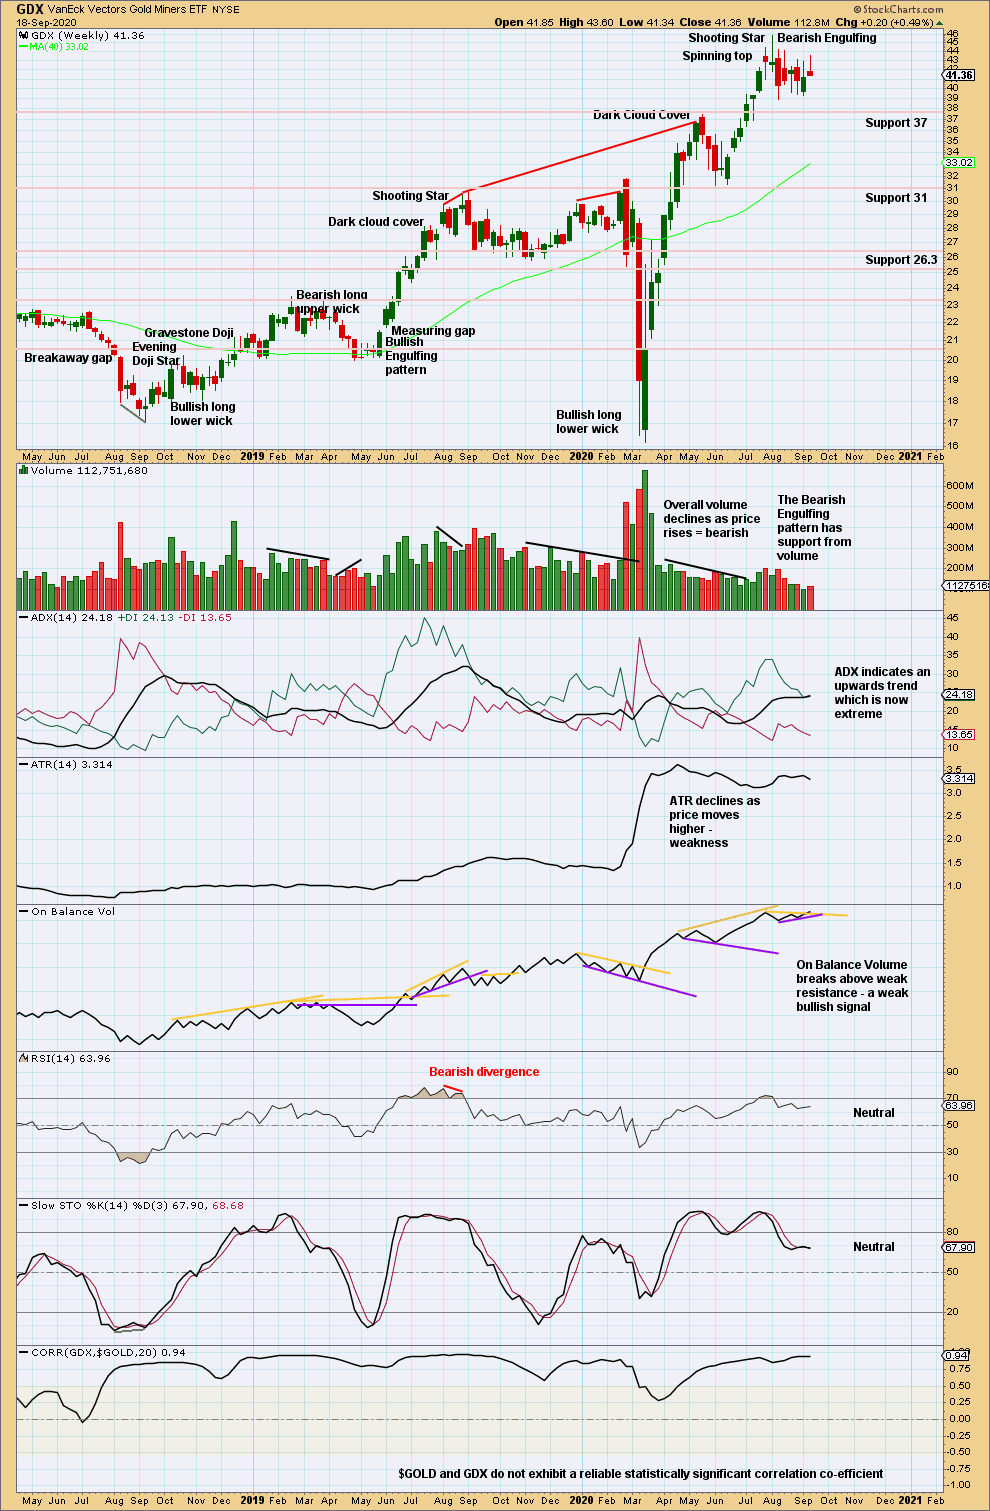
Click chart to enlarge. Chart courtesy of StockCharts.com.
Now two bearish candlestick reversal patterns in a Shooting Star and a Bearish Engulfing pattern indicate a trend change. With RSI reaching overbought at the high, these signals should be given weight. A trend change may be either a 180° change or a change to a sideways consolidation. So far it looks like a sideways consolidation may be forming. With volume declining as price moves sideways for the last 5 weeks, this so far looks like a possible consolidation within an ongoing upwards trend.
This week a weak bullish signal from On Balance Volume supports this view.
GDX DAILY CHART
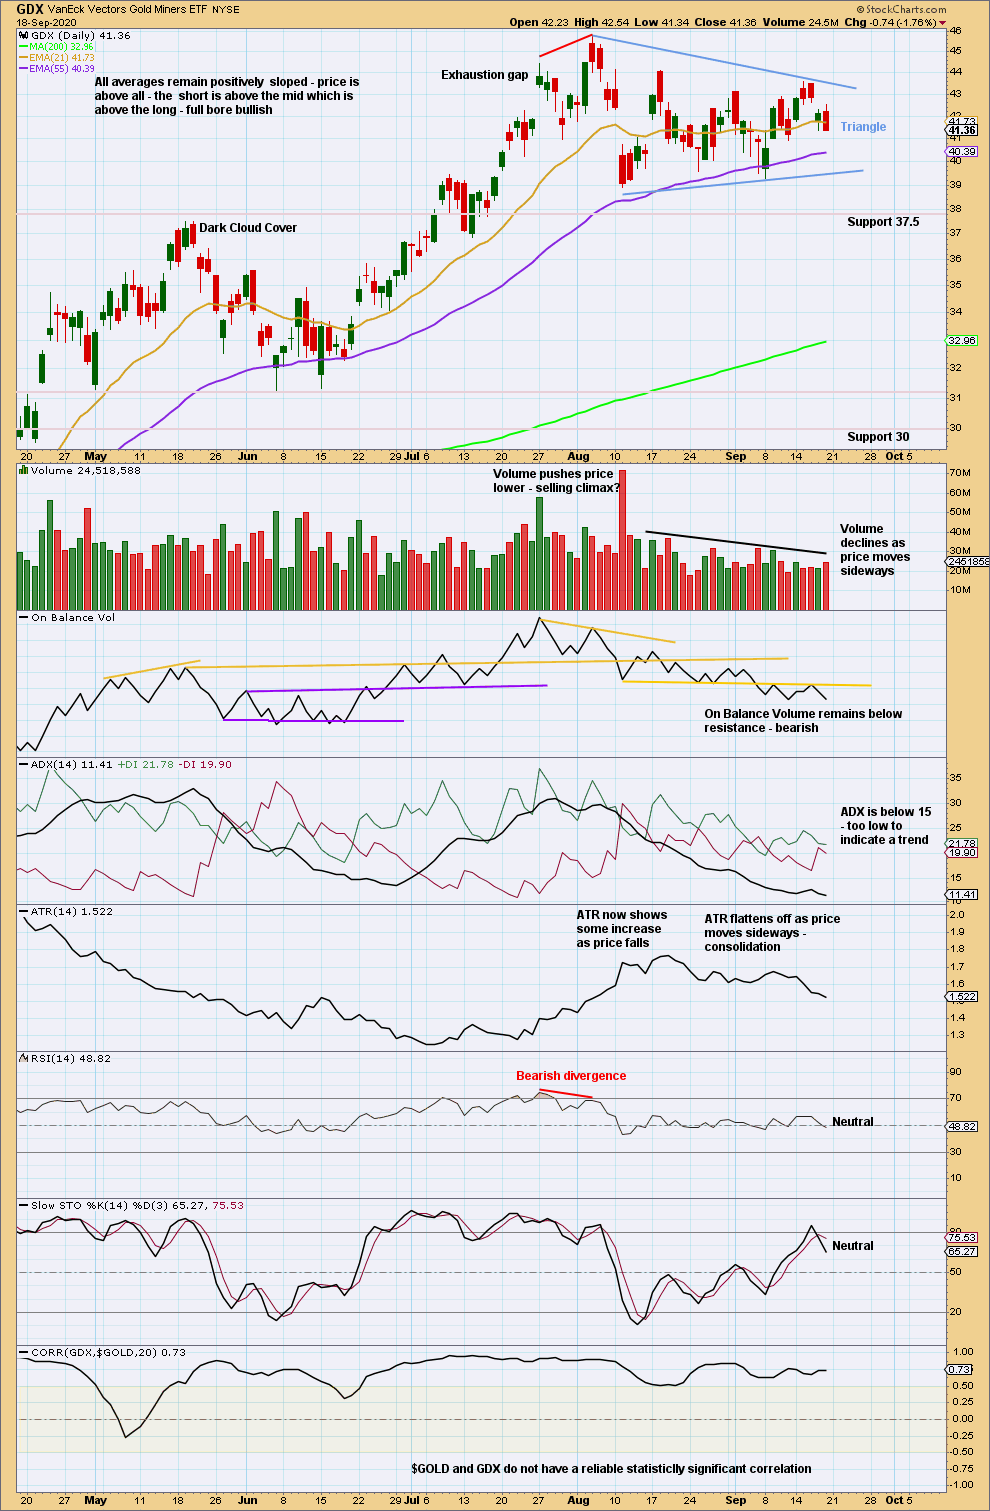
Click chart to enlarge. Chart courtesy of StockCharts.com.
A triangle may be forming. A breakout either upwards or downwards is required before a target can be calculated. An upwards breakout requires support from volume for confidence.
A bearish signal from On Balance Volume suggests a downwards breakout from the triangle may be more likely than upwards. This contradicts the signal from On Balance Volume on Gold and now also the bullish signal at the weekly chart level for GDX. The signal here at the daily chart level is stronger and may be given more weight.
There has still not been a breakout of price from the triangle.
Published @ 07:05 p.m. ET.
—
Careful risk management protects your trading account(s).
Follow my two Golden Rules:
1. Always trade with stops.
2. Risk only 1-5% of equity on any one trade.
—
New updates to this analysis are in bold.