
GOLD: Elliott Wave and Technical Analysis | Charts – October 29, 2020
Downwards movement continues towards the short-term targets on the main Elliott wave counts.
Summary: The first wave count is bearish for the bigger picture, and it has a main and an alternate daily chart. The main daily chart expects downwards movement to a target at 1,853 with a short-term invalidation point at 1,849.22. The alternate daily chart expects a multi-year bear market may be in its early stages to end below 1,046. The first short-term target is at 1,709.
The second wave count is bullish for the bigger picture, and it has a main and an alternate daily chart. The main daily chart expects downwards movement to a target at 1,853 with a short-term invalidation point at 1,849.22 (short term, both first and second wave counts have main daily charts which have the same expectation). The alternate daily chart expects a multi-month to multi-year bear market that may be in its early stages to possibly end about either 1,722.96 or 1,508.27.
Grand SuperCycle analysis is here.
Last analysis of monthly charts is here with video here.
FIRST ELLIOTT WAVE COUNT
WEEKLY CHART
Click chart to enlarge.
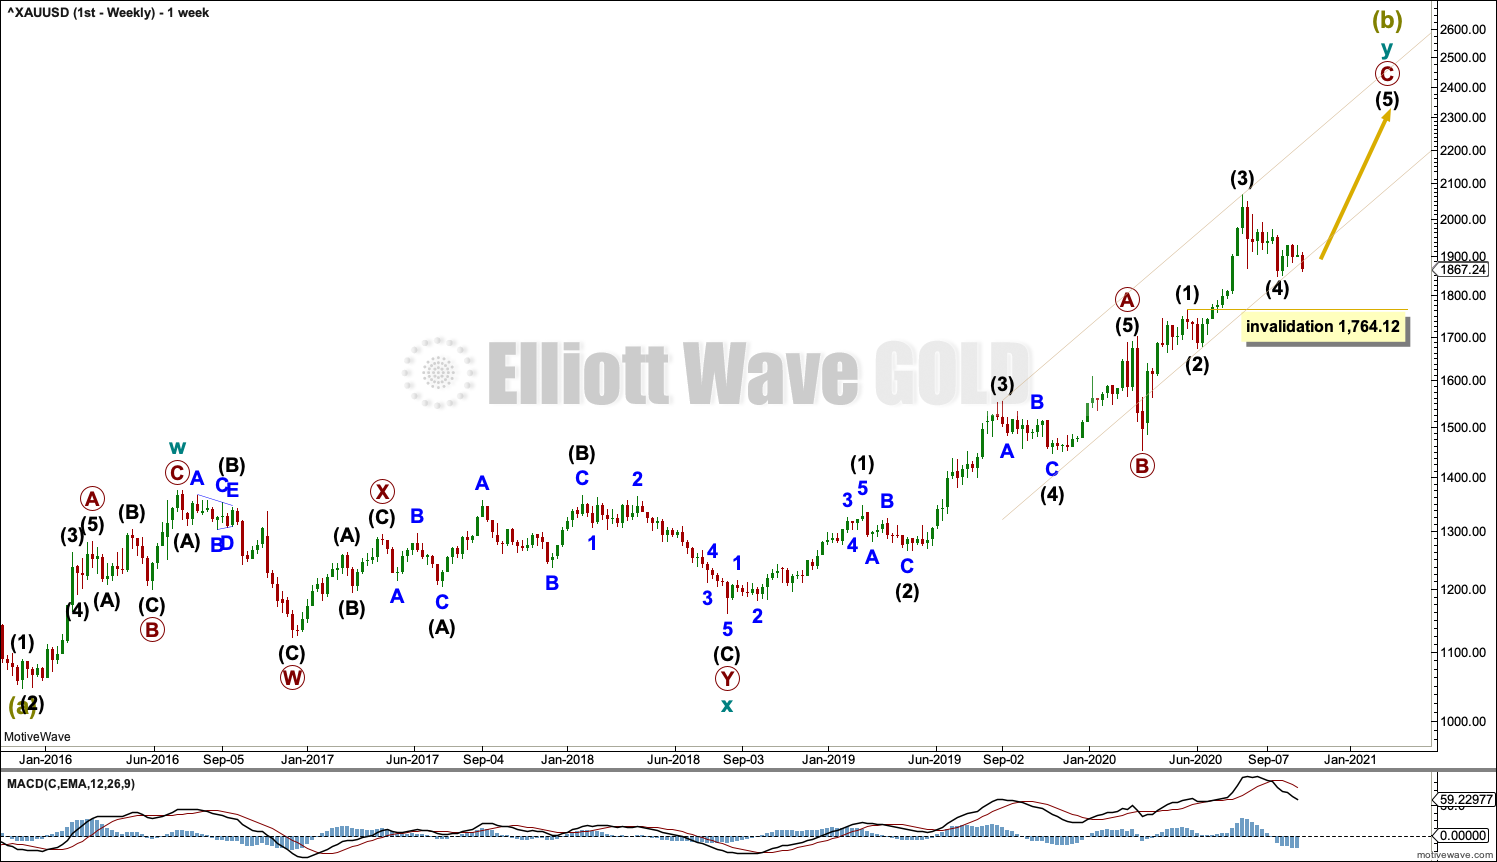
The bigger picture for this first Elliott wave count sees Gold as still within a bear market, in a three steps back pattern that is labelled Grand Super Cycle wave IV on monthly charts. Grand Super Cycle wave IV may be subdividing as an expanded flat pattern. The common range for Super Cycle wave (b) within a flat is from 1 to 1.38 times the length of Super cycle wave (a), giving a range from 1,920.18 to 2,252.27. The target would see Super Cycle wave (b) end within this most common range.
Super Cycle wave (b) within Grand Super Cycle wave IV may be an incomplete double zigzag. When Super Cycle wave (b) may be complete, then this wave count expects Super Cycle wave (c) to begin and to move price below the end of Super Cycle wave (a) at 1,046.27.
The first zigzag in the double is labelled cycle wave w. The double is joined by a three in the opposite direction, a combination labelled cycle wave x. The second zigzag in the double is labelled cycle wave y.
The purpose of the second zigzag in a double is to deepen the correction. Cycle wave y has achieved this purpose.
Primary wave C within cycle wave y may be subdividing as an impulse, which is the most common structure for C waves. Intermediate waves (1) through to (4) within primary wave C may be complete. If it continues any lower, then intermediate wave (4) may not move into intermediate wave (1) price territory below 1,764.12.
A best fit channel is drawn about primary wave C to contain as much of this movement as possible. Copy this channel over to daily charts.
We should always assume the trend remains the same until proven otherwise. At this stage, Gold is in a bull market.
DAILY CHART
Click chart to enlarge.
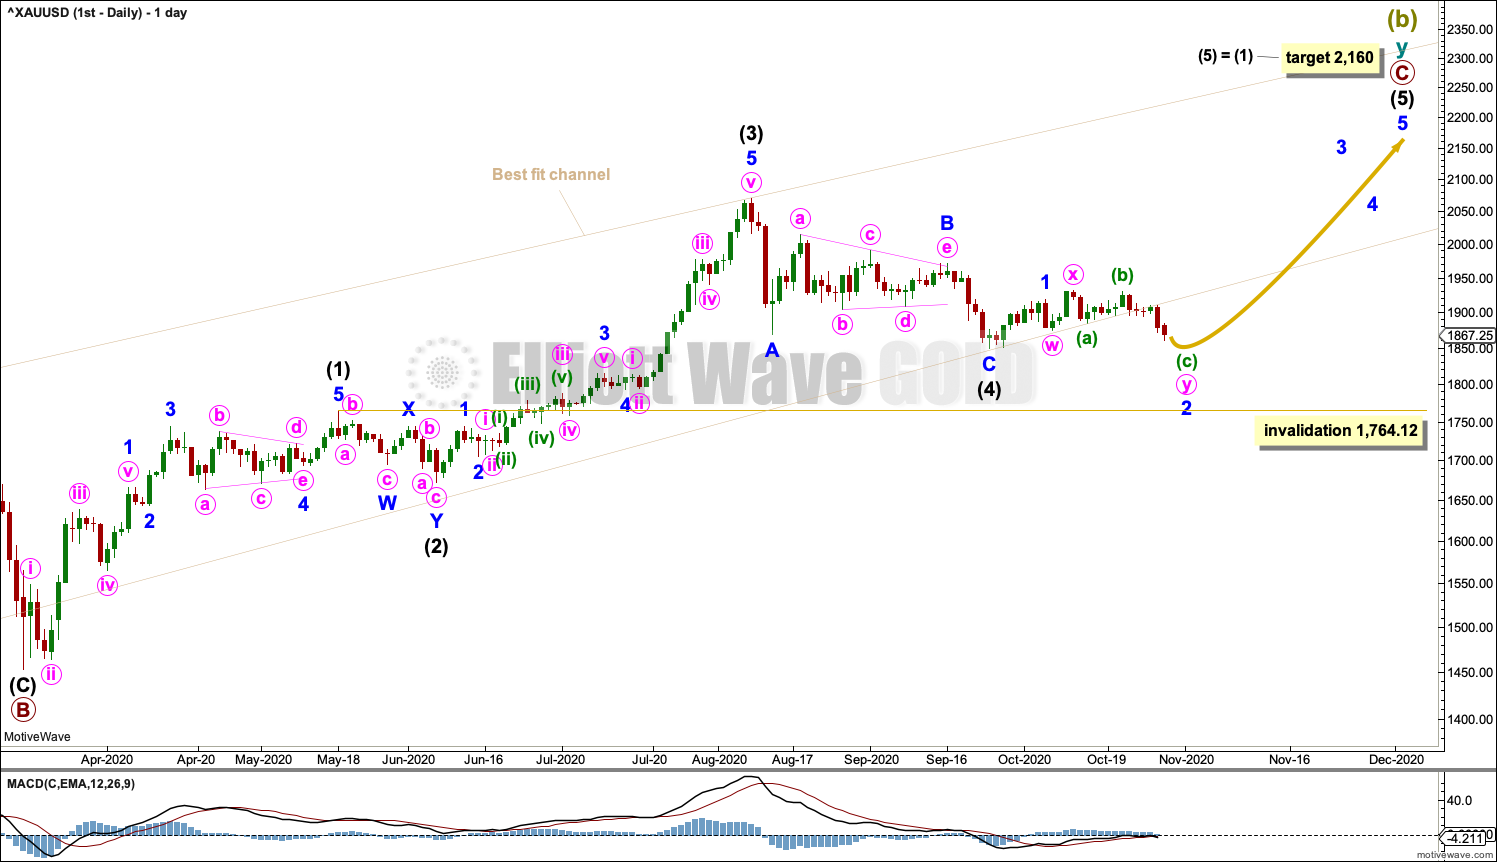
The daily chart shows detail of primary wave C as an incomplete impulse.
Intermediate waves (1) through to (4) within primary wave C may be complete. Intermediate wave (4) may be a complete zigzag.
The wide beige channel is copied over from the weekly chart. Price has now breached the channel. For this reason an alternate daily chart is considered below.
If it continues lower, then intermediate wave (4) may not move into intermediate wave (1) price territory below 1,764.12.
A target is calculated for intermediate wave (5) that expects it to exhibit the most common Fibonacci ratio to intermediate wave (1).
Intermediate wave (5) must subdivide as a five wave motive structure at minor degree. So far minor wave 1 may be complete, and minor wave 2 may be moving lower as a double combination: zigzag – X – flat.
HOURLY CHART
Click chart to enlarge.
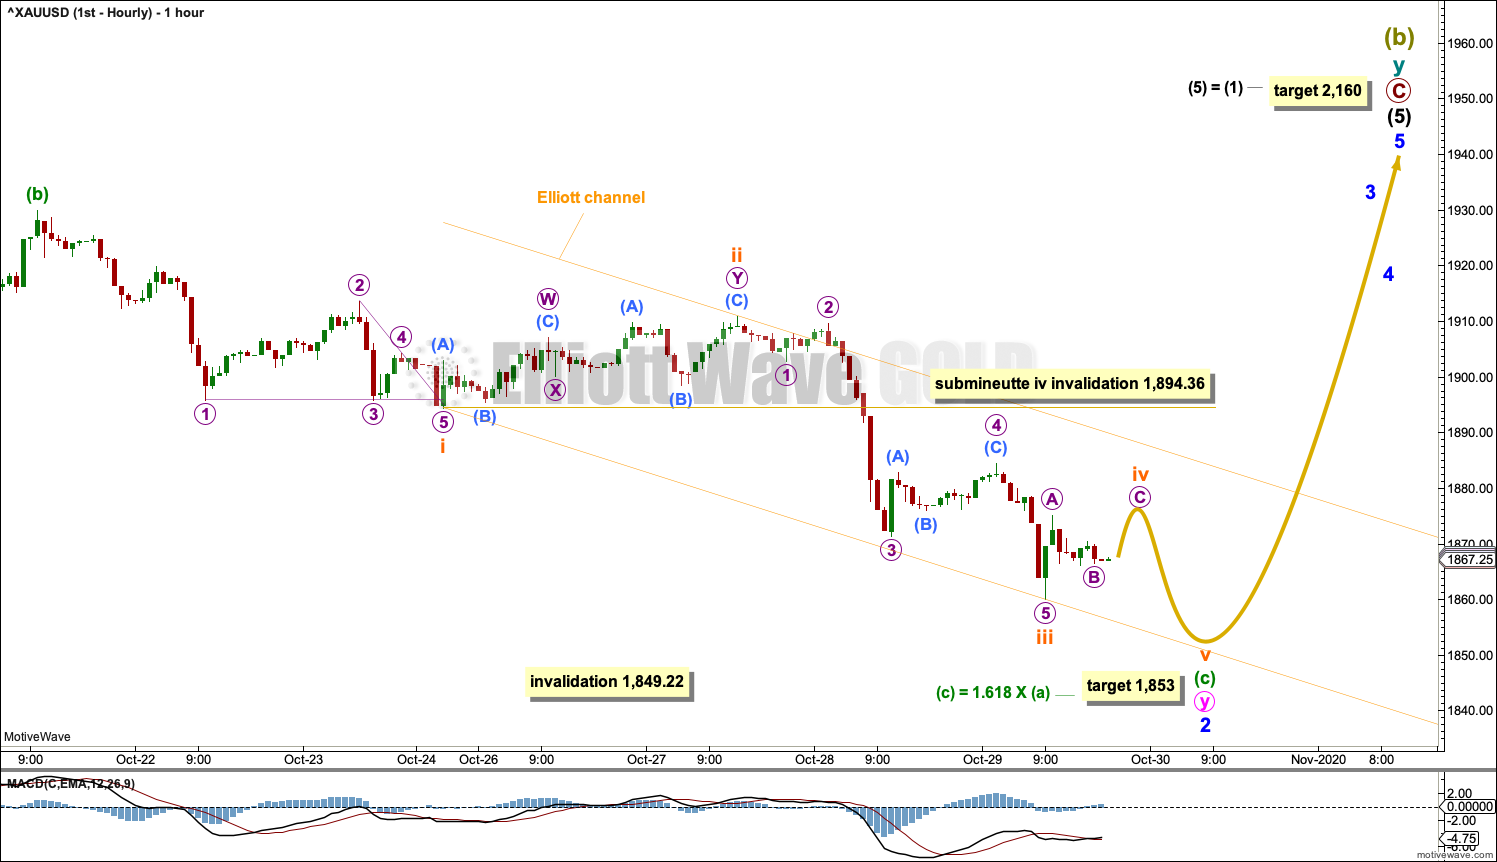
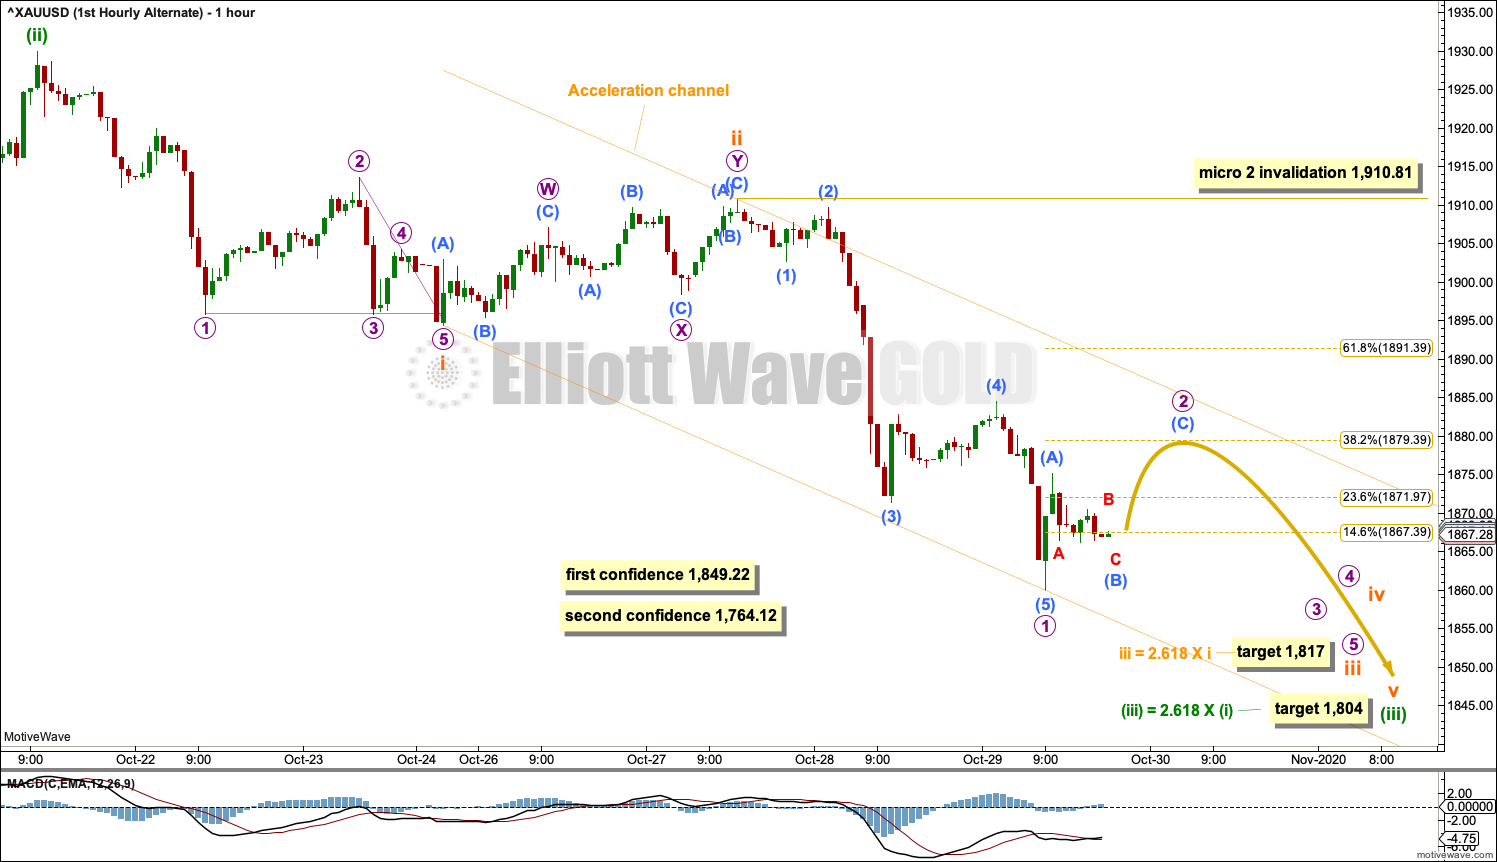
This hourly chart focusses on minuette wave (c) within minute wave y within minor wave 2. The start of minuette wave (c) is the high of 21st of October.
Minuette wave (c) must subdivide as a five wave structure at subminuette wave degree. So far subminuette waves i, ii and iii may be complete. Subminuette wave iv may not move into subminuette wave i price territory above 1,894.36.
Draw an Elliott channel about downwards movement from the end of subminuette wave i to the end of subminuette wave iii, then place a parallel copy on the end of subminuette wave ii. This channel is drawn about the impulse using Elliott’s first technique. The upper edge may now provide resistance for subminuette wave iv.
When subminuette waves iv and v may be complete, then the whole structure at all degrees of minor wave 2 may be complete. A trend change to upwards would then be expected.
Minor wave 2 may not move beyond the start of minor wave 1 below 1,849.22.
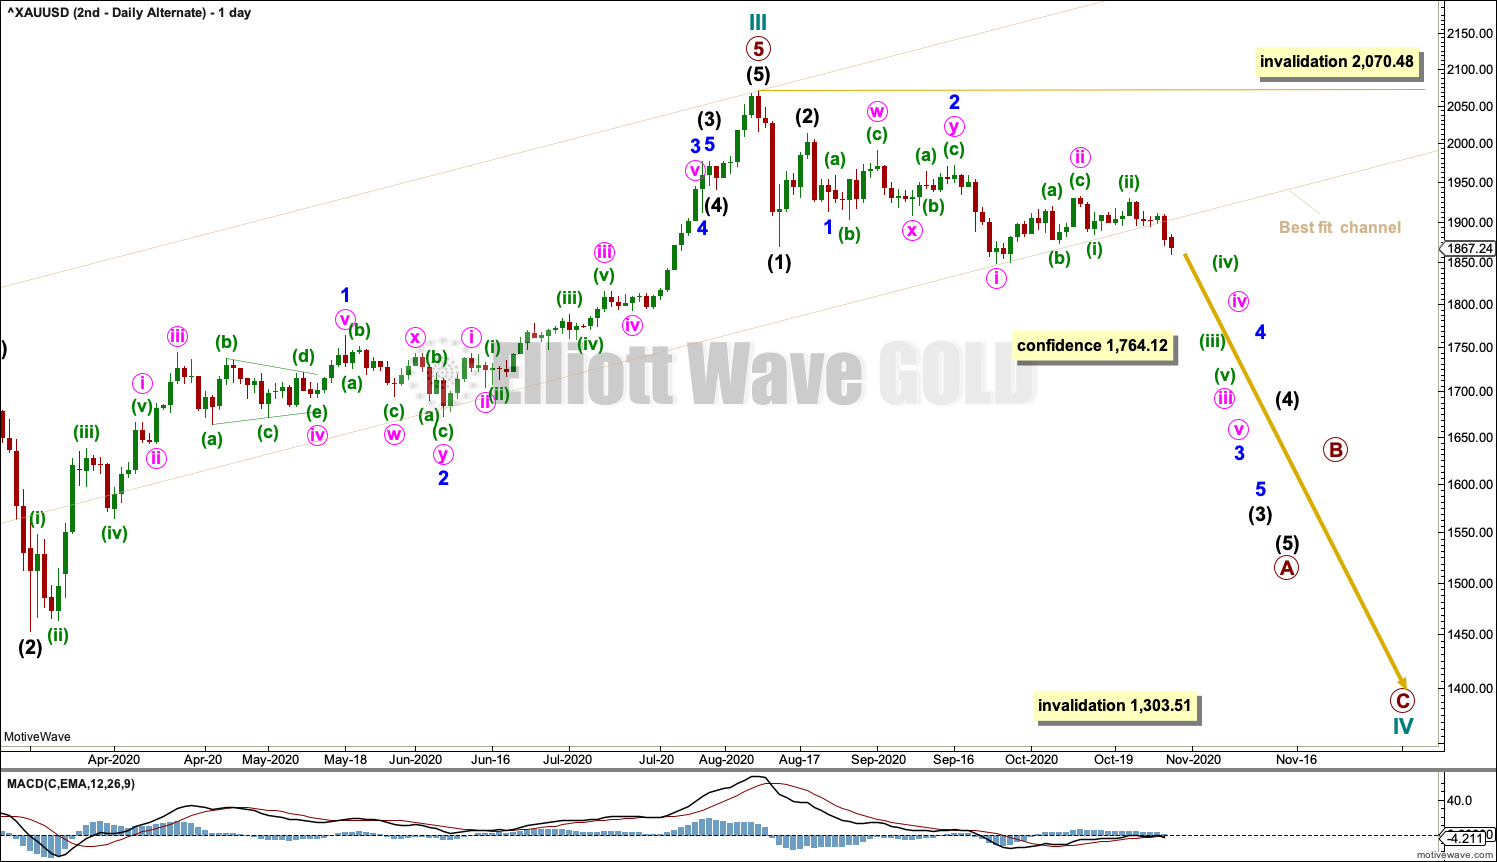
ALTERNATE DAILY CHART
Click chart to enlarge.
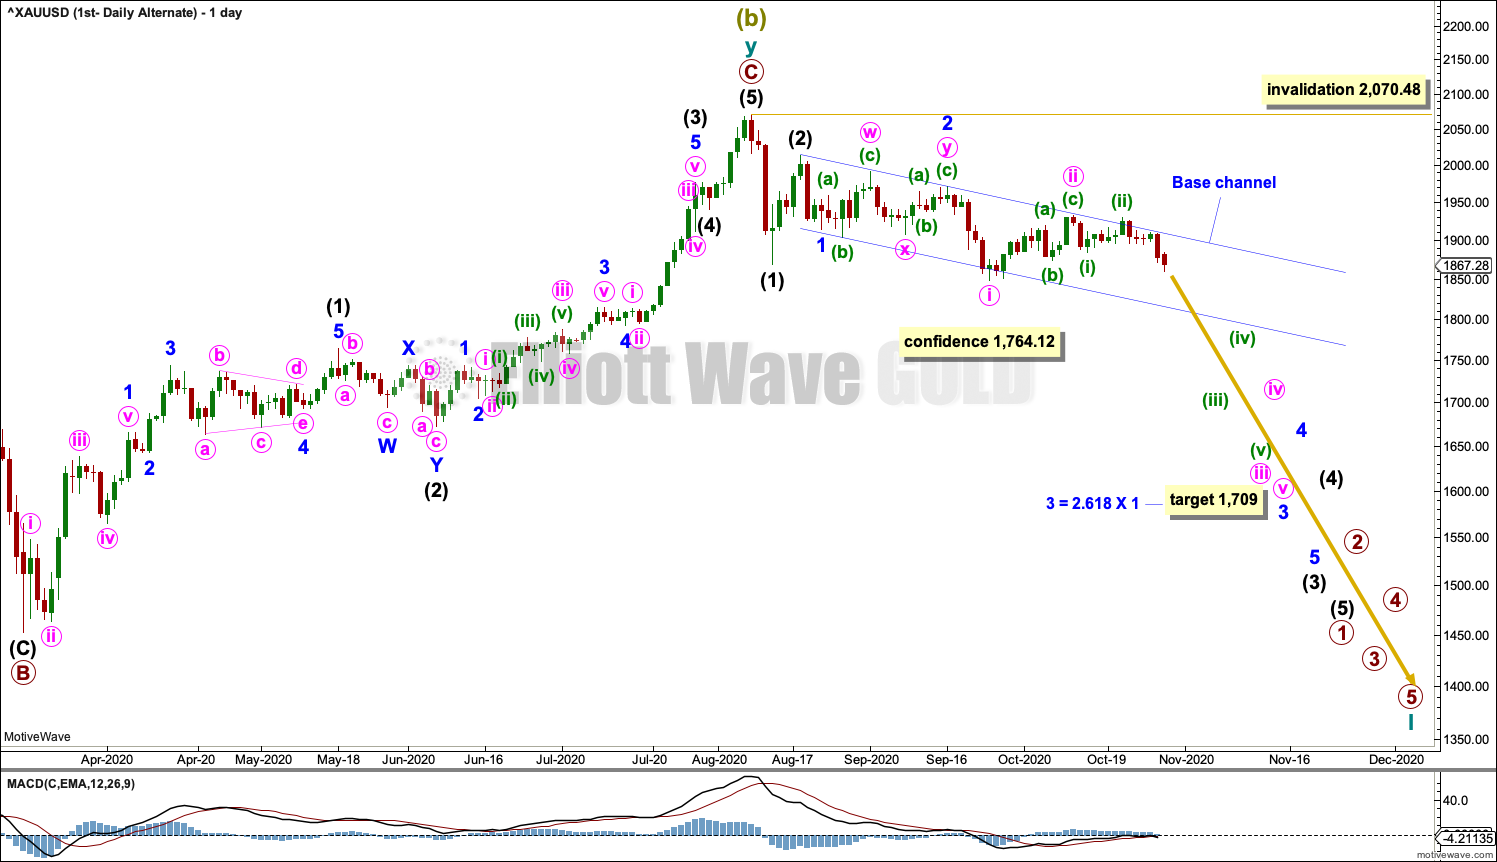
It is possible for this alternate wave count that a series of four first and second waves may be complete. A third wave down may begin to develop strength.
A new channel is drawn that may provide short-term indication of support and resistance. This is a base channel about minor waves 3 and 4. If the lower edge of this channel is breached, then that would indicate a third wave down may be developing strength.
Primary wave 2 within the new downwards trend may not move beyond the start of primary wave 1 above 2,070.48.
A new low below 1,849.22 would add initial confidence to this wave count. A new low below 1,764.12 would add reasonable confidence.
This wave count expects a further increase in downwards momentum. Either one or both of minuette wave (v) or minute wave v may end with a selling climax. Minuette wave (iv) and minute wave iv may be relatively brief and shallow.
ALTERNATE HOURLY CHART
Click chart to enlarge.
This hourly chart focusses on all movement from the high labelled minuette wave (ii).
Minuette wave (iii) may only subdivide as a five wave impulse. Subminuette waves i and ii within the impulse may be complete, and subminuette wave iii may be incomplete.
Subminuette wave iii may only subdivide as a five wave impulse. Micro wave 1 within subminuette wave iii may be complete. Micro wave 2 may not move beyond the start of micro wave 1 above 1,910.81.
SECOND ELLIOTT WAVE COUNT
WEEKLY CHART
Click chart to enlarge.
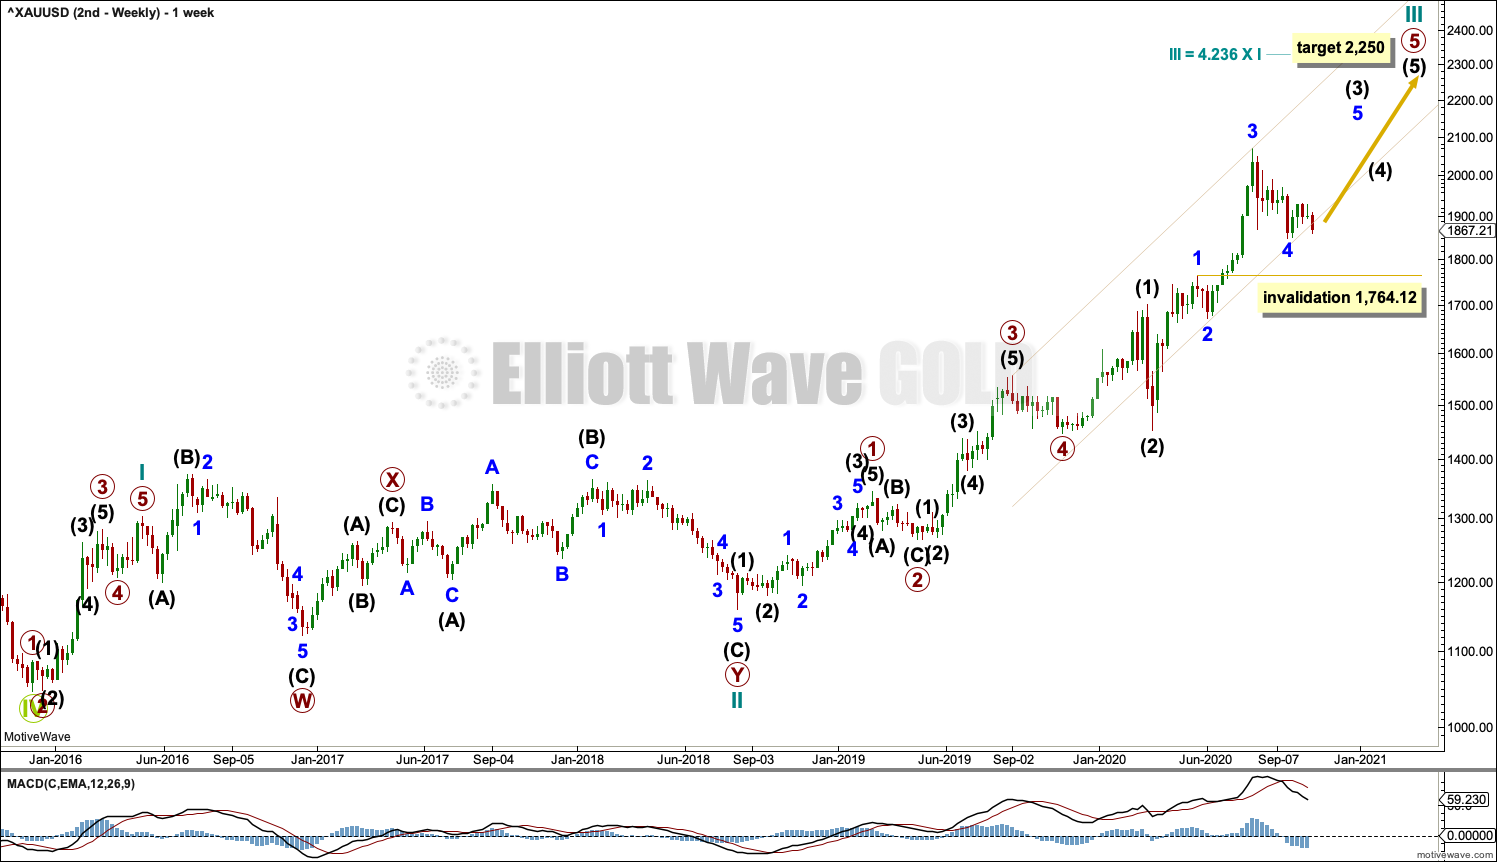
This wave count sees the the bear market complete at the last major low for Gold on 3 December 2015.
If Gold is in a new bull market, then it should begin with a five wave structure upwards on the weekly chart.
Cycle wave I fits as a five wave impulse with reasonably proportionate corrections for primary waves 2 and 4.
Cycle wave II fits as a double flat. However, within the first flat correction labelled primary wave W, this wave count needs to ignore what looks like an obvious triangle from July to September 2016 (this can be seen labelled as a triangle on the first wave count above). This movement must be labelled as a series of overlapping first and second waves. Ignoring this triangle reduces the probability of this wave count in Elliott wave terms.
Cycle wave III may be incomplete. Minor wave 4 within primary wave 5 may not move into minor wave 1 price territory below 1,764.12.
A best fit channel is drawn about cycle wave III in the same way as the channel as on the first wave count.
DAILY CHART
Click chart to enlarge.
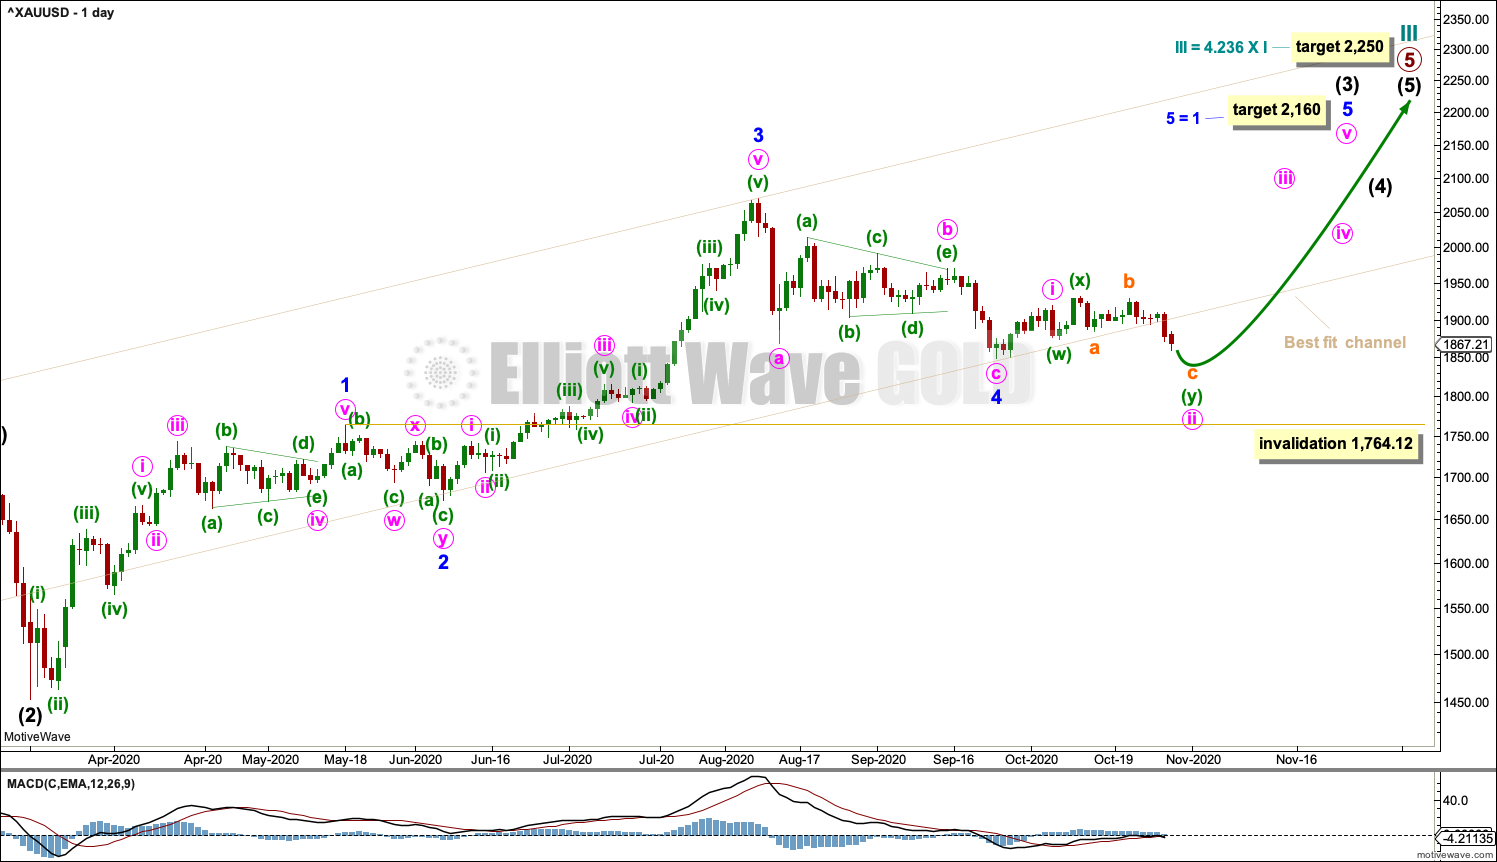
Cycle wave III may be incomplete. The daily chart focusses on primary wave 5 within cycle wave III.
Minor wave 4 may be a complete zigzag. Minute wave b within the zigzag may be a complete triangle.
If minor wave 4 continues lower, then it may not move into minor wave 1 price territory below 1,764.12.
Minor wave 5 must subdivide as a five wave motive structure. Within minor wave 5: minute wave i may be complete and minute wave ii may be an incomplete double combination: zigzag – X – flat.
HOURLY CHART
Click chart to enlarge.
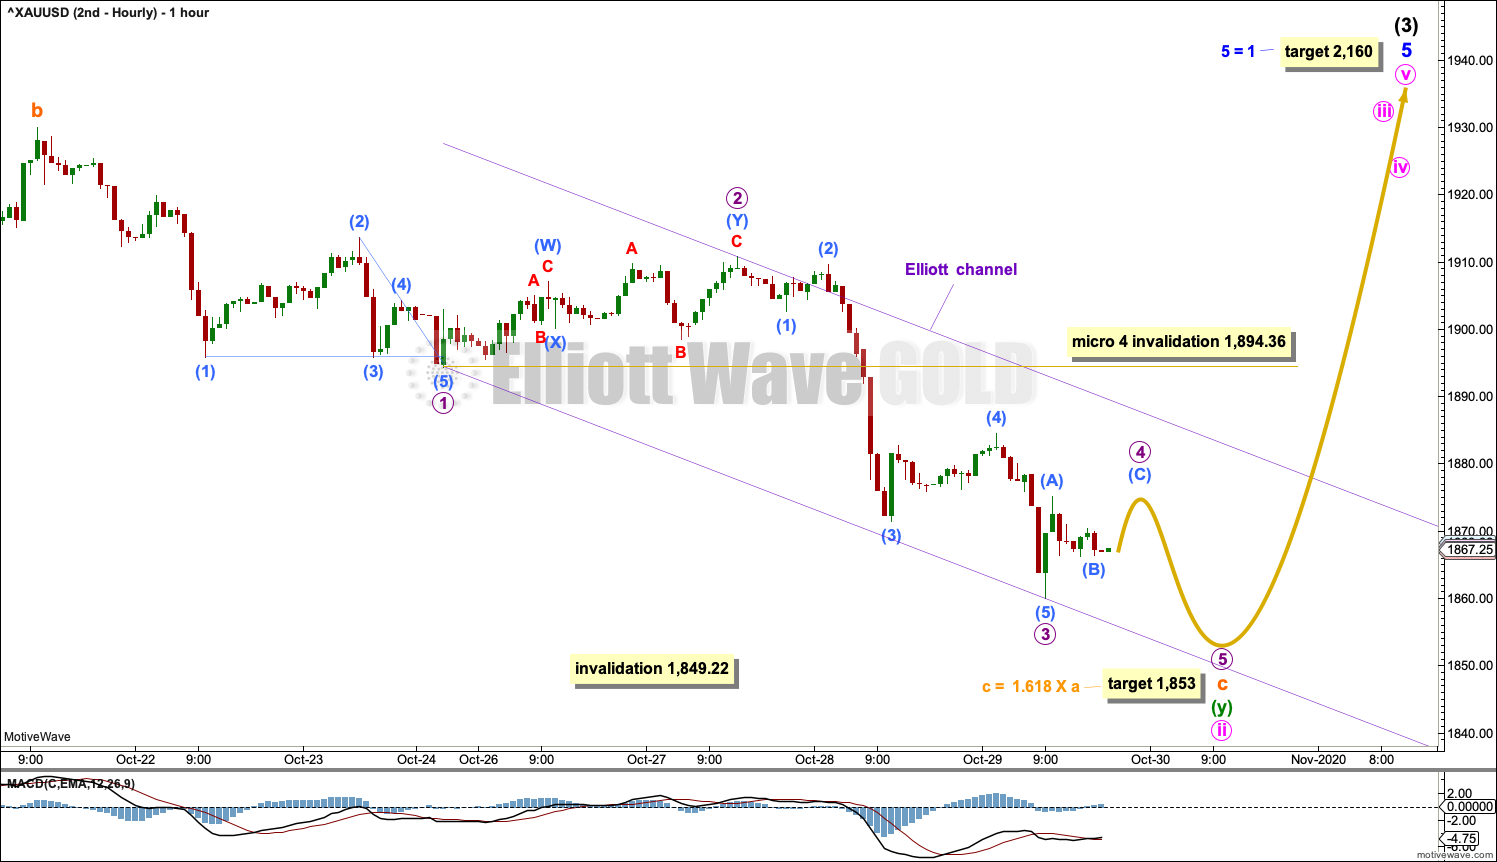
The hourly chart focusses on movement from the end of subminuette wave b within minuette wave (y) within minute wave ii. This is the high on the 21st of October, which may be seen on the daily chart.
Subminuette wave c must subdivide as a five wave structure at micro wave degree. So far micro waves 1, 2 and 3 may be complete. Micro wave 4 may not move into micro wave 1 price territory above 1,894.36.
Draw an Elliott channel about downwards movement from the end of micro wave 1 to the end of micro wave 3, then place a parallel copy on the end of micro wave 2. This channel is drawn about the impulse using Elliott’s first technique. The upper edge may now provide resistance for micro wave 4.
When micro waves 3, 4 and 5 may be complete, then the whole structure at all degrees of minute wave ii may be complete. A trend change to upwards would then be expected.
Minute wave ii may not move beyond the start of minute wave i below 1,849.22.
ALTERNATE DAILY CHART
Click chart to enlarge.
It is possible that cycle wave III is complete and cycle wave IV is in its very early stages. This alternate wave count sees the impulse upwards of primary wave 5 complete.
Cycle wave IV may subdivide as any one of more than 23 Elliott wave corrective structures. It would most likely subdivide as a zigzag. A new bearish trend at cycle degree should begin with a five wave structure downwards at the daily chart level; this would be incomplete. No second wave correction within this first five down may move beyond the start of its first wave above 2,070.48.
Targets for cycle wave IV at this stage may be calculated from Fibonacci ratios of cycle wave III. Cycle wave IV may end at either one of the 0.382 Fibonacci ratio at 1,722.96 or the 0.618 Fibonacci ratio at 1,508.27. Cycle wave IV may not move into cycle wave I price territory below 1,303.51 (this can be seen on the weekly chart).
The short-term picture at the hourly chart level for this wave count looks exactly the same as the alternate hourly-chart for the first wave count.
TECHNICAL ANALYSIS
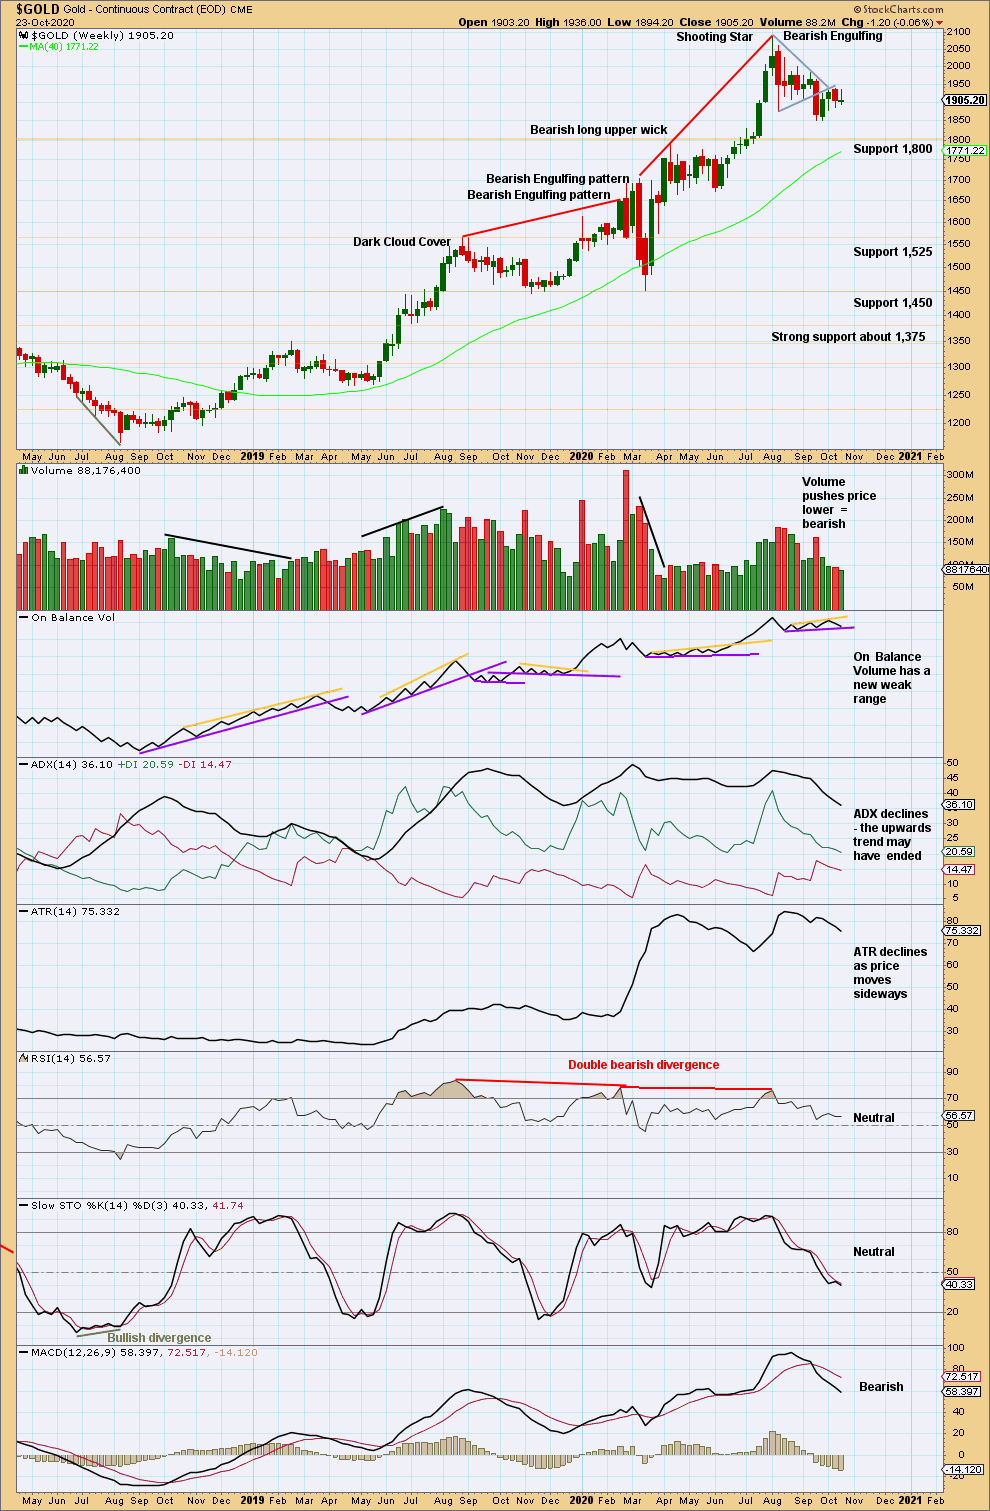
WEEKLY CHART
Click chart to enlarge. Chart courtesy of StockCharts.com.
Price has broken out downwards from a small triangle. Look for next support about 1,800.
At the last high were two bearish candlestick patterns with overbought RSI exhibiting double bearish divergence. It is possible there may have been a 180° trend change at the high. A new swing low below 1,671.70 would add confidence in that view.
Price continues to find resistance about the lower edge of the small triangle trend line. On Balance Volume is at resistance. A small range inside week last week does not change this analysis at the weekly chart level.
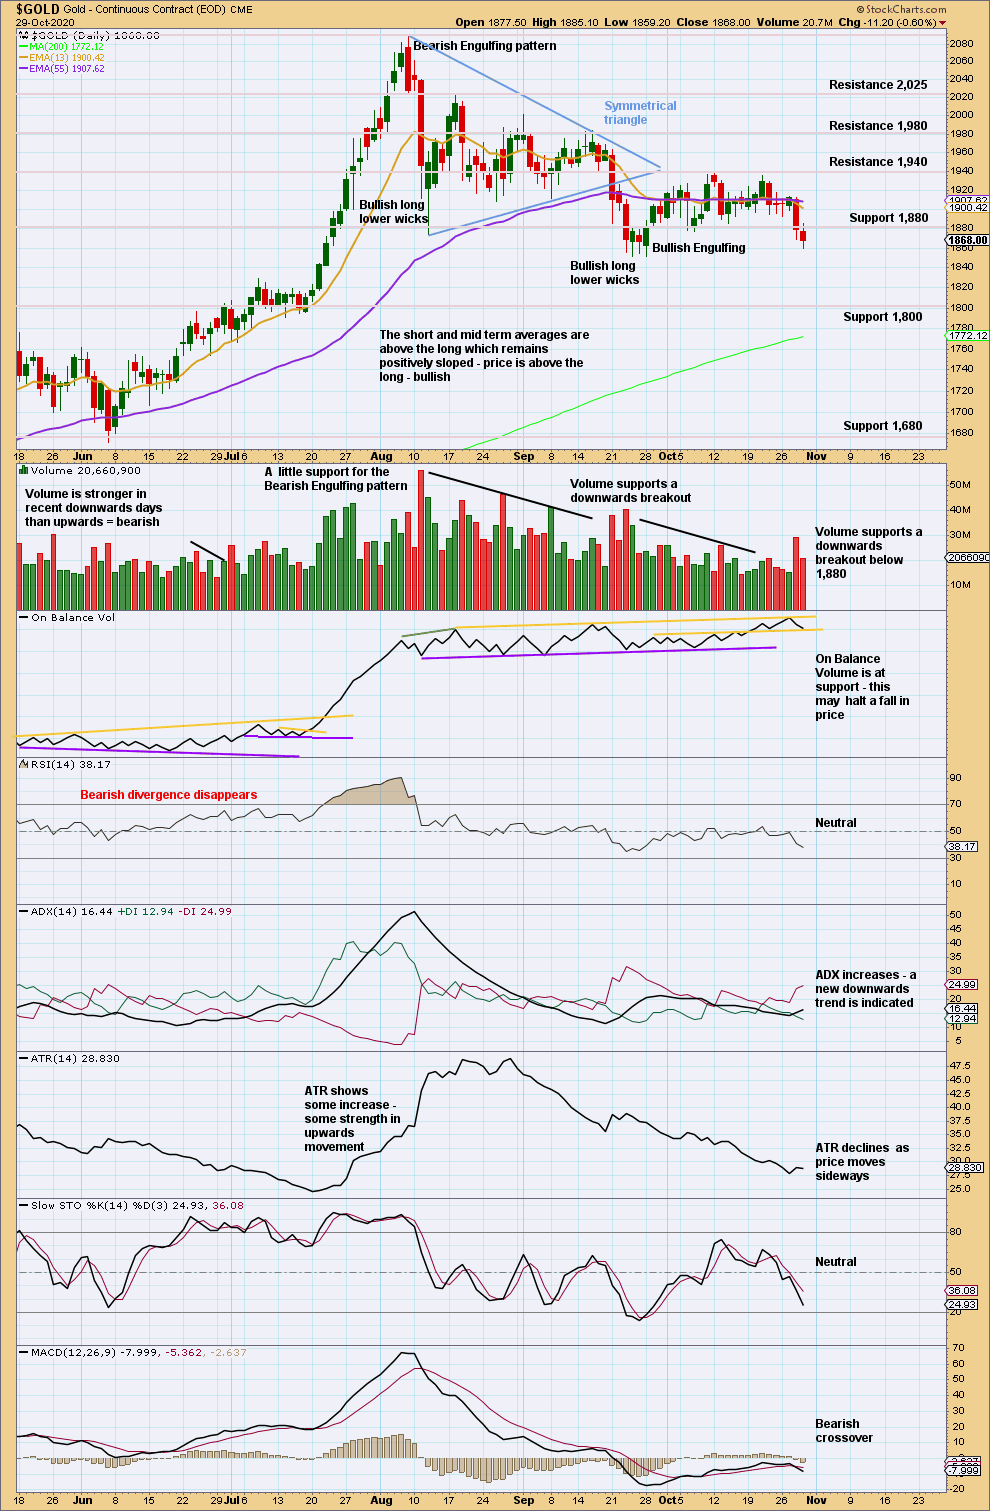
DAILY CHART
Click chart to enlarge. Chart courtesy of StockCharts.com.
A downwards breakout below support, which was at 1,880, has been effected on a strong downwards day that has good support from volume. A target calculated from the width of the consolidation zone would be at 1,843.
Support below is thin until 1,800. However, prior to that point there is some support about 1,850.
ADX indicates a new downwards trend. This chart supports either alternate Elliott wave counts.
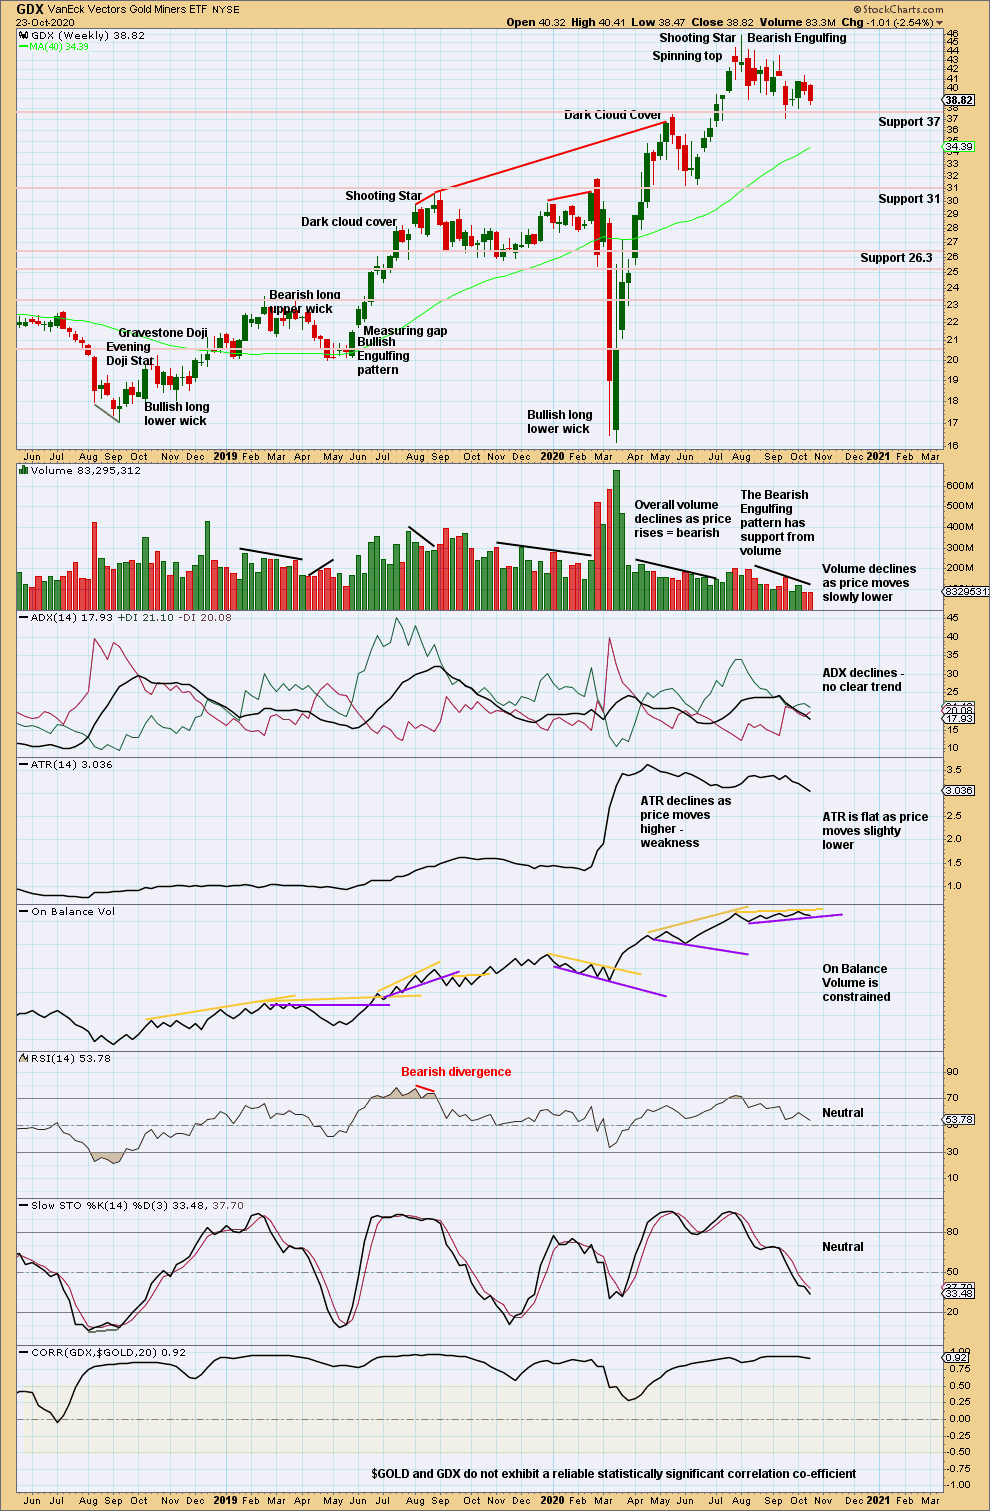
GDX WEEKLY CHART
Click chart to enlarge. Chart courtesy of StockCharts.com.
Overall, the choppy nature of downwards movement looks like a pullback within an ongoing larger bull market for GDX. This pullback may move lower before it is complete. A new low below 31.22 of the 1st of June would indicate a trend change.
GDX DAILY CHART
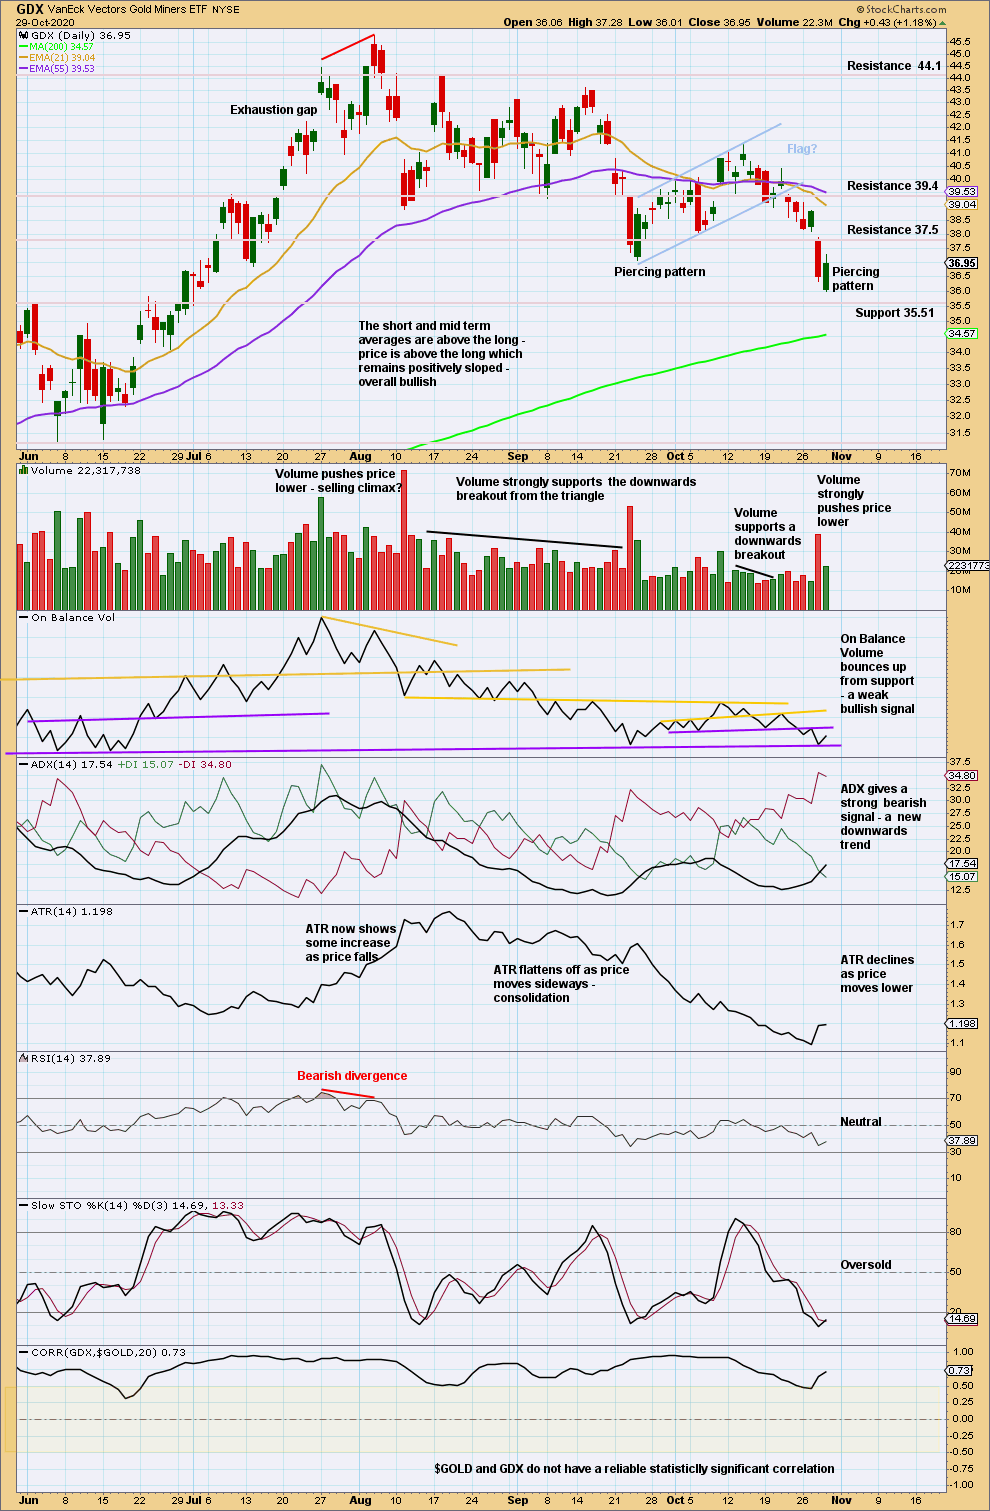
Click chart to enlarge. Chart courtesy of StockCharts.com.
Today a bullish candlestick pattern and a weak bullish signal from On Balance Volume suggest a bounce may begin here. The target from the flag pole at 33.08 may not be met on this downwards wave.
Published @ 07:11 p.m. ET.
—
Careful risk management protects your trading account(s).
Follow my two Golden Rules:
1. Always trade with stops.
2. Risk only 1-5% of equity on any one trade.
—
New updates to this analysis are in bold.